© Universiti Tun Hussein Onn Malaysia Publisher’s Office
JTMB
http://penerbit.uthm.edu.my/ojs/index.php/jtmb
Journal of
Technology
Management and
Business
ISSN : 2289-7224 e-ISSN : 2600-7967Assessing the Effectiveness of Fire Safety Management from
the FSM Stakeholders’ Perspective: A Pilot Study
Ibrahim Yakubu Ebenehi
1,2*, Sulzakimin Mohamed
1, Norliana Sarpin
1,
Adejoh Ahmodu Adaji
1,3, Roshartini Omar
1, Seow Ta Wee
11Department of Construction Management, Faculty of Technology Management & Business, Universiti Tun Hussein Onn Malaysia,
Parit Raja, Batu Pahat, Johor, 86400, MALAYSIA
2Department of Building Technology, the Federal Polytechnic Bauchi,
Gwallameji Village, Off Dass Road, Bauchi-Tafawa Balewa, Bauchi, PMB 0231, NIGERIA
3Department of Building Technology, Kogi State Polytechnic Lokoja, Lokoja, PMB 1101, NIGERIA
*Corresponding Author
DOI: https://doi.org/10.30880/jtmb.2019.06.01.005
Received 16 March 2019; Accepted 7 April 2019; Available online 15 May 2019
Abstract: Malaysian education sector of the economy, particularly the higher education, had been making huge investments towards fulfilling a target of producing an attractive environment, conducive to learning and academic excellence. Building facilities account for a significant portion of investments in the sector. It has become imperative to research ways of ensuring the safety of built facilities and users from fire disaster since no building has immunity against fire. This research aims to develop a framework for effective fire safety management (FSM) for buildings in Malaysian Higher Education Institutions. This report displays the results of the pilot study conducted among staff from the facilities management, occupational safety health and environment (OSHE) and security departments from selected universities in Johor Malaysia prior to carrying out the core survey to collect information from target respondents. The pilot study shall help to minimise errors in the questionnaire, ensures the smooth running of the survey, facilitate the response rate, and provide a useful and valuable inquiry. The results include the descriptive statistics, reliability test, content and construct validity, the normality test, and factorability. The summary of the reliability test for each construct of the FSM Stakeholders’ questionnaire, are Management and maintenance, 0.962; fire safety equipment/system, 0.921; building components safety design, 0.965, and the effectiveness of fire safety management have a value 0.916 for Cronbach alpha coefficient. The aggregate Descriptive Statistics results for the stakeholders’ questionnaire show mean values between the ranges of 3.08 to 4.07. The questionnaire had low dispersion and standard deviation values of less than 1. The values of skewness and kurtosis were all within the recommended limit of -/+2, which indicates the normal distribution of all the constructs of the study. The results are a positive indicator to use the instrument for the primary survey.
1.
Introduction
Fire Safety Management (FSM) denotes the implementation of policy, standards, tools, information, and practices in an organisation directed towards analysis, evaluation, and control, of fire safety (Howarth and Kara‐ Zaitri, 1999). It is a continuous process of maintaining fire safety to reduce the number of fire incidents, the risk to lives and property to an extremely low and acceptable level (Hassanain, 2009; Billington, Copping, and Ferguson, 2002; Ramachandran, 1999). According to the Society of Fire Protection Engineers, SFPE (2005), FSM is a process of deciding the type of activities needed on the identification of fire hazards, exposure of populations, and prediction of foreseeable risks.
FSM roles are vital in the prevention and control of fires, the building occupants’ evacuation, as well as the maintenance of safety systems. Also, as part of management procedures, the involvement of an independent auditor is necessary to regularly carry out fire protection audit at least two times a year (British Standards Institution, 1999; Chow, 2001). Yueng (2007) asserted that a properly managed building reduced the chances of fire outbreak and increased the possibility of successful occupants’ evacuation in the event of an emergency.
Pilot testing of questionnaire survey is a crucial aspect in research design because; it helps to get the wordings of the questionnaire correctly and to increase the reliability, validity, and practicability of the survey (Cohen, Manion, and Morrison, 2013). It involves primarily the administration of the questionnaire to several respondents who are a representative of the target research sample and the subsequent use of statistical analysis and feedback to reduce the number of items in the questionnaire into a manageable number. Cohen et al., (2009) highlighted that the pilot data obtained from the pilot test is analysed to determine the following:
- Reliability - Collinearity - Multiple regression - Factor analysis
This research aims to develop an effective fire safety management framework for building facilities in Malaysian Higher Education Institutions (HEIs). The following research objectives were formulated to achieve the stated aim: 1. To investigate current practices in fire safety management for university buildings in Malaysia
2. To determine critical factors contributing to the effective management of fire safety for university buildings in Malaysia
3. To examine the users/occupants’ perception on, awareness of, and attitude toward, fire safety in Malaysian Higher Education Institutions (HEIs) buildings
4. To determine the relationship between users/occupants’ perception on, awareness of, and attitude toward, fire safety and effectiveness of fire safety management in Malaysian (HEIs) buildings
5. To develop and validate a framework for effective management of fire safety for university buildings in Malaysia.
2.
Pilot Study
Prior to conducting the main survey among respondents by collecting information to achieve the stated objectives, we carried out a pilot study. The purpose of the pilot study was to ensure the reliability and validity of the developed research instrument to minimise errors in the questionnaire, makes survey runs smoothly, facilitate response rate, and provide a useful and valuable inquiry (Muijs, 2004; Fink, 2006). Mathers, Fox, and Hunn (2007) pointed out that pilot-testing of questionnaire ensures the inclusion of all relevant issues; the correctness of its order; identification of ambiguous or misleading statements, and make sure there is no omission of any critical matter from the questionnaire. Pilot study improves the quality and structure of a survey (Creswell, 2013; Lodico et al. 2006). Collins and Hussey (2003) suggest testing a questionnaire through a pilot study irrespective of how best is its perceived design. The pilot sample comprises of participants selected at random and are given the survey to complete and requested to examine the study from different perspectives such as basic spelling and grammar, clarity of language and terms, breadth and depth of sub-questions and items, as well as overall psychometric properties of the instrument (Lodico et al. 2006).
3.
Pilot Instrument Administrations
Table 1 shows the number of questionnaires administered to the respondents. We distributed a total of 60 questionnaires to FSM Stakeholders in Malaysian HEIs of which 91.7 percent were returned. However, of the returned questionnaire two were discarded due to issues of outliers and missing entries leaving 88.3 percent valid response for the analysis, which shows good response rate.
Table 1 - Pilot Instrument administration
Number of: FSM Stakeholders
Frequency Percent
Questionnaires Administered 60 100
Returned 55 91.7
Valid and Usable 53 88.3
Table 1 shows the distribution of questionnaires; the numbers returned and considered valid for analysis.
4.
Data Descriptive, Normality, Reliability and Factorability
4.1 Stakeholder of Fire Safety Management in Malaysian HEIs
This section provides the result of the pilot study descriptive, normality, reliability and factorability according to the constructs in the FSM stakeholders’ questionnaire. These constructs are Management and maintenance, fire safety equipment/system, building components safety design, and the effectiveness of fire safety management.
4.2
Management and Maintenance
Table 2 - Pilot Result for Management and Maintenance
Code Mean
Normality Factor
Loadings
Variance
Explained
Cronbach
Alpha Skewness Kurtosis
Mgt_2.1 3.17 -.247 1.265 .664 61.20 0.962
Mgt_2.2 3.15 -.207 1.437 .622
Mgt_2.3 3.19 -.617 1.928 .821
Mgt_2.4 3.11 -.217 .750 .824
Mgt_2.5 3.11 -.474 1.454 .877
Mgt_2.6 2.92 -.047 -.213 .789
Mgt_2.7 2.77 -.331 -.356 .750
Mgt_2.8 3.11 -.586 2.058 .823
Mgt_2.9 3.15 -.233 .958 .639
Mgt_2.10 2.96 -.841 2.170 .813
Mgt_2.11 3.13 -.870 1.662 .923
Mgt_2.12 3.21 -.635 .941 .732
Mgt_2.14 3.17 -.617 1.479 .832
Mgt_2.15 2.96 -.484 1.371 .707
Mgt_2.16 3.02 -.294 .920 .775
Mgt_2.17 3.04 -.669 .842 .842
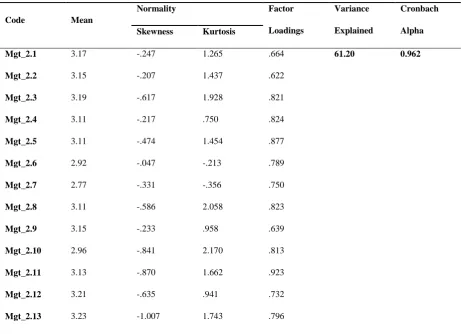
Table 2 shows the pilot result for the Management and Maintenance construct which produces mean values ranging from 2.77 to 3.23. The values of skewness and kurtosis were all the threshold of -/+2 (George & Mallery, 2010) except for Mgt_2.8 and Mgt_2.10 which have kurtosis value above 2. All the variables under the construct have strong factor loadings which cumulatively explained 61.20 percent of the variance which is considered satisfactory. The reliability of the construct was assessed using Cronbach’s alpha coefficient which produced a value of 0.962 above the recommended minimum threshold of 0.7 (Tabachnick & Fidel, 2007; George & Mallery, 2010; Pallant, 2011).
This result indicated that the result obtained is adequate; the data is normally distributed and reliable. Hence, the instrument is considered valid for the major survey of the research except for Mgt_2.8 and Mgt_2.10 which require further amendment.
4.3
Fire Safety equipment/System
Table 3 - Pilot
Resultfor Fire Safety equipment/System
Code Mean
Normality Factor
Loadings
Variance
Explained
Cronbach
Alpha
Skewness Kurtosis
73.706 0.921
Adq_FSS_3.1 3.53 .031 -.300 .909 41.604 0.922
Adq_FSS_3.2 3.42 -.459 .586 .910
Adq_FSS_3.3 3.32 -.145 .035 .963
Adq_FSS_3.4 3.32 -.069 -.197 .895
Adq_FSS_3.5 3.32 -.382 .277 .804
Adq_FSS_3.6 3.40 .080 .048 .767
Adq_FSS_3.7 2.64 -.236 -1.126 **
12.175 0.928
Cond_FSS_4.1 3.66 -.140 -.042 .583
Cond_FSS_4.2 3.55 -.456 -.149 .688
Cond_FSS_4.3 3.53 -.710 .005 .744
Cond_FSS_4.4 3.40 -.436 -.454 .809
Cond_FSS_4.5 3.45 -.405 1.311 .831
Cond_FSS_4.6 3.49 -.535 1.382 .845
19.175 0.946
Imp_FSS_5.1 4.17 -.273 -1.033 -.804
Imp_FSS_5.2 4.06 -.092 -1.154 -.929
Imp_FSS_5.3 4.08 -.118 -1.071 -.856
Imp_FSS_5.4 4.06 -.512 -.438 -.922
Imp_FSS_5.5 4.17 -1.021 1.315 -.886
Imp_FSS_5.6 4.17 -1.021 1.315 -.875
Imp_FSS_5.7 3.79 -.409 -.016 -.613
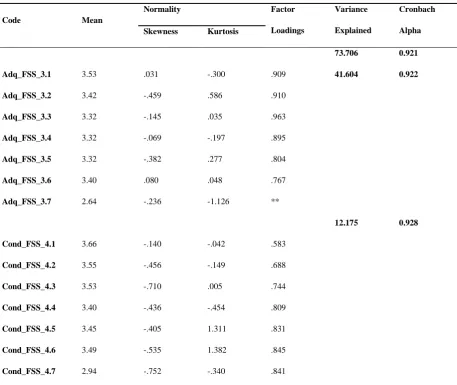
Table 3 shows the pilot result for the Fire Safety Equipment/System construct, which has sub-constructs of the adequacy of fire safety equipment, the condition of fire safety equipment and importance attached to fire safety equipment by the management; which produces mean values ranging from 2.64 to 3.4.17. The values of skewness and kurtosis were all the threshold of -/+2 (George & Mallery, 2010). All the variables under the construct have strong factor loadings which cumulatively explained 73.706 percent of the variance in which 41.04, 12.175 and 19.175 percent were accounted by the adequacy of fire safety equipment, the condition of fire safety equipment and importance attached to fire safety equipment respectively, which are considered satisfactory. The reliability of the construct was assessed using Cronbach’s alpha coefficient which produced an overall value of 0.921 with adequacy of fire safety equipment, condition of fire safety equipment and importance attached to fire safety equipment have values of 0.922, 0.928, and 0.946 respectively above the recommended minimum threshold of 0.7 (Tabachnick & Fidel, 2007; George & Mallery, 2010; Pallant, 2011).
This result indicated that the result obtained is adequate; the data is normally distributed and reliable. Hence, the instrument is considered valid for the main survey of the research.
4.4
Building Components Safety Design
Table 4 - Pilot Result of Building Components Safety Design
Code Mean
Normality Factor
Loadings
Variance
Explained
Cronbach
Alpha Skewness Kurtosis
71.617 0.965
Adq_PFSS_6.1 3.74 -.045 -.385 .904 54.652 0.932
Adq_PFSS_6.2 3.72 -.067 -.268 .868
Adq_PFSS_6.3 3.79 .332 -.968 .732
Adq_PFSS_6.4 3.72 -.067 -.268 .812
Adq_PFSS_6.5 3.79 -.150 -.327 .641
Adq_PFSS_6.6 3.62 -.080 -.416 .566
Adq_PFSS_6.7 3.60 -.341 .685 .402
Adq_PFSS_6.9 3.55 -.426 .417 .642
11.895 0.956
Cond_PFSS_7.1 3.68 .193 -.414 .564
Cond_PFSS_7.2 3.70 .134 -.370 .561
Cond_PFSS_7.3 3.66 .155 -.313 .582
Cond_PFSS_7.4 3.68 .092 -.265 .590
Cond_PFSS_7.5 3.62 -.091 -.076 .663
Cond_PFSS_7.6 3.53 -.105 -.114 .651
Cond_PFSS_7.7 3.53 -.686 1.603 .915
Cond_PFSS_7.8 3.58 -.880 1.913 .870
Cond_PFSS_7.9 3.47 -1.079 2.000 .638
5.070 0.954
Imp_PFSS_8.1 4.06 -.061 -.633 -.887
Imp_PFSS_8.2 4.04 -.473 1.043 -.911
Imp_PFSS_8.3 3.94 -.351 .559 -.830
Imp_PFSS_8.4 3.92 -.300 .331 -.885
Imp_PFSS_8.5 3.98 -.004 .252 -.812
Imp_PFSS_8.6 3.94 -.289 .174 -.706
Imp_PFSS_8.7 3.98 -.388 .634 -.703
Imp_PFSS_8.8 3.98 -.388 .634 -.674
Imp_PFSS_8.9 3.92 -.873 2.432 -.469
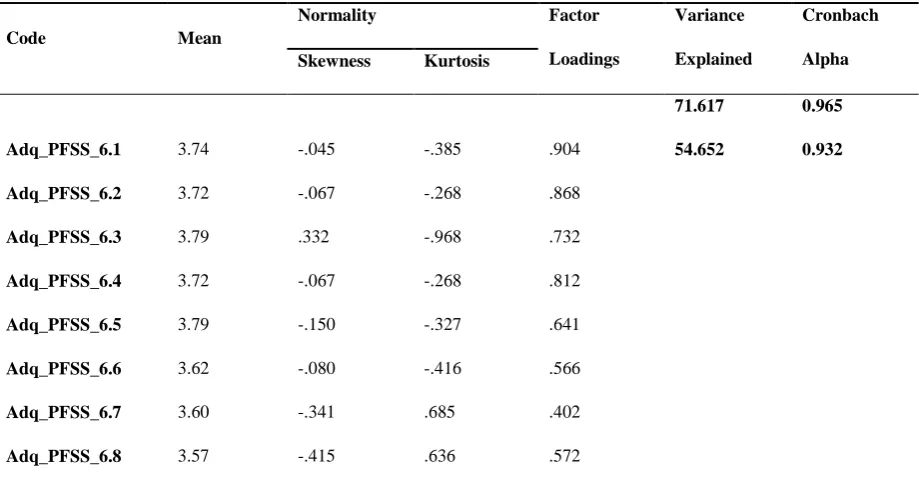
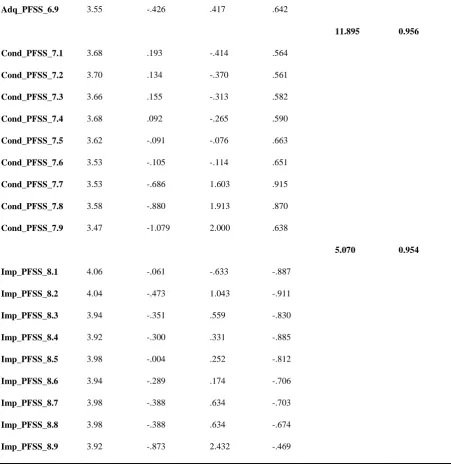
This result indicated that the result obtained is adequate; the data is normally distributed and reliable. Hence, the instrument is considered valid for the main survey of the research except for Imp_PFSS_8.9 which requires further amendment.
4.5
Effectiveness of Fire Safety Management
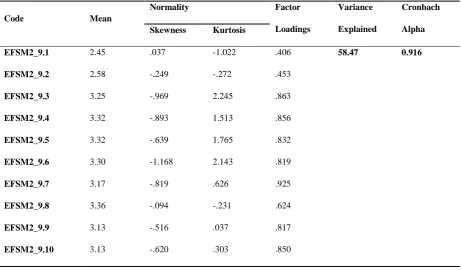
Table 5 - Pilot Result for Effectiveness of Fire Safety Management
Code Mean
Normality Factor
Loadings
Variance
Explained
Cronbach
Alpha Skewness Kurtosis
EFSM2_9.1 2.45 .037 -1.022 .406 58.47 0.916
EFSM2_9.2 2.58 -.249 -.272 .453
EFSM2_9.3 3.25 -.969 2.245 .863
EFSM2_9.4 3.32 -.893 1.513 .856
EFSM2_9.5 3.32 -.639 1.765 .832
EFSM2_9.6 3.30 -1.168 2.143 .819
EFSM2_9.7 3.17 -.819 .626 .925
EFSM2_9.8 3.36 -.094 -.231 .624
EFSM2_9.9 3.13 -.516 .037 .817
EFSM2_9.10 3.13 -.620 .303 .850
Table 5 shows the pilot result for the Effectiveness of Fire Safety Management constructs which produces mean values ranging from 2.45 to 3.36. The values of skewness and kurtosis were all the threshold of -/+2 (George & Mallery, 2010) except for EFSM2_9.3 and EFSM2_9.6 which have kurtosis value above 2. All the variables under the construct have strong factor loadings which cumulatively explained 58.47 percent of the variance which is considered satisfactory. The reliability of the construct was assessed using Cronbach’s alpha coefficient which produced a value of 0.916 above the recommended minimum threshold of 0.7 (Tabachnick & Fidel, 2007; George & Mallery, 2010; Pallant, 2011).
This result indicated that the result obtained is adequate; the data is normally distributed and reliable. Hence, the instrument is considered valid for the main survey of the research except for EFSM2_9.3 and EFSM2_9.6 which require further amendment.
4.6
Descriptive of the Aggregate Constructs of Stakeholder
Table 6 - Descriptive of the Aggregate Constructs of Stakeholder
Mean Std. Deviation Skewness Kurtosis
Statistic Statistic Statistic Std. Error Statistic Std. Error
MgtandMtnance 3.08 .577 -1.103 .327 3.329 .644
ConFSSE 3.43 .616 -.375 .327 -.524 .644
ImpFSSE 4.07 .721 -.326 .327 -.890 .644
AdFSCB 3.68 .636 .159 .327 -.005 .644
ConFSCB 3.61 .636 -.173 .327 .104 .644
ImpFSCB 3.97 .574 -.129 .327 .373 .644
EFSM 3.10 .626 -.873 .327 1.164 .644
Table 6 shows the descriptive of the constructs used in the FSM stakeholders’ questionnaire. The result produced mean values ranging from 3.08 to 4.07 with low dispersion as indicated by standard deviation values of less than 1. The values of skewness and kurtosis are all within the recommended threshold of -/+2 (George & Mallerry, 2010). The results show that all the constructs of the study are normally distributed.
5.
Conclusion
This paper discusses pilot testing of a questionnaire administered among the staff the facilities management, occupational safety health and environment (OSHE) and security departments from selected universities in Johor Malaysia of HEIs buildings. A total of 60 questionnaires were administered, and 55 were found useful from 53 returned. Four constructs were assessed for normality, reliability, factorability. All the results gave a favourable indication to proceed with the core survey with little adjustments.
Acknowledgements
The authors would like to thank Ministry of Education (MOE), Pejabat Pendaftar UTHM, Office of Research, Innovation, Commercialisation and Consultancy (ORICC), UTHM, for supporting this research under the Postgraduate Research Grant - U729 and the Faculty of Technology Management and Business, UTHM. Furthermore, our sincere appreciation goes to the Federal Polytechnic Bauchi, Nigeria for granting the corresponding author study leave to participate in this project.
References
Billington, M. J., Copping, A., & Ferguson, A. (2002). Means of escape from fire. John Wiley & Sons
British Standards Institution. BSISO/TR13387: Fire safety engineering, part1: Application of fire performance concept to design objectives. BSI, London, UK. (1999)
Chow, W. K. (2001). Review on Fire Safety Management and Application to Hong Kong, 3(1), 52–58.
Cohen, L., Manion, L., & Morrison, K. (2013). Research methods in education. London: Routledge
Collins, J., and Hussey, R. (2003). Business research. Basingstoke NH: Palgrave, Macmillan.
Creswell, J. W. (2013). Research design: Qualitative, quantitative and mixed method approaches. Sage.
Fink, A. (2006) How to Conduct Surveys: A Step-by-Step Guide. 3rd Edition, Sage Publications
George and Mallery (2010). SPSS for windows a step by step: A Simple Guide and Reference
Hassanain, M. A. (2009). Approaches to qualitative fire safety risk assessment in hotel facilities. Structural Survey, 27(4), 287–300.
Lodico, M. G. and Spaulding, D. T. and Voegtle, K. H. (2006) Methods in Educational Research: From Theory to Practice. JOSSEY-BASS A Wiley Imprint. The United States of America. First Edition.
Mathers, N., Fox, N., Hunn, A. (2007). Surveys and Questionnaires, The NIHR RDS for the East Midlands / Yorkshire & the Humber
Muijs, D. (2004).Doing Quantitative Research in Education with SPSS. SAGE Publications.
Pallant, J. (2011). SPSS Survival Manual 4th edition: A step by step guide to data analysis using SPSS: Allen and Unwin, Crows Nest, Australia.
Ramachandran, G. (1999). Fire safety management and risk assessment. Facilities, 17(9/10), 363–377.
Society of Fire Protection Engineers. (2005). SFPE Engineering Guide to Application of Risk Assessment in Fire Protection Design. SFPE, USA.
Tabachnick, B. G., & Fidell, L. S. (2007). Using multivariate statistics. Allyn & Bacon/Pearson Education.