Jo
SY
aFacu bPr cFa The consu mode the m desig evalu based only as a blend propi meth kaem Keyw desig Herb enha used sugg plant are b multi Aque have dama of thournal of C
STEMAT
SOLV
PHY
Siti
ulty of Agro-B
rocess System (RISE) aculty of Chem
trial-and-er uming and els with com main object gn of solv uation. The
d design an for the firs base case ds have be ionaldehyde hanol:acetic mpferol yield
words: Her gn, solvent b
bal plants h ancers and
to cure a b gests that a v
ts. Phytoche believed to iple disease eous extract been dem age caused he presence Chemical En Jour DO
TIC MET
VENT BL
YTOCHE
Nuurul Hud Based Industry ms Engineering ), Universiti Tmical Enginee
∗ Corre
rror solvent limited by mputer-assi tive of this vent blends methodolo nd experime
st stage. Th study that en identifie e (M:PP), m
acid (M:A d while M:P
rbal extract blend.
have been u fragrances broad range vast wealth emical cons have diver es, includin
ts of the Ma monstrated s by ultraviol e of flavon
ngineering
rnal Chemical En
Volume 4 ©Universit OI: https://doi.org/
THODOL
ENDS FO
EMICALS
da Mohammy, Universiti M Ke g Centre (PRO Teknologi Mal ering, Univers sponding auth Tel A t selection y effort an isted search
work is to s in extrac
gy can be s ental-verific e extraction follows all ed namely,
methanol:w AA). The M
PP gives the
tion, Kacip
1.0IN
used throug (Kumoro a e of acute an h of knowle
stituents in h rse therape g inflamma alaysian her significantly let (UV) irr noids (Norh
and Indus
ngineering and Ind (JCEIB) Open Access 4 pp. 60-89; Septe
ti Malaysia Pahan /10.15282/JCEIB
LOGY FO
OR EXTR
S WITH C
mad Azmina
Malaysia Kela elantan, Malay OSPECT), Re laysia, 81310 U siti Teknologi
Malaysia. hor: E-mail: hu
l.: +609-9477
ABSTRAC
method to d cost. The h is one way o present a cting herb
summarised cation stage n of kaempf l of the list
methanol:i water (M:W M:IB solven
e highest pr
p Fatimah,
NTRODUC
ghout huma and Hasan, nd chronic
dge could b herbs, such eutic abilitie atory condit
rb L. pumila y to protect adiation (Ch haiza et al
trial Biotec
dustrial Biotechn
ember 2018 ng Publisher B.V4.04.30/9/201
OR THE D
RACTION
COST EV
a*, Mohd Sh
antan Jeli Cam ysia.
search Institut UTM Johor B Malaysia, 81 uda.ma@umk 154 T obtain herb e combinat y to overco a computer-phytochem d into two m es. The resu
ferol from K ted tasks. F
isobutyralde W), methano
nt blend is rofit.
phytochem
CTION
an history a 2008). The conditions be gained th
as flavonoi es and are tions and ca a, commonl t human de hoi et al., 2 ., 2009). T
chnology V
ology
8/4.4
DESIGN O
N OF HE
VALUAT
hukri Mat N
mpus,Locked B
te of Sustaina Bahru, Johor, M
310 UTM Joh
k.edu.my
bal phytoch tion of pro ome these d -aided meth micals optim main stages, ult discussed Kacip Fatim Five optima ehyde (M:I l:ethyl acet able to ext
micals, extr
as sources ese plants h
(Diallo et a hrough exp ids, phenoli able to red ancer (Kari ly known as ermal fibro 2010), most The reporte
V4(2018)60-OF BINA
RBAL
TION
Norb,cBag 100, 1760
able Environm Malaysia. hor Bahru, Joh
hemicals is operty predi drawbacks. T
hodology fo mally with
, namely, m d in this pap mah herb is al binary so IB), methan tate (M:EA
tract the hi
raction, pr
of food, b have often al., 1999), w ploration of
Journal of Chemical Engineering and Industrial Biotechnology V4(2018)60-89
contributed to the high demand for herbal products. Thus, the identification of the most effective methods for extracting the phytochemicals from plants has become increasingly important (Abdullah et al., 2012).
Simple preparation methods for processing the plant herbs by boiling the entire plant or selected parts of the plant in water have been traditionally used by herbal medical practitioners since ancient times. As the herb is soaked in the solvents, the phytochemicals will diffuse out from the herbal plant cell to the solvent medium. The boiling method can be used but it is time consuming as there is no other driving force except heat that will increase the diffusion of these phytochemicals. Currently, there are many methods that have been applied to obtain these valuable phytochemicals, such as microwave-assisted extraction (MAE), sonication extraction, supercritical fluid extraction and so on, which have more than one driving force. For example, the MAE method will use heat and microwave power as an additional driving force to increase the diffusion rate of phytochemicals. In addition, these driving forces also will increase the amount of extracted phytochemicals. All of these modern techniques use solvent as a transfer medium of phytochemicals. Every solvent will attract different phytochemicals as the “like dissolve like” theory is implemented (Barton, 1990). This is the reason why different solvents will give different results (yields) in the extraction process.
Journal of Chemical Engineering and Industrial Biotechnology V4(2018)60-89
approach is the availability of chemical product models that could be applied with acceptable errors. In addition, a chemical product cannot be designed without considering the profitability of the product (Hill, 2009, Lee et al., 2014).
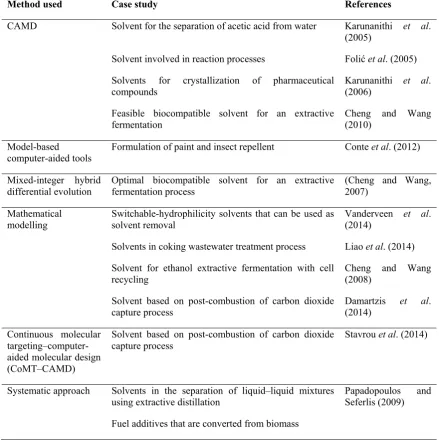
The computer-aided approach has been applied mostly in designing solvent for separation of solid–liquid and liquid–liquid systems. Previously, Karunanithi et al. (2005) designed an optimal solvent for the separation of acetic acid from water using liquid–liquid extraction (LLE) based on a computer-aided molecular/mixture design (CAMD), while Folić et al. (2005) also used the same method for the design of solvents involved in reaction processes. The CAMD framework has also been applied to design solvents for crystallization of pharmaceutical compounds by Karunanithi et al. (2006), whereas Cheng and Wang (2010) used this method to find a feasible biocompatible solvent for an extractive fermentation. Conte et al. (2012) designed a solvent blend for the formulation of paint and insect repellent using model-based computer-aided tools. In addition, Cheng and Wang (2007) applied mixed-integer hybrid differential evolution to design an optimal biocompatible solvent for an extractive fermentation process. Mathematical modelling was used by Vanderveen et al. (2014) to design switchable-hydrophilicity solvents. The designed solvents can be used as solvent removal that does not require the use of volatile compounds in distillation systems. The mathematical modelling also was used to design a solvent in a coking wastewater treatment process by Liao et al. (2014), while Cheng and Wang (2008) used mathematical modelling to design a solvent for ethanol extractive fermentation with cell recycling. In addition, the same cases can also be approached using different methods. As an example, Damartzis et al. (2014) applied mathematical modelling, while Stavrou et al. (2014) used continuous molecular targeting–computer-aided molecular design (CoMT–CAMD) to design an optimal solvent based on the post-combustion of carbon dioxide capture process. Papadopoulos and Seferlis (2009) proposed a systematic approach for designing solvents in the separation of liquid–liquid mixtures using extractive distillation based on solvents’ economic and behavioural characteristics. Table 1 summarizes the developed methods for various applications and case studies.In spite of using all of the previous methods, the validation of methodology used must be performed with selected case studies. This important step will determine whether the method is applicable or not with the current cases and the possibility of extending it to other cases.
Journal of Chemical Engineering and Industrial Biotechnology V4(2018)60-89
Table 1: Works on solvent design with their case studies
Method used Case study References
CAMD Solvent for the separation of acetic acid from water Karunanithi et al. (2005)
Solvent involved in reaction processes Folić et al. (2005)
Solvents for crystallization of pharmaceutical
compounds Karunanithi (2006) et al.
Feasible biocompatible solvent for an extractive
fermentation Cheng and Wang (2010)
Model-based
computer-aided tools Formulation of paint and insect repellent Conte et al. (2012)
Mixed-integer hybrid
differential evolution Optimal biocompatible solvent for an extractive fermentation process (Cheng and Wang, 2007)
Mathematical modelling
Switchable-hydrophilicity solvents that can be used as solvent removal
Vanderveen et al. (2014)
Solvents in coking wastewater treatment process Liao et al. (2014)
Solvent for ethanol extractive fermentation with cell
recycling Cheng and Wang (2008)
Solvent based on post-combustion of carbon dioxide
capture process Damartzis (2014) et al.
Continuous molecular targeting–computer-aided molecular design (CoMT–CAMD)
Solvent based on post-combustion of carbon dioxide
capture process Stavrou et al. (2014)
Systematic approach Solvents in the separation of liquid–liquid mixtures using extractive distillation
Fuel additives that are converted from biomass
Papadopoulos and Seferlis (2009)
2.0METHODOLOGY
This systematic methodology employs the reverse design approach (Gani, 2004), where the targets of the design problem are defined and the solvent blends that match the targets are identified. This reverse design approach has been chosen because it is ideally suited to handle “define target–match target” problems. In addition, the approach is able to manage the complexity of the design problem efficiently and to reduce the search space (Karunanithi et al., 2005). Normally, a set of solvents is systematically generated and screened. Note that, in this solvent design methodology, only binary mixtures are considered, but it can be easily extended to multicomponent mixtures.
2.1 Systematic methodology of solvent design for phytochemical extraction
Jo
Fi
In th defin targe mode
ournal of C
igure 1: Sys
he model-ba nition, wher eted propert el identifica
Chemical En
stematic me
ased design re this task ties and obt ation, where
ngineering
ethodology
stage, it is would iden tain the targ e the model
and Indus
for solvent from herbs
separated in ntify the us geted prope s to be used
trial Biotec
design in e s
nto four ma ser needs, tr erty constra d to estimat
chnology V
xtracting ph
ain tasks. Ta ranslate the aints. Task 2
e the target
V4(2018)60-hytochemic
ask 1 is pro e user needs 2 is the pro ed propertie
-89
als
oblem s into operty
Journal of Chemical Engineering and Industrial Biotechnology V4(2018)60-89
retrieved from the property models library (see Section 2.1.2). Task 3 is specifically for solvent design, whereas Tasks 1 and 2 are used as inputs in the solvent design algorithm. The objective of this task is to find solvent blend candidates that satisfy the solvent target properties at low cost. This algorithm must be tested with the case study to make sure that the algorithm is suitable with the current application. Task 4 is to evaluate the performance of the designed solvents. In this task, the optimal amounts of the phytochemicals that can be extracted by the designed solvents are estimated using an appropriate prediction model. Finally, the results obtained from the model-based design stage need to be verified experimentally at the experimental verification stage. The validation task is divided into two steps. The first step is to validate the selected solvent properties and it is then followed by the experiment on herbal extraction using the designed solvents. The second step is to validate the actual amount of the phytochemicals that can be extracted using the designated solvents. Both experimental results are then used to calculate the error between the predicted and experimental values. If the experimental validation for the first part gives a huge error, the task amendment must be done starting from Task 2 (model identification). Lack of success for the first part means that either a high error value is obtained (comparison between the prediction and experimental values for every selected property) or the property values are outside the set property constraints.
If the experimental validation for the second part also gives a huge error, the task amendment must be done starting from Task 1 (problem definition). The problem might originate because of unsuitable property selections, property constraints or property models with the current tested case study that makes the selection of solvent blends inappropriate.
2.1.1 Task 1: Problem definition
This task is divided into three sub-tasks, namely, identify needs, translate needs into target properties and define constraints of the target properties. The output of this task is a list of properties considered in the design with their target boundaries or constraints.
Journal of Chemical Engineering and Industrial Biotechnology V4(2018)60-89
methodology only considers all the factors that can be measured by properties. The solvents used for herb phytochemicals extraction also must have specific criteria, such as they must be miscible with each other in order to prevent the formation of two layers of solvents, which will cause the extraction to become inefficient. In addition, the solvent must also be easily separated from the phytochemicals to produce high purity phytochemicals and enable the solvent to be reused for the same purpose.
Task 1.2 Translate needs into target properties. In this task, all of the needs that have been identified in Task 1.1 must be translated into target properties in order to evaluate them. This task requires knowledge for translation of needs into target properties. This knowledge is gathered and collected from the experts in the particular product or process as well as from patents and the literature (Lee et al., 2014). They are put into a database called the knowledge base. The needed knowledge for this task is shown in Table 2.
Table 2: Needs, performance criteria and target properties employed in this study
Needs Performance Criteria Target Properties
Solvents must have almost the same value of polar property in order to make sure that phytochemicals can diffuse out from the herbal cell to the solvent medium.
Polarity Log p
Solvent that would be designed must not evaporate easily to make sure that in the extraction process, the solvent does not dry.
Solvent that would be designed must not be too difficult to evaporate as it will be removed after the extraction process to get the crude extract.
Boiling point Tb
Safety of the solvent to the users/ researchers must be considered.
Toxicity LC50
Compatibility of the solvent to the phytochemicals must be considered so that the solvent will be easy to handle and effectively extract the target phytochemicals.
Solubility δ
The solvent components must be miscible with each other to make sure that there is no undesired layer (immiscibility of solvent) in the extraction.
Miscibility/Stability ∆Gmix
Solvent blend must not be too sticky as it will be removed from the mixture of solvent and herbal crude extract.
Viscosity μ
The solvent that will be designed must not only be considered in term of effectiveness but also economics.
Journal of Chemical Engineering and Industrial Biotechnology V4(2018)60-89
Table 2: (continued)
Needs Performance Criteria Target Properties
As existing solvent is sold by price per weight, so the density of the blend solvent is also needed.
Density ρ
Note that not all product needs can be translated into physicochemical properties. As an example, even though the herbs’ planting location would influence the extraction yield, it could not be measured by any property. The knowledge base about the principle of herbal extraction must be used in this task. Then, all of the needs are translated into the target properties. These target properties could be classified into three terms, namely, properties that determine: 1) the main function of solvent (properties related to the choice of phytochemicals); 2) the solvent performance (physicochemical properties of the solvent); and 3) the solvent phase stability. Table 2 summarizes the needs, performance criteria and target properties employed in this study.
Task 1.3 Define constraints on the target properties. After the target properties in Task 1.2 are obtained, the constraints for all target properties must be specified. The constraint values can be obtained from the existing solvents used in the extraction process. These values are used as a benchmark in designing a base case of solvent. They could be changed to allow improvement for a better solvent design. Some of the constraint values are obtained from legislation or local regulations. For example, the vapour pressure of solvent blends must be less than a certain limit set by legislation to ensure that the solvent does not easily release into the environment (Klein et al., 1992). All of the gathered target constraints are stored in the knowledge base. This limit is important in order to make sure that all designed blend solvents are within this set range.
2.1.2 Task 2: Property model identification
In this study, the physicochemical properties of interest are mixture properties because the solvent to be designed is in mixtures/blends. This requires mixture property models to estimate the mixture properties. The property models to estimate pure properties may also be needed if the pure properties are not available. Note that, whenever the experimental data are available, these data are directly employed in the calculations. The models to estimate both pure and mixture properties were collected from the literature and stored in a property models library, as listed in Tables 3 and 4. This library is created to store the related models that might be applicable for designing solvent blends. For pure component properties, it has been classified into primary and secondary properties. Primary properties could be directly determined using the group contribution (GC) method and only depend on molecular structure. Secondary properties could not be determined directly using the GC method, but it uses some of the primary properties as specified variables. As an example, the density calculation is a function of critical pressure, Pc, and temperature, Tc, in which both Pc and Tc could be determined using the GC method.
Journal of Chemical Engineering and Industrial Biotechnology V4(2018)60-89
would be used to predict the target property values where it is easier and faster than performing experiments on the solvents.
2.1.3 Task 3: Design solvent blend
Task 3 focuses on searching the solvent candidates that satisfy all of the property constraints set in Task 1.3. The objective of this task is to generate and screen all solvent blend candidates. In this task, the main part is the solvent design algorithm (Task 3.2), where the solvent blend candidates are generated and screened through five levels. Before performing the algorithm, the input data must be chosen. This algorithm gives a result as a list of all potential solvent blend candidates that could be used in herbal extraction with the cost of 1 ml of solvent blend. Then, all of the feasible solvent blends are ranked in ascending order based on solvent cost obtained in Task 3.2. This task was performed using MATLAB software.
Task 3.1 Choose input data. Results from Task 1 (Task 1.1: identify needs, Task 1.2: translate needs into target properties and Task 1.3: define constraints on the target properties) and Task 2 (Task 2.1: retrieve property models from the library) are used as inputs for this algorithm. In addition, selected phytochemical properties, the list of solvents with their associated properties and temperature that would be considered in the extraction process are also used as input data. Two types of input data must be listed, namely, solvent and phytochemical data. Both data must have all pure component property values for each solvent and phytochemical that affect the extraction of herb phytochemicals.
Task 3.2 Run solvent design algorithm. The solvent blend design algorithm employs a decomposition-based solution strategy where the number of feasible mixtures is systematically decreased in subsequent levels (Karunanithi et al., 2005, Conte et al., 2011, Yunus et al., 2014). Figure 2 shows the solvent design algorithm that has been applied in this study. The input information for the algorithm are solvent and phytochemical data (necessary pure compound properties are stored), both linear and non-linear property models, constraints on target properties and designed temperature. As shown in Figure 2, the algorithm has five levels and they are ranked according to the hierarchy of calculations with increasing complexity. Level 1 is for screening pure component target properties, while Levels 2 and 3 solve the linear and non-linear target property constraints, respectively. Level 4 is to analyse the stability of mixture solvents and Level 5 is to calculate the cost of use for all potential solvent candidates. Results for every level would be continued to the next level, where the result for the previous level would be the input data for the next level. As an example, the result for Level 1 is a binary mixture that satisfies Step 1-1 (S1.1). Then this result would be the input data for Level 2.
Jo solve 3. Th such (i) comp prop Step prop their comp targe boun deter mixtu 3 sho
ournal of C
ent are solv here will be
as solvent 2
Level 1 ponent cons
erties that c
1.1: Prelim erties, value
set target v parison of s et property nd and ζUBk
rmined by u ure is in the ows the con
Chemical En
ent 1 with s e no repetiti 2 with solve
F
: Pure com straints. Pur could be rela
minary scree es for ζk for values boun
solvent prop of solvent
k is the up
using the tar e target regi ndition in wh
ngineering
solvent 2, so ion of the s ent 1, solve
Figure 2: S
mponent con re componen ated to the s
ening based r each solve ndaries, ζLB
perty value 1, ζS2k is th
pper bound rget phytoch ion, the mix hich the sol
and Indus
olvent 1 wi ame solven ent 3 with so
olvent desig
nstraints. L nt here mea solvent prop
on pure co ent compon
and ζUB for
s in the bin he target pr of the tar hemical pro xture would lvent mixtur
trial Biotec
th solvent 3 nt combinati olvent 1 and
gn algorithm
Level 1 wil ans all of th perties.
omponent pr nent in the m r each prope nary mixture
roperty of s rget propert operty value d be continu re satisfies t
chnology V
3 and solven ion in the r d solvent 3 w
m
ll only scre e considere
roperties. In mixture, are erty, k. Figu e, where ζS
solvent 2, ζ ty, k. The e. If one of ued to the n the set cond
V4(2018)60-nt 2 with so reverse direc
with solven
een on the ed phytochem
n this step, t e compared ure 3 illustra
S1k represent
ζLBk is the l
target regi the solvent next level. F
Jo
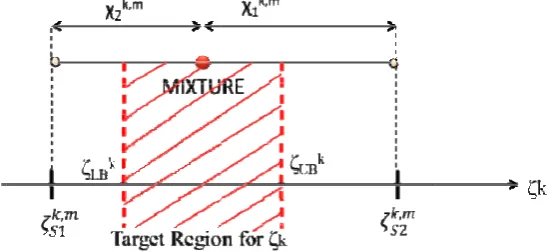
Rule the lo (ζS1k>
(i) level case targe In th is the comp Step step, mixtu As il the t regio prop prop targe
ournal of C
1: If the p ower bound >ζUBk and ζ
Level 2: l. Linear con
study, linea et property.
his equation e pure solve pound i, NS
2.1: Calcu the comp ure are calc
llustrated in target regio on limited b
erty of solv erty k for t et.
Chemical En
property val d values (ζS
ζS2k>ζUBk), th
: Linear con nstraints are ar model m
For a binary
, subscripts ent property S is number
ulation of th osition bou culated usin
n Figure 4, t n, as show by the upp vent 1 (S1)
the solvent
F
ngineering
Figure 3: P
lues of ever
1k<ζLBk and
hat solvent
nstraints. B e related to eans follow y mixture, t
ζ ,
1 and 2 ind y k of comp
of solvents
he composi undaries for
g Equation
x ,
the pure pro wn in the sh per, ζUBk, an
is less than t mixture m
Figure 4: M
and Indus
Pure propert
ry solvent in d ζS2k<ζLBk)
mixture wo
Binary mixtu the propert wing the line
the generic
∑NS x
dicate solve pound i in th s in the mixt
ition bound r each targ
(2). , is
, S, S, S,
operties of s haded area. nd lower, ζ n that pure must lie in
Mixture solve
trial Biotec
ty boundary
n a mixture or greater t ould be rejec
ure screenin ties describe ear mixing r form of the
ζ , x .
ents 1 and 2 he mixture m ture.
daries for ea get property a specific ta
solvents 1 a The dashe ζLBk, bound
property o the target r
ent boundar
chnology V
y
e are both e than the upp
cted.
ng of solve ed by a line rule to com e linear mod
ζ , 1
2 in the bina m, xi is the
ach target p y of solven arget value
and 2, ζS1k,m
d lines repr ds. In this of solvent 2 region to m
ry
V4(2018)60-either lower per bound v
ents starts a ear model. In mpute the mi
del is:
x . ζ ,
ary mixture mole fracti
property. In nt in the b
for property
and ζS2k,m a
resent the t figure, the 2 (S2). Thu match the d
-89 r than values at this n this ixture (1)
e, ζik,m
Jo Then calcu Step of th comp comp the r show As sh the c the u value Math minim (6). Rule overl cond comp uppe is wi
ournal of C
n, the comp ulated using
2.2: Identif e overall co paring the c position ran region wher wn in Figure
F
hown in thi composition upper bound es of x ,LB, a
hematically, mum and m
2: The sol lap each ot dition, x ,L, position for er bound, x
ithin the ra
Chemical En
position ran g Equations
fication of t omposition composition nges for pro re both com e 5.
Figure 5: O
is figure, the n range for p d of the com and x ,UB, fo
, the overal maximum va
lvent mixtu ther are reje
B x ,UB, ,
r the lower ,UB. As an ange 0.5–0.7
ngineering
nge of solve (3) and (4)
the overall c range ( ,, n range of al
perties 1 an mposition r
Overall comp
e lower bou property 2, mposition ra or each prop
ll compositi alue of x ,LB,
res with the ected. Math
is rejecte bound, x ,L example, c 7 while the
and Indus
ent 1, (x ,LB, :
x ,UB,
x ,LB, U
composition and ,, ) ll target pro nd 2 are ana anges overl
position ran
und compos while the up ange for pro perty k are c
x ,LB ma
x ,UB
ion calculat B and x ,UB,
e compositi hematically, ed. This c LB is highe consider tha e compositi
trial Biotec
Band x ,UB, )
LB S S S UB S
S S
n range for for each m operties. As alysed, the o
lap. An illu
nge for a sol
sition, x ,LB, , pper bound operty 1. Th calculated u
ax x ,LB,
min x ,UB,
ions follow are calcula
ion range o , any binary condition o er than the o at the compo ion range f
chnology V
for a binar
each mixtur mixture could an example overall com ustration of lvent mixtur
, will be the d compositio he minimum using Equati B w Equations
ated using E
of each prop y mixture t occurs wh overall com osition rang for property V4(2018)60-ry mixture, re. Identific d be achiev e, if two diff mposition ran f this examp
re
e lower bou on, x ,UB, , w m and maxi ions (5) and
(3) and (4) Equations (5
perty that d that satisfie hen the ov mposition fo
ge for prope y 2 is withi
Journal of Chemical Engineering and Industrial Biotechnology V4(2018)60-89
range 0.3–0.4. According to Equations (5) and (6), x ,LB is 0.5 while x ,UB is 0.4, which shows that this mixture fulfils the above mentioned condition. Thus, this type of mixture is rejected.
(ii) Level 3: Non-linear constraints. At the end of Level 2, binary mixture candidates (solvent 1, S1 mix with solvent 2, S2) with their composition boundaries have been determined. At this level, non-linear constraints are applied for further screening of the solvent mixtures.
Step 3.1: Solve non-linear models with xi as input. For this step, non-linear mixture
properties, , , for the remaining binary mixtures are considered. These non-linear models are solved by using the overall composition range ( , < < , ) as input. As a result, new composition ranges that satisfy the non-linear constraints are obtained.
Rule 3: All mixtures for which the calculated property values do not match the non-linear property constraints are rejected. Then the remaining solvent mixtures will be evaluated in Level 4.
(iii) Level 4: Phase stability constraints. At the fourth level, the stability analysis is performed, where the input data used are UNIFAC-LLE group representations (Magnussen et al., 1981) of solvent mixture and operating temperature used in the herbal extraction process.
Step 4.1: Solve the stability routine for each mixture. The stability for each solvent mixture obtained after Level 3 is analysed using a developed stability test. The stability analysis provides the information whether the binary mixtures are stable or not. Stable means that the binary mixtures will not separate (miscible), while unstable means the binary mixtures will separate (either partially miscible or immiscible) at the tested temperature. The stability test is based on the trend of the Gibbs energy and its second derivatives as a function of composition. The Gibbs energy of mixing,∆ is calculated as follows:
∆G RT
GE
RT ∑ x . ln x
NC (7)
where GE is the excess Gibbs energy of mixing, which is calculated from:
GE
RT ∑ x . ln γ
NC (8)
Rule 4: Mixtures showing phase separation at xi are rejected. According to Smith et al.
(2005), stable mixtures must satisfy these two rules:
• ∆GRT < 0
• ∂ ∆GRT / ∂x > 0
Journal of Chemical Engineering and Industrial Biotechnology V4(2018)60-89
(iv) Level 5: Cost calculation. The goal of this algorithm is to obtain the lowest cost of solvent mixtures that satisfy all listed constraints. It is in order to make sure that the solvent properties are within the property constraints as well as no solvent mixture separations occur at the set temperature. At this level, the inputs are solvent mixtures composition as well as pure solvent costs, which are obtained from (ICIS, 2014).
Step 5.1: Identification of the mixture that minimizes the cost. Cost calculations for all stable binary solvent mixtures are performed using linear mixing rules (Equation 1). The composition of solvents resulting from Step 2.2 will be used and substituted in this equation.
2.1.4 Task 4: Performance evaluation
The objective of this task is to evaluate the performance of the solvent blend candidates obtained from the previous step. The performance can be evaluated in terms of extraction capability or profit, or both. Even though a solvent blend may satisfy all of the target properties, this does not guarantee that it is capable of extracting a high yield of phytochemicals. This is because many factors affect the extraction process. It not only depends on the solvents but also the process conditions, size of raw materials (herbs) and mixing process. Thus, a performance evaluation algorithm is developed to solve this problem. The goal of Task 4 is to find the binary solvent mixtures that are able to extract the maximum amount of target herbal phytochemicals as well as return a high profit when the phytochemicals are sold.
Task 4.1 Run performance evaluation algorithm. Figure 6 shows the performance evaluation algorithm used in this study.
The input for this algorithm is the result from the solvent design algorithm (solvent blends with specified composition) together with the extraction temperature and solvent to herb ratio (from the knowledge base). Then, the composition of targeted phytochemicals is computed using a solid–liquid equilibrium, SLE, model (Performance 1). The output of Performance 1 is a list of solvent blends and the extraction yield. Then, the user can choose to continue to the next performance (Performance 2) or terminate the performance evaluation with Performance 1 only. Performance 2 calculates the profit if the phytochemicals are sold by considering the raw material and solvent costs only (the utility cost is not included). The output of this performance is a list of solvent, extraction yield and profit.
Step P1: Identification of mixtures that can extract a target phytochemical. The phytochemicals composition, x, is calculated using the SLE model (Smith et al., 2005) as follows:
x γ exp∆HRT T TT (9)
wherex is the solubility of the phytochemicals expressed as mole fraction, γ is the phytochemical’s activity coefficient in the solution, T is the phytochemical’s melting temperature, ∆H is the phytochemical’s heat of fusion and T is the extraction operating temperature.
Jo
El-Sh (vol/ mean form subst phyto
wher wt/w
Rule than
ournal of C
herbiny et /vol), the he ns the mate med during tances (OC ochemical’s
reY is the wt, and MRM
5: Solvent 5 wt/wt) ar
Chemical En
Figur
al. (2003) erb-to-extra erial consis
the extrac M, 2011). s yield (in g
predicted e M is weight o t mixtures t re rejected.
ngineering
re 6: Perfor
mentioned act ratio, r, sting only ction proce
The herb-to g) is comput
extraction y of herbal raw
that give lo
and Indus
rmance eval
that for d is 12:1 for of compon ess, exclud o-extract ra ted as show
Y x
yield in g, w material i
ow target ph
trial Biotec
luation algo
dried herb e a 100% na nents presen ding any e atio, r, is ta wn in Equati x r M
x is the pr in g.
hytochemic
chnology V
orithm
extracts wi ative extrac nt in the o excipients aken into ac
on (10), MRM
redicted ex
als compos
V4(2018)60-ith 80% eth ct. Native ex original pla
or other a ccount whil
xtraction yie
sition range
-89
hanol xtract ant or
added le the
(10)
eld in
Journal of Chemical Engineering and Industrial Biotechnology V4(2018)60-89
Step P2: Identification of mixtures that are profitable
The aim of Performance 2 is to evaluate the profit for solvent blends that can extract a high amount of phytochemical. The profit calculation is shown in Equation (11),
P C CRW (11)
CRW C CRH (12)
where P is profit (RM/g), C is the phytochemical price (RM/g), CRW is the raw material cost (RM/g), C is the solvent cost (RM/g), v is the volume of solvent (cm3),
ρ is solvent density (g/cm3) and CRH is the raw herb cost (RM/g).
Rule 6: Solvent blends that give a negative profit if the phytochemicals are sold are rejected.
Task 4.2 Rank solvent blend candidates. The last task in the model-based stage is to rank the solvent blends (result from solvent design and performance evaluation algorithms) according to the selection criteria: solvent cost, profit and predicted phytochemicals composition.
2.1.5 Task 5: Experimental validation
This task is under the experimental verification stage where it is divided into two tasks, namely, herbal extraction and property check. For herbal extraction, the extraction process is performed using the selected solvent blends resulting from the performance evaluation (Task 4).
Task 5.1: Property check.Task 5.1 is needed to verify the model used with the experimental result for the selected property in this study. In Task 2, property model identification is used to search the model based on the targeted property set in Task 1. The calculation of the property is only based on the model, which might have some error and need experimental validation. The percentage error formula is used to determine the precision of the prediction model. Equation (13) shows the calculation of percentage error.
% Error E P V VP V (13)
A percentage error value of less than 10% will be accepted, while the rest will be rejected. The amendment must be applied to the rejected value where the new model identification for the unsatisfied property is conducted (Task 2).
Task 5.2: Herbal extraction. In Task 4, performance evaluation is performed, where this task only uses the SLE model to calculate the composition of herbal phytochemicals. Thus, this task is very important to compare the model used with real experimental work.
2.2 Work-flow diagram for the solvent design in herbal extraction
Jo algor rejec that binar Leve accor solve when prov selec are u herba Tabl phyto Task effec could consi Task desig prop valid
ournal of C
rithm, every cted or conti
have been ry mixture s el 5. Next i
rding to as ent blend th n the phyto
e that the cted propert used. Figure
al extraction
Figure 7
e 3 provide ochemicals
k 1 uses a k ct of solvent d be relate idered in th k 2 uses a p gn algorithm
erty model date the mod
Chemical En
y input solv inued onto t set in the solvents at L
s the optim scending co hat can extr chemicals a selected so ties in this e 7 shows n.
7: Work-flo
es a list of methodolo
knowledge b t properties ed to the he extractio property mo
m, Task 4 ls library. T del-based ca
ngineering
vent in eac the next lev
problem d Level 4 wou mal search, w
ost. Then, p ract a high are sold. La olvent blen
study are a the simplif
ow diagram
the method gy.
base (any in s on the extr
solvent be on process, h
odel library utilizes a Task 5 app alculation.
and Indus
ch level has vel. These r definition, T
uld be cons which invo performance
level of ph astly, the ex nds can be lso tested to fied work-fl
m for the solv
ds and tools
nformation raction proc ehaviour, w how to rela y, Task 3 em
performanc plies experi
trial Biotec
s two possib esults are in Task 1.3. H idered in th lves the ran e evaluatio hytochemic xperimental used to ex o ensure th low diagram
vent design
s used in th
about herb cess, the ph what the ex
ate these be mploys a so ce evaluatio imental pro chnology V ble results. nfluenced b However, on he solvent co nking of so
n is perfor als as well l validation xtract phyto hat suitable
m for the s
in herbal ex
he solvent d
bal extractio hytochemica xperimental ehaviours to olvent datab on algorithm ocedures an
V4(2018)60-They are e by the constr nly all acc ost calculati olvent candi rmed to fin as give a p n is perform
ochemicals. property m olvent desi
xtraction
design for h
on processe al behaviou lly based o the proper
Journal of Chemical Engineering and Industrial Biotechnology V4(2018)60-89
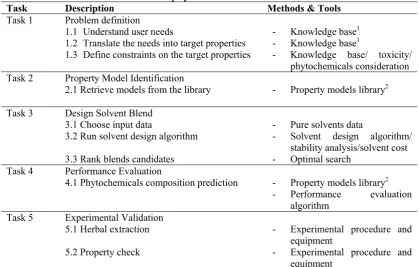
Table 3: Methods and tools used in the solvent design for extraction of herbal phytochemicals
Task Description Methods & Tools
Task 1 Problem definition 1.1 Understand user needs
1.2 Translate the needs into target properties 1.3 Define constraints on the target properties
- Knowledge base1 - Knowledge base1
- Knowledge base/ toxicity/ phytochemicals consideration Task 2 Property Model Identification
2.1 Retrieve models from the library - Property models library2
Task 3 Design Solvent Blend 3.1 Choose input data
3.2 Run solvent design algorithm
3.3 Rank blends candidates
- Pure solvents data
- Solvent design algorithm/ stability analysis/solvent cost - Optimal search
Task 4 Performance Evaluation
4.1 Phytochemicals composition prediction - Property models library2
- Performance evaluation algorithm
Task 5 Experimental Validation 5.1 Herbal extraction
5.2 Property check
- Experimental procedure and equipment
- Experimental procedure and equipment
1 Information from patents and literature.
2 Library containing property models for pure components and mixtures, and model for phytochemical composition calculation.
3.0BASE CASE STUDY
The methodology and its implementation are highlighted through a base case study: design of a solvent blend for extracting kaempferol from Kacip Fatimah herb. However, the results that are obtained are only for the model-based design stage.
3.1 Case study: Solvent blends for extracting kaempferol from kacip fatimah herb
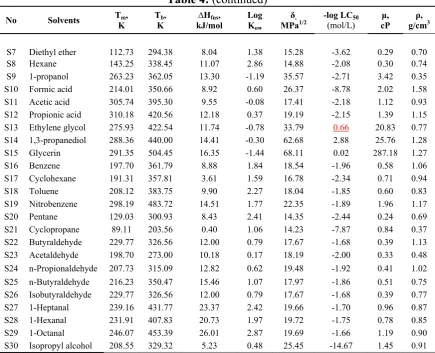
The aim of this case study is to design a solvent blend that can maximise the extraction yield of kaempferol, which is one of the main phytochemicals in Kacip Fatimah herb. The solvent blend formulation is considered for non-consumable phytochemicals product used for the conventional extraction and the temperature considered is 90 °C. The result is then compared with the experimental data obtained from Karimi et al. (2011). Thirty solvents consisting of alcohols, hydrocarbons, ethers and esters were used as solvent input data, as shown in Table 4.
Table 4: Solvents list with their respective properties
No Solvents Tm, K Tb, K kJ/mol ∆Hfus, Log Kow δ,
Journal of Chemical Engineering and Industrial Biotechnology V4(2018)60-89
Table 4: (continued) No Solvents Tm,
K
Tb, K
∆Hfus, kJ/mol
Log Kow
δ,
MPa1/2 -log LC(mol/L) 50 cP μ, g/cmρ, 3
S7 Diethyl ether 112.73 294.38 8.04 1.38 15.28 -3.62 0.29 0.70 S8 Hexane 143.25 338.45 11.07 2.86 14.88 -2.08 0.30 0.74 S9 1-propanol 263.23 362.05 13.30 -1.19 35.57 -2.71 3.42 0.35 S10 Formic acid 214.01 350.66 8.92 0.60 26.37 -8.78 2.02 1.58 S11 Acetic acid 305.74 395.30 9.55 -0.08 17.41 -2.18 1.12 0.93 S12 Propionic acid 310.18 420.56 12.18 0.37 19.19 -2.15 1.39 1.15 S13 Ethylene glycol 275.93 422.54 11.74 -0.78 33.79 0.66 20.83 0.77 S14 1,3-propanediol 288.36 440.00 14.41 -0.30 62.68 2.88 25.76 1.28 S15 Glycerin 291.35 504.45 16.35 -1.44 68.11 0.02 287.18 1.27 S16 Benzene 197.70 361.79 8.88 1.84 18.54 -1.96 0.58 1.06 S17 Cyclohexane 191.31 357.81 3.61 1.59 16.78 -2.34 0.71 0.94 S18 Toluene 208.12 383.75 9.90 2.27 18.04 -1.85 0.60 0.83 S19 Nitrobenzene 298.19 483.72 14.51 1.77 22.35 -1.89 1.96 1.17 S20 Pentane 129.03 300.93 8.43 2.41 14.35 -2.44 0.24 0.69 S21 Cyclopropane 89.11 203.56 0.40 1.06 14.23 -7.87 0.84 0.37 S22 Butyraldehyde 229.77 326.56 12.00 0.79 17.67 -1.68 0.39 1.13 S23 Acetaldehyde 198.70 273.00 10.18 0.17 18.19 -2.00 0.33 0.48 S24 n-Propionaldehyde 207.73 315.09 12.82 0.62 19.48 -1.92 0.41 1.02 S25 n-Butyraldehyde 216.23 350.47 15.46 1.07 17.97 -1.86 0.51 0.75 S26 Isobutyraldehyde 229.77 326.56 12.00 0.79 17.67 -1.68 0.39 0.77 S27 1-Heptanal 239.16 431.77 23.37 2.42 19.66 -1.70 0.96 0.87 S28 1-Hexanal 231.91 407.83 20.73 1.97 19.72 -1.75 0.78 0.85 S29 1-Octanal 246.07 453.39 26.01 2.87 19.69 -1.66 1.19 0.90 S30 Isopropyl alcohol 208.55 329.32 5.23 0.48 25.45 -14.67 1.45 0.91
The properties values are taken from the experimental results. However, if there is no experimental result available, the models in Table 5 were used to predict the desired properties. Meanwhile, the targeted phytochemical in Kacip Fatimah (kaempferol) is used as the phytochemical input data. In this paper, the case study is solved using the systematic methodology illustrated in Figure 1.
Table 5: List of pure property models used in this work
Property of pure solvent Model Reference
Partition coefficient, Log Kow Marrero and Gani GC method Marrero and Gani (2002) Boiling point, Tb Marrero and Gani GC method Marrero and Gani (2001) Solubility parameter, δ Marrero and Gani GC method Marrero and Gani (2001)
Mohammad Azmin et al. (2014)
Toxicity, LC50 GC method Gao et al. (1992)
Viscosity, μ GC method Cao et al. (1993)
Density, ρ Modified Rackett equation Spencer and Danner (1972) *GC method is group contribution method
3.1.1 Task 1: Problem definition
Journal of Chemical Engineering and Industrial Biotechnology V4(2018)60-89
the pure crude extract can be obtained), have low toxicity, must be miscible with each other and with the phytochemical, stable, low price and good solvent appearance.
Task 1.2 Translate needs into target properties. According to the knowledge base, the solvent needs are translated to the target properties. Therefore, the target properties affecting the performance criteria are listed in Table 6.
Table 6: Translation of the performance criteria into target properties
Solvents Mixture Performance Criteria Target Properties
Effectively extract the selected phytochemicals log p, δ
Can be removed from phytochemicals crude extract (after extraction) μ, Tb
Low toxicity LC50
Miscible with each other and stable δ, ∆Gmix
Low price ρ, C
Good solvent appearance μ
Task 1.3 Define constraints on the target properties. The target value for all of the listed properties refers to the common existing solvent used in the herbal extraction process, properties of the target phytochemical and literature study. The target values for each property are set as listed in Table 7.
Table 7: Target property constraints
3.1.2 Task 2: Property model identification
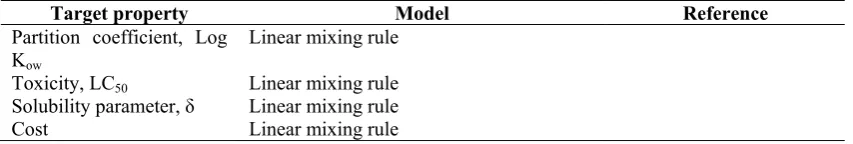
Task 2.1: Retrieve models from the library. The target properties, partition coefficient (log Kow), toxicity parameter (LC50), solubility parameter (δ), viscosity (μ), density (ρ)
and cost (C) are estimated using linear mixing rules (Equation 1) while the others are predicted by using non-linear models, as listed in the property models library (Table 8).
Table 8: List of mixture property models used in this work
Target property Model Reference
Partition coefficient, Log
Kow Linear mixing rule
Toxicity, LC50 Linear mixing rule Solubility parameter, δ Linear mixing rule
Cost Linear mixing rule
Target property value
Property Solvent constraints Phytochemical constraints
Partition coefficient Log Kow(follow target phytochemicals) -0.3 ≤Log Kow≤ 4.44 Boiling point Tb ≤ 728.4 K -
Toxicity parameter -2.5 ≤-log LC50≤ 2.5 -
Stability ∆Gmix -
Viscosity 0.20 cP ≤ μ ≤1.24cP - Density 1.0g/cm3 ≤ρ≤ 1.5g/cm3 -
Price C -
Journal of Chemical Engineering and Industrial Biotechnology V4(2018)60-89
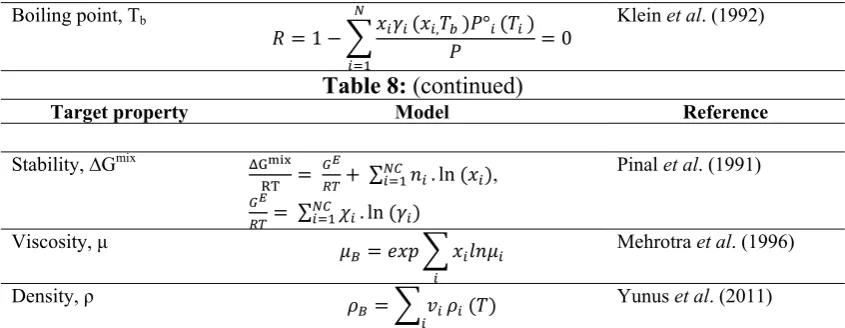
Boiling point, Tb
1 , ° 0 Klein et al. (1992)
Table 8: (continued)
Target property Model Reference
Stability, ∆Gmix G
RT ∑ . ln ,
∑ . ln
Pinal et al. (1991)
Viscosity, μ Mehrotra et al. (1996)
Density, ρ Yunus et al. (2011)
3.1.3 Task 3: Design solvent blend
Task 3.1: Choose input data. Two sets of input data were used in this case study, the solvents and phytochemicals databases. The solvents input data consist of alcohols, hydrocarbons, ethers and esters, while four main phytochemicals in Kacip Fatimah: kaempferol, myricetin, quercetin and rutin were used as phytochemical input data. Input data means the data containing all of the considered pure properties of both solvents and phytochemicals.
Task 3.2: Run solvent design algorithm. The solvent design algorithm is run following all listed levels.
(i) Level 1: Pure component constraints
Step 1.1: Pure component properties of the solvents in the input data and target phytochemicals are compared with respect to the target values. The aim for this level is to obtain a list of pure solvents that match the phytochemical target property values. For this step, two properties, the solubility parameter (δ) and partition coefficient (log p) are considered. These properties have an interrelation between solvent and phytochemicals that affects the extraction process efficiency while the other properties are used for the solvent selection only to ensure their safety and compatibility with the extraction process.
After considering all of the constraints set in this level, 119 binary solvent combinations out of 870 possible total combinations of binary solvents satisfied all of the constraints. These binary solvents combination will be further screened in level 2.
(ii) Level 2: Linear constraints
Step 2.1: In this level, only properties that satisfy the linear mixing rule (Equation 1) as shown in the property library (Table 8) for binary solvent properties calculation will be considered. In this case, toxicity, density and viscosity are taken into account. The result for this step is the composition range for each binary mixture.
Journal of Chemical Engineering and Industrial Biotechnology V4(2018)60-89
(iii) Level 3: Non-linear constraints
Step 3.1: Level 3 is only for the properties that satisfy the non-linear model for binary properties calculation as shown in the property library (Table 8). In this case, only one property, boiling point, was applied to the non-linear model. The boiling point model was solved with x (composition boundary) as input.
Step 3.2: Mixtures that do not match non-linear constraints are rejected. After performing Level 3, only 12 binary solvents still remain.
(iv) Level 4: Stability analysis
Step 4.1: The remaining binary solvents are then described based on the UNIFAC-LLE group representation and the activity coefficients are calculated at the temperature of 90
°C (operating temperature for the extraction of kaempferol from Kacip Fatimah) and the stability tests are performed for all of the remaining candidates.
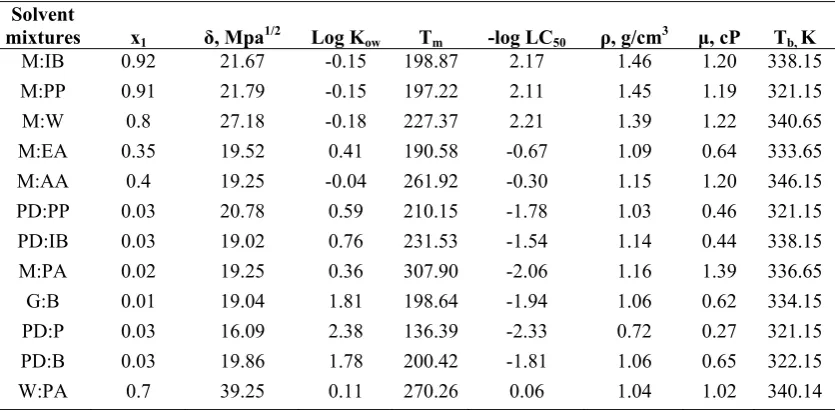
Step 4.2: All mixtures that show a phase separation at the composition boundary, x, are rejected. However, in this case study, none are rejected because none of the 12 binary solvents showed a phase separation. All 12 solvent mixtures with their properties considered in this study are shown in Table 9.
Table 9: Binary solvents that satisfy Level 4 with their properties
Solvent
mixtures x1 δ, Mpa1/2 Log Kow Tm -log LC50 ρ, g/cm3 μ, cP Tb, K
M:IB 0.92 21.67 -0.15 198.87 2.17 1.46 1.20 338.15 M:PP 0.91 21.79 -0.15 197.22 2.11 1.45 1.19 321.15 M:W 0.8 27.18 -0.18 227.37 2.21 1.39 1.22 340.65 M:EA 0.35 19.52 0.41 190.58 -0.67 1.09 0.64 333.65 M:AA 0.4 19.25 -0.04 261.92 -0.30 1.15 1.20 346.15 PD:PP 0.03 20.78 0.59 210.15 -1.78 1.03 0.46 321.15 PD:IB 0.03 19.02 0.76 231.53 -1.54 1.14 0.44 338.15 M:PA 0.02 19.25 0.36 307.90 -2.06 1.16 1.39 336.65 G:B 0.01 19.04 1.81 198.64 -1.94 1.06 0.62 334.15 PD:P 0.03 16.09 2.38 136.39 -2.33 0.72 0.27 321.15 PD:B 0.03 19.86 1.78 200.42 -1.81 1.06 0.65 322.15 W:PA 0.7 39.25 0.11 270.26 0.06 1.04 1.02 340.14
** M: methanol, IB:isobutyraldehyde, PP: n-propionaldehyde, W: water, EA: ethyl acetate, AA: acetic acid, PD: 1,3-propanediol, PA: propionic acid, B: benzene, G: glycerol
Jo F (v) Step binar singl their
ournal of C
Figure 8: N
Level 5: 5.1: Identi ry solvents le solvent. T
respective
Chemical En
Number of so
Cost calcul fication of that satisfy Table 11 sh compositio Sol Me Wa Isob n-p Eth Ace Prio 1,3-Ben Gly So ngineering olvent blend m lation the mixture y Levels 1 hows the so
n.
Table 10: P
lvent/phytoch
ethanol, M ater, W
butylraldehyd propionedehyd hyl acetate, EA etic acid, AA opionic acid, P -propylene gly nzene, G ycerol, B Table 11: olvent Mixtur M:IB M:PP M:W M:EA M:AA PG:PP PG:IB M:PA G:B W:PG PG:B W:PA and Indus
ds reduced a methodolog
e that minim to 4. Table olvent mixt
Price consid
hemicals P
1 2 de, IB 1 de, PP 3
A 3
5
PA 3
ycol, PD 4 1 1
Solvent mi
re x1
0.92 0.91 0.8 0.35 0.4 0.03 0.03 0.02 0.01 0.01 0.03 0.7 trial Biotec after screen gy
mizes the c e 10 shows ture price fo
dered in this
Price (RM/m
1.78x10⁻³ 2.70x10⁻⁶ 1.39 x10⁻¹ 3.16 x10⁻¹ 3.54 x10⁻³ 5.24 x10⁻³ 3.15 x 10⁻¹ 4.18 x 10⁻³ 1.25 x 10⁻³ 1.26 x 10⁻³
ixture price Price, RM/m 0.0123 0.0291 0.0014 0.0028 0.0037 0.2964 0.1303 0.2994 0.3025 0.0040 0.0034 0.0916 chnology V
ning using th
cost is perfo s the cost in for all 12 bi
s study
l)
ml
V4(2018)60-he develope
Jo 3.1.4 predi Both highe Task (i) ident can (Dor Equa data Mod expe the k By u the 1 The h is 0. kaem const low a 0.00 Equa
ournal of C
4 Task 4:
The perf iction of ph h tasks are i
est phytoch
k 4.1: Run P Performa tify which
extract the rtmund) mo ation (9). T from Karim dified UNIF
rimental da kaempferol c using Equati 2 binary so
Figure 9
highest yiel 0 wt/wt for mpferol eve
traints. In th and can be 11 wt/wt of ation (10), Chemical En performan formance ev hytochemic important a hemical com Performance ance 1: Phy solvent mix e target ph odels were The estimate
mi et al. (2 FAC (Dor ata. Thus, th composition ion (9), the olvent comb
: Predicted
ld of kaemp r W:PA. 0 en though a
his design, a neglected. f kaempfero
the yield o
ngineering
nce evaluat
valuation is cal composi s they will mposition wi
e Evaluation ytochemical
xtures (from hytochemic
used to es ed kaempfe 2011). The rtmund) ga his work use n in Kacip F compositio binations are
yield of kae
pferol comp .0 wt/wt m all of the s a compositi As an exam ol and the M obtained is
and Indus
ion
s divided int ition while
evaluate w ith the highe
n Algorithm l compositio m the 12 bi
al. Origina timate the erol compo original U ave 21.46% ed the Modi Fatimah her ons of phyto e predicted a
empferol co in rank
osition is 0 means that t
solvent prop ion value w mple, for G MRM used is
only 0.000
trial Biotec
to two main the second which binary est profit. m on predictio inary solven al UNIFAC activity co sition was UNIFAC ga % error w
ified UNIFA rb based on ochemicals and the resu
omposition e
.4202 wt/wt this solvent
perties are ith less than G:B solvent
s 2 g. After 183 g of k
chnology V
n tasks. The d task is p y solvents w
on. This step nts remainin C and Mo oefficients a
verified wi ave 85.12% when comp
AC (Dortmu the lower e that can be ult is shown
extracted by
t for M:IB, t mixture c within the n 5 wt/wt is mixture, it r substitutin kaempferol.
V4(2018)60-e first task profit evalua would extrac
p is perform ng after Ta dified UNI as formulat
ith experim error whil pared with und) to calc error obtaine e extracted n in Figure 9
y solvent bl
while the lo could not ex e target pro s considered can only ex ng this value If the valu
Jo 0.420 obtai mixtu rejec binar top follo The Algo From lowe be ob (ii) the o herb) 90% and respe As sh profi 0.002 cost kaem mate This Figur other Figur
ournal of C
02 wt/wt (M ined is 0.07
ure. Theref cted, namely
ry solvents five binary wed by M:P
cost of th orithm) and m this figure est cost. Nev btained if th
Figu
Performa obtained pro ) and selling purity is R solvent pr ectively.
hown in Fig it (RM 10.2 27). Then, i
is RM 0.0 mpferol, wh erial cost fo profit and re 11, it ca rs but it also
re 10.
Chemical En
M:IB) and M 7 g. The val
fore, seven y, PG:PP, P remain for y solvents PP, M:W, M
he top five the yield o e, it is seen vertheless, t his phytoche
ure 10: Cos
ance 2: Pro ofit by con g price for t RM 8.58/mg rices, which
gure 11, ext 24) compar it is follow 0026. By u hich is the or M:W is R loss calcula an be conclu o can extrac
ngineering
MRM use of lue calculate
solvent mi PG:IB, M:P
the next p according M:EA and M
binary so of kaempfer that M:W g the next task emical was
st evaluation
ofit evaluati sidering all the extracte g. Input dat h were ob
traction of red with th ed by M:IB using M:W same prof RM 0.0025, ation exclu uded that M ct the secon
and Indus
f 2 g are su ed for G:B ixtures that A, G:B, W erformance to the kae M:AA.
olvents (cal rol that coul gives the hig
k (Performa sold.
n for extrac
ion. The pro l raw mater ed crude oil ta used in th btained from
1 mg of kae he others w B with a pro W, it can gi fit as for M
, M:EA is R des manpow M:PP not on nd highest am
trial Biotec
ubstituted in is very sma t gave less :PG, PG:B e (Performan
empferol c
lculated in ld be extrac ghest predic ance 2) will
tion of Kac
ofit evaluat rials cost (s . The sellin his calculat m Herbs (
empferol us with modera ofit of RM
ive a profi M:EA and
RM 0.0042 wer, utility nly gives th mount of ka
chnology V
nto Equation all compare
than 5 wt and W:PA. nce 2). The composition
Step 5.1, cted is plott cted kaemp l reveal the
cip Fatimah
ion objectiv solvents and ng price for
tion are raw (2014) and
sing M:PP g ate raw ma
10.00 and it of RM 8
M:AA. Ho 2 and M:AA and electri he highest p
aempferol,
V4(2018)60-n (10), the r ed with the t/wt of yiel . Thus, only e ranking fo n yield is
Solvent D ted in Figur ferol yield profit that m
herb
ve is to com d Kacip Fat
kaempferol w Kacip Fat (ICIS (20
gives the hi aterial cost
the raw ma 8.58 per m owever, the A is RM 0.0
icity costs. profit amon as also show
Jo Task The (whi phyto phyto Figur profi highe mean Wu ( indus prior as th
A s phyto kaem solve
ournal of C
Figu
k 4.2: Rank purpose of ch have th ochemicals) ochemicals
re 12 show it for this m
est profit bu ns, the mixt (2012)stated strial compa rity as comp
e mixture th
systematic ochemicals mpferol from
e the solve
Chemical En
ure 11: Cos solvent blen f this task is he lowest so
). All five b compositio
ws that the M mixture is ut is ranked ture can extr
d that the lo any when th pared with t
hat can prod
Figure
methodolo from herb m Kacip Fa
ent blendin
ngineering
st evaluation nds candida s to rank th olvent cost binary solve on, as illustr
M:IB mixtu ranked sec d second in t
ract high yi ow-cost man
he product i the extractio duce a high
12: The ran
4.0 C
gy for th bs has been atimah herb ng problem
and Indus
n for extract ates
he binary so ts and have ents are rank rated in Figu
ure has the h cond. On th
terms of ex ield of phyto
nufactured p is to be sold on yield. In
extraction y
nk for the p
CONCLUSI
he design n developed b. A decom m for extra
trial Biotec
tion of Kaci
olvents that e the poten
ked accordi ure 12.
highest extr he other ha xtraction yie ochemicals product wo d. Thus, the this study, yield as we
profit and ex
IONS
of blende d and was mposition m
action of p
chnology V
ip Fatimah h
can give th ntial to extr
ing to desce
raction yiel and, M:PP eld. High pr with low ra ould always e profit is ch
the M:PP m ll as profit.
xtraction yie
ed solvent tested on t method has
phytochemi
V4(2018)60-herb.
he highest p ract the sel ending profi
ld. Howeve mixture ha rofit in this aw material be chosen b hosen as the mixture is ch
Journal of Chemical Engineering and Industrial Biotechnology V4(2018)60-89
objectives are quickly to screen out a large number of alternatives and to reduce the search space at each hierarchical step. The methodology can be used to design blended solvent for extracting phytochemicals from any herb where the scope and size of the case study depend on the solvent database available and availability of models. This methodology is described and highlighted for binary solvent mixtures, but can easily be extended to multicomponent mixtures. For future work, this systematic methodology needs to be verified for extraction of different phytochemicals from various herbs as case studies.
ACKNOWLEDGEMENT
This work was supported by the Fundamental Research Grant Scheme, FRGS (Vote number: R.J130000.7809.4F488), Universiti Teknologi Malaysia (UTM), Universiti Malaysia Kelantan (UMK) and the Ministry of Education, Malaysia. This support is gratefully acknowledged.
REFERENCES
Abdullah, F.; Ling, S. K.; Man, S.; Tan, A. L.; Tan, H. P. and Abdullah, Z. (2012). Characterization and identification of Labisia pumila by multi-steps infrared spectroscopy. Vibrational Spectroscopy, 62, 200-206.
Barton, A. F. (1990). Polymer-liquid interaction parameters and solubility parameters. Boca Raton Florida, USA: CRC press.
Cheng, H. C. and Wang, F. S. (2007). Trade-off optimal design of a biocompatible solvent for an extractive fermentation process. Chemical Engineering Science, 62, 4316-4324.
Cheng, H. C. and Wang, F. S. (2008). Optimal process/solvent design for ethanol extractive fermentation with cell recycling. Biochemical Engineering Journal, 41, 258-265.
Cheng, H. C. and Wang, F. S. (2010). Computer-aided biocompatible solvent design for an integrated extractive fermentation–separation process. Chemical Engineering Journal, 162, 809-820.
Choi, H.-K.; Kim, D.-H.; Kim, J. W.; Ngadiran, S.; Sarmidi, M. R. and Park, C. S. (2010). Labisia pumila extract protects skin cells from photoaging caused by UVB irradiation. Journal of Bioscience and Bioengineering, 109, 291-296. Conte, E.; Gani, R.; Cheng, Y. S. and Ng, K. M. (2012). Design of formulated products:
Experimental component. AIChE Journal, 58, 173-189.
Conte, E.; Gani, R. and Ng, K. M. (2011). Design of formulated products: a systematic methodology. AIChE Journal, 57, 2431-2449.
Damartzis, T.; Kouneli, A.; Papadopoulos, A. I.; Seferlis, P.; Dimitriadis, G. and Vlachopoulos, G. (2014). Optimal design of dolvent based post combustion co2 capture processes in quicklime plants. Chemical Engineering, 39.
Diallo, D.; Hveem, B.; Mahmoud, M. A.; Berge, G.; Paulsen, B. S. and Maiga, A. (1999). An ethnobotanical survey of herbal drugs of Gourma district, Mali. Pharmaceutical Biology, 37, 80-91.
Journal of Chemical Engineering and Industrial Biotechnology V4(2018)60-89
Folić, M.; Adjiman, C. S. and Pistikopoulos, E. N. (2005). A computer-aided methodology for optimal solvent design for reactions with experimental verification. Computer Aided Chemical Engineering, 20, 1651-1656.
Gani, R. (2004). Computer-aided methods and tools for chemical product design. Chemical Engineering Research and Design, 82, 1494-1504.
Gani, R. and Brignole, E. (1983). Molecular design of solvents for liquid extraction based on UNIFAC. Fluid Phase Equilibria, 13, 331-340.
Garg, S. and Achenie, L. E. (2001). Mathematical programming assisted drug design for nonclassical antifolates. Biotechnology progress, 17, 412-418.
Herbs, D. J. (2014). Pembekal kacip fatimah [Online]. Malaysia. Available: http://www.delimajelita.com/2009/12/serbuk-kacip-fatimah.html [Accessed 24 November 2014].
Hill, M. (2009). Chemical product engineering—the third paradigm. Computers & Chemical Engineering, 33, 947-953.
Icis. (2014). Indicative Chemical Prices A-Z [Online]. New York: ICIS. Available: http://www.icis.com/chemicals/channel-info-chemicals-a-z/ [Accessed 10 October 2014].
Karimi, E.; Jaafar, H. Z. and Ahmad, S. (2011). Phytochemical analysis and antimicrobial activities of methanolic extracts of leaf, stem and root from different varieties of Labisa pumila Benth. Molecules, 16, 4438-4450.
Karimi, E.; Jaafar, H. Z. and Ahmad, S. (2013). Antifungal, anti-inflammatory and cytotoxicity activities of three varieties of labisia pumila benth: from microwave obtained extracts. BMC complementary and alternative medicine, 13, 20.
Karunanithi, A. T.; Achenie, L. E. and Gani, R. (2005). A new decomposition-based computer-aided molecular/mixture design methodology for the design of optimal solvents and solvent mixtures. Industrial & engineering chemistry research, 44, 4785-4797.
Karunanithi, A. T.; Achenie, L. E. and Gani, R. (2006). A computer-aided molecular design framework for crystallization solvent design. Chemical engineering science, 61, 1247-1260.
Karunanithi, A. T.; Acquah, C.; Achenie, L. E.; Sithambaram, S. and Suib, S. L. (2009). Solvent design for crystallization of carboxylic acids. Computers & Chemical Engineering, 33, 1014-1021.
Kerton, F. M. and Marriott, R. (2013). Alternative solvents for green chemistry. (2nd ed). Cambridge, UK: Royal Society of chemistry.
Klein, J.; Wu, D. and Gani, R. (1992). Computer aided mixture design with specified property constraints. Computers & Chemical Engineering, 16, S229-S236. Kumoro, A. C. and Hasan, M. (2008). Extraction of herbal components–the case for
supercritical fluid extraction. Teknik, 29, 180-183.
Lee, C.; Choy, K. and Chan, Y. (2014). A knowledge-based ingredient formulation system for chemical product development in the personal care industry. Computers & Chemical Engineering, 65, 40-53.
Liao, M.; Zhao, Y.; Ning, P.; Cao, H.; Wen, H. and Zhang, Y. (2014). Optimal design of solvent blend and its application in coking wastewater treatment process. Industrial & Engineering Chemistry Research, 53, 15071-15079.