Non-Inductive Current Drive by EC Waves in an Inboard Poloidal
Magnetic Field Null Configuration on the Spherical
Tokamak QUEST
∗
)
Saya TASHIMA
1), Hideki ZUSHI
2), Mitsutaka ISOBE
3), Hiroshi IDEI
2), Shoichi OKAMURA
3),
Kazuaki HANADA
2), Kazuo NAKAMURA
2), Akihide FUJISAWA
2), Keisuke MATSUOKA
2),
Makoto HASEGAWA
2), Yoshihiko NAGASHIMA
2), Shoji KAWASAKI
2), Hisatoshi NAKASHIMA
2),
Aki HIGASHIJIMA
2)and QUEST Team
1)IGSES, Kyushu University, Kasuga, Fukuoka 816-8580, Japan
2)RIAM, Kyushu University, Kasuga, Fukuoka 816-8580, Japan
3)National Institute for Fusion Science, Toki 509-5292, Japan
(Received 21 November 2012/Accepted 18 June 2013)
To investigate the effects of confinement of fast electrons on poloidal beta equilibrium, experiments un-der different toroidal magnetic mirror ratios, MOMFC, were performed in electron cyclotron heated plasma in
the spherical tokamak QUEST. The proportional constants of the relation between plasma current and vertical magnetic fields decreased with increase inMOMFC. The poloidal field null point appeared in the chamber for
MOMFC>1.8 at a plasma current value of∼15 kA. Poloidal beta and temperature of hard X-rays increased with
MOMFC. This suggests that high poloidal beta equilibrium plasma is produced by better confinement of energetic
trapped particles.
c
2013 The Japan Society of Plasma Science and Nuclear Fusion Research
Keywords: non-inductive current drive, electron cyclotron resonance heating, energetic electron, high poloidal beta, trapped electron
DOI: 10.1585/pfr.8.2402118
1. Introduction
Efficient plasma current (Ip) startup and high
perfor-mance sustainability without the use of center solenoid coils is critical for future tokamak reactors. Non-inductive current startup using electron cyclotron resonance heating (ECH) has been on several tokamaks and spherical toka-maks (STs) [1–4]. Recently, it has been suggested thatIp
is generated by trapped particles in STs [5, 6]. To iden-tify current drive mechanisms, the dependence of initial plasma currentIpinitialon vertical magnetic fieldBz, ratio of
Bzto toloidal magnetic field (Bt;Bz/Bt), curvature of
mag-netic field lines, and decay indexn∗ (= −d(lnBz)/d(lnR))
has to be examined in open magnetic fields (OMFC). In TST-2, current startup experiments have been performed using a frequency of 2.45 GHz and theBzdependence of
Ipramp-up rate andIpinitial(<1.2 kA) has been investigated
under the condition ofBz < 1 mT forn∗ = 0.06 - 1.1 [4].
It has been concluded that high-energy electrons (∼1 keV) play an important role onIinitial
p , but not after current
ramp-up. In the QUEST device, a new startup scenario has been tested using ECWs at a high toroidal magnetic mirror ratio (MOMFC)∼2 (=n∗∼0.5) with a highBz/Btof 10% at the
fundamental resonance layer,Rres1[7]. HereMOMFCis
de-author’s e-mail: [email protected]
∗)This article is based on the presentation at the 22nd International Toki
Conference (ITC22).
fined as the ratio ofBtat the chamber walls (inner center
stack or top/bottom plates) toBtat the starting point (e.g.,
at second resonance layerRres2) on the mid-plane along
the magnetic field lines. When MOMFC is increased, the
width of pitch angle of trapped particles,Δθtrap, in velocity
space is increased. For the case ofMOMFC = 2, because
the field lines are strongly curved, particles whoseΔθtrapis
45◦- 135◦can be trapped. For the case ofMOMFC=1.2, a
Δθtrap value of 65◦- 115◦ is estimated. The banana width τbrelates inversely toBzand proportionally withv//. With
increasing Bz, the banana width becomes narrower, even
for high v//. Therefore, increments of Bz and MOMFC
are favorable for confinement of energetic trapped elec-trons. Better confinement of energetic trapped electrons causes an increase in pressure. In these experiments [7], because of highβp (ratio of plasma pressure to poloidal
magnetic pressure) plasma, under highMOMFCand ECW
driven current, the inboard poloidal null configurations (IP-NCs) characterized by highβpare observed in steady state.
High βp plasma has been demonstrated by means of Ip
ramp-down, NB heating, and lower hybrid current drive (LHCD) [8–10]. However, in QUEST, steady-state high βpplasma bounded by the separatrix could be sustained by
ECWs in highMOMFCandBzconfigurations.
In this review, we describe the manner in which con-fined energetic electrons contribute to phot and plasma
c
2013 The Japan Society of Plasma
equilibrium through βp by measuring the hard X-ray
(HXR) energy spectrum. To investigatev⊥ >v//electrons, such as trapped electrons, the measurement of vertical line of sight (perpendicular to toroidal magnetic field lines) is conducted for different MOMFC values. The relation
be-tweenIpandBzis compared to the MHD equilibrium
rela-tion [11]:
Bz=μ0Ip(In(8R/a)+li/2−3/2+βp)/4πR, (1)
whereliis the internal inductance. The effects ofMOMFC
onβp=(βbulkp +βhotp ) and correlation betweenβhotp and HXR
are investigated.
This manuscript is organized as follows. Section 2 provides a device description of the small aspect ratio chamber and experimental conditions used to sustain Ip.
Section 3 discusses our investigation of the equilibrium re-lation ofIp-Bzfor differentMOMFCvalues and energetic
electron energy through measurement of HXR.
2. Experimental Setup and
Condi-tions
QUEST is a medium-sized device, whose inner and outer diameters are 0.23 m and 1.33 m, respectively. The major (R0) and minor (a) radii of the plasma are 0.7
-0.85 m and 0.2 - 0.4 m, respectively. The chamber aspect ratioAc(=Rc/ac ≈ 1.4) is derived as (Rout+Rin)/(Rin −
Rout) by the chamber major radiusRc=(Rin+Rout)/2 (≈
0.78 m) and the chamber minor radiusac =(Rout−Rin)/2
(≈0.55 m). The chamber mirror ratioMc-mirroris
approxi-mated byRc/Rinto be∼3.4. AtR=0.6 m,Mc-mirroris 2.6.
MOMFCandBzare changed by a combination of poloidal
field coils and coil current value, respectively. Two flat di-vertor plates are set atZ =±1 m from the mid-plane. RF waves (< 150 kW) at a frequency of 8.2 GHz are used to initiate plasma and sustain plasma current. Btis 0.29 T at
Rres2, andRres1andRres2locate at 0.3 m and 0.6 m,
respec-tively. Two antenna systems are used; one launches ECWs atZ =−0.08 m in the O-mode, whose parallel refractive index is< 0.4, and another antenna system launches in the O and X mixed modes. The working gas is H2and is
puffed 0.3 s before RF injection by a piezo valve.
Typ-Fig. 1 Discharge wave-forms ofIp,Bz,Prf,nel, andΓHXfor (a)MOMFC=1.2, (b)MOMFC=1.4 (aftert=3 s), and (c)MOMFC=2.
ical plasma density ne is below the cut-off density ncut
(∼8.6×10¹⁷m−3).
The measurements of energetic electrons have been performed by investigating their emitted HXR along the observation path. A semiconductor detector CdTe, with a size of 4 mm×4 mm×1 mm, is used to detect bremsstrahlung emitted by energetic electrons in the en-ergy range from 10 to 500 keV, which corresponds to CdTe detector absorption efficiencies [12] of 100% to 10%, re-spectively. Pulse height analysis is used to obtain the en-ergy spectrum with a time resolution of a few milliseconds. The observation lines view plasma tangentially on the mid-plane with a radial resolution of±0.1 m at a tangential ma-jor radius ofRtan = 0.6 m. The vertical viewing chords
cover the major radius on mid-planeRmidfrom 0.2 m to 1 m
with a resolution ofΔRmid=60 mm (for radial scanning).
The reconstruction of the flux surface is performed using 64 flux loops and a Rogowskii coil. The electron density is measured by an interferometer of 138 GHz along the hori-zontal path.
3. Experimental Results
To investigate how the confined energetic electrons contribute to plasma equilibrium throughβp, plasma
cur-rent drive experiments under differentMOMFCandBz
val-ues and measurement of HXR were conducted. MOMFC
was varied from 1.2 to 2 andBzfrom 0.5 to 16 mT.
Fig-ure 1 shows the discharge waveforms ofIp, Bz, line
inte-grated densitynel, and HXR fluxΓHXin the energy ranges
of more than 50 keV.
Figure 1 a show the waveforms for the Bz
ramp-up discharges under an almost constant MOMFC value of ∼1.1 - 1.2 andPrf ≈100 kW. To achieveIp ≈15 kA, the
magnitude ofBzwas temporally increased, but the
induc-tive field was less than 10 mV.Ip increased from 5 kA at
Bz=1.4 mT to 15 kA atBz=4 - 5.7 mT (within 0.3 s). At
Bz ≥4 mT, the increase ofIp stopped. A steady
applica-tion ofBzof more than 2 mT caused the termination ofIp.
In steady state, the values ofnel ≈ 2×10¹⁷m−3 ΓHX ≈
4.6×10³CPS were observed. Appreciable levels ofΓ HX
Fig. 2 Ip-Bzrelation forMOMFC=1.2 (gray solid line and black squares), 1.3 (crosses), 1.4 (blue solid line), 1.8 (green triangles), 2 (red solid line, open circles, and filled cir-cles), and 2.7 (yellow triangles). These lines and sym-bols correspond to Bzramp-up discharges and constant discharges.
further increased from 4 to 8 mT during the interval from 2.4 to 3.0 s and the correspondingMOMFCranges from 1.2
to 1.4 atPrf = 45 kW. First,Ip was ramped up, as shown
in Fig. 1 (a). Second, att = 2.3 s, divertor and solenoid coils were switched on to increaseMOMFC. Finally,MOMFC
reached a value of 1.4. A steady state withIp ≈ 15 kA
andnel≈1.5×10¹⁷m−3atBz =8 mT was obtained after
t=3 s. HXR were emitted at 2.4 s, with respect to time of start to increaseMOMFC, andΓHX≈6.9×10³CPS was
ob-served at steady state. Figure 1 (c) shows the discharge un-der constantBz =16 mT andMOMFC=2 atPrf ≈45 kW.
Rapid increases of Ip (dIp/dt = 75 kA/s) were observed,
and HXR emissions began with the increases inIp. AΓHX
value of∼1×10⁴CPS was observed.
To investigate the equilibrium relations between Ip
andBz, they are plotted in Fig. 2 for differentMOMFC
val-ues. Figure 2 showsIpversusBzfor differentMOMFC
val-ues. The solid lines are the traces in theBz-Ip space of
the discharges shown in Figs. 1 (a) and (b). These lines ter-minated at steady state. The symbols correspond to steady stateIps of the discharge under constantBzs, as shown in
Fig. 1 (c). For MOMFC = 1.2, Ip increased linearly up to
5 kA asBz increased to 1.7 mT, but it dropped to< 1 kA
at Bz > 1.8 mT. On the other hand, at Bz ramp-up
dis-charge,Ip reached 15 kA at 4 mT. These cases ofBz
con-stant and ramp-up show the same proportional concon-stant for
Fig. 3 Ploidal magnetic flux contours for (a) MOMFC = 1.2, (b)MOMFC=1.4, (c)MOMFC=1.8, and (d)MOMFC=2.
MOMFC=1.2. ForMOMFC=1.3, at constantBzdischarge
(Prf =70 kW),Ipincreased linearly to 7 kA asBzincreased
to 5 mT andIpdecreased to 3 kA±0.5 kA atBz >6 mT.
ForMOMFC=1.4,Ipincreased linearly up to 14 - 16 kA at
Bz=8 mT in steady state. ForMOMFC =1.8, 2, and 2.7,
it was not observed thatIpdropped or stopped increasing.
In addition, the proportional constant of theIp-Bzrelation
was maintained. ForMOMFC=1.2, 1.4, and 2, the inverse
of proportional constantsBz/Ipwas 0.3, 0.5, and 1 mT/kA,
respectively, in steady stateIp≈15 kA. This suggests that
strongerBzis required to attain the same Ip as MOMFCis
increased up to 2.
Figure 3 shows the reconstructed closed magnetic flux surfaces forMOMFC=1.2, 1.4, 1.8, and 2 atIp ≈15 kA±
1 kA taken at Bz = 4.79, 8.47, and 15 mT, respectively.
The first type of plasma shape (Fig. 3 (a)) is non-circular, which is characterized by an elongationκ =1.14 (and tri-angularityδ=0.24) with an aspect ratioA(=R0 =a=
0.69 m/0.45 m) of 1.63 and Shafranov shiftΔ=0.047 [11]. The value of βp is evaluated as 0.64 from Eq. (1), with
an assumption of internal inductanceli = 1.2, assumed
by the parabolic profile of the plasma current. A typical low aspect ratio spherical tokamak was present. The sec-ond plasma shape is circular and small, with parameters
a = 0.25 m,R0 = 0.47 m,A =1.87,κ = 1, Δ =0.06,
andβp evaluated as 0.93. Figure 3 (c) shows an oblate
shape, with parametersa=0.2 m,R0=0.655 m,A=2.8, κ=0.63,Δ=0.124, andβpevaluated as 3.26. Figure 3 (d)
Fig. 4 Energy spectra of HXR for MOMFC = 1.2 (triangles),
MOMFC=1.4 (crosses) andMOMFC=2 (circles).
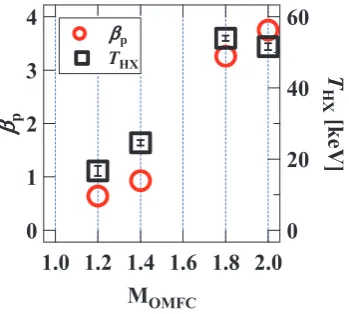
Fig. 5 βp(circles) andTHX(squares) as a function ofMOMFC.
R0=0.73 m, A =2.9,κ =0.63,Δ=0.106, andβp
eval-uated as 3.7. For Figs. 3 (c) and (d), the poloidal field null points appears in the chamber, which is caused by an in-creasingβp.
Figure 4 shows the HXR energy spectra for each MOMFC for Rmid =0.6 m. The energy spectra show that
photon counts and energy increased with MOMFC.
Fig-ure 5 shows βp and HXR temperature THX as a
func-tion ofMOMFC. THX is calculated in the energy range of <200 keV. Figure 5 shows thatβpandTHXincreased with
MOMFC. The high value ofTHXmay be because of the rich
confinement of fast electrons caused by the highMOMFC
andBz configurations. Thereafter, the confined fast
elec-trons contribute to the formation of highβpplasma.
To investigate the energetic electrons on the forma-tion of inboard poloidal null configuraforma-tion accompanied by highβp, a radial distribution ofTHXwas measured. Figure
6 (a) shows the last closed flux surface of inboard poloidal null (IPN) and limiter configurations. For the limiter con-figuration,Ip≈15 kA andPRFwas 100 kW, the same
mag-netic configuration as in Fig. 3 (a).Ipwas∼10 kA andPRF
was 45 kW for the IPN configuration. For the IPN config-uration,a = 0.15 m, R0 = 0.69 m, A =2.9, κ =0.78, Δ = 0.13 m, and Δ/a = 0.53. βp was evaluated as 3.1
withli = 1.2. In Fig. 6 (a), the dashed lines (blue)
repre-sent the path of HXR radial measurement. In these charges, the HXR detection path was changed on each charge. The shot-to-shot variation during 20 plasma
dis-Fig. 6 (a) Last closed magnetic flux surface for limiter (dark) and IPN configurations (red). The dashed dotted lines are HXR detection paths. (b) Radial profiles ofTHXfor the limiter (triangles) and IPN (circles) configurations.
charges was monitored by another HXR detector and it was almost constant. Figure 6 (b) shows the radial profiles of THXfor the limiter and IPN configurations. For the limiter
configuration, theTHX profiles were spatially flat and the
energy was∼20 keV. ForRmid <0.3 m, because too many
photons were observed, which is caused by energetic elec-trons being lost to inner limiter, it was impossible to cal-culateTHX. It observed that in the IPN configuration, the
photon count (80 - 300 keV) was 6 times larger than that in the limiter configuration atRmid =0.75 m. For the IPN
configuration, theTHX profile peaked at Rmid = 0.75 m,
which corresponds to the magnetic axis. Outside of the closed flux surface,Rmid <0.9, aTHXvalue∼25 keV was
4. Conclusion
To investigate the effects of the confinement of ener-getic electrons onβpequilibrium, experiments with diff
er-ent confinemer-ent conditions of trapped particles were per-formed. We observed that with increasingMOMFC, theIp
-Bz relation shows that stronger Bz is required for
equi-librium at the same Ip values. Furthermore, the natural
poloidal field null configuration, which is caused by high βp, appeared asMOMFCincreased. The peak position of the
radial profile ofTHXagrees fairly well with reconstructed
magnetic surfaces. The role of energetic electrons on high βpplasma was investigated by HXR, which supported the
good confinement performance of energetic electrons.
Acknowledgments
It is a pleasure to acknowledge the invaluable contri-bution of the QUEST technical and data acquisition staffs. This work is supported by a Grant-in-aid for Scientific Re-search (23·4190). This work is also performed with the
support and under the auspices of the NIFS Collaboration Research Program (NIFS11KUTR063).
[1] C.B. Forestet al., Phys. Rev. Lett.68, 3559 (1992). [2] T. Yoshinagaet al., Phys. Rev. Lett.96, 125005 (2006). [3] T. Maekawaet al., Nucl. Fusion45, 1439 (2005).
[4] J. Sugiyama, A. Ejiri et al., Plasma Fusion Res.3, 026 (2008).
[5] A. Ejiriet al., Nucl. Fusion46, 709 (2006).
[6] T. Yoshinagaet al., Plasma Fusion Res. SERIES8, 0100 (2009).
[7] H. Zushiet al., 24th IAEA FEC EX/P2-14 (2012). [8] G.A. Navratilet al., in Plasma Phys. and Contr. Nucl.
Fu-sion Research 1990 (Proc. 13th Int. Conf., Washington D. C., 1990), Vol.1, IAEA, Vienna 209 (1991).
[9] S.A. Sabbaghet al., Phys. Fluids B3, 2277 (1991). [10] M.E. Mauelet al., Nucl. Fusion32, 1468 (1992).
[11] V.D. Shafranov et al., Reviews of Plasma PhysicsVol.2 (Consultants Bureau, New York, 1966).