Corresponding author, email: [email protected](M. Rezaei Sameti). Tel.: +98 813 2355404.
Asian Journal of Nanoscience and
Materials
Journal homepage: www.ajnanomat.com
Orginal Research Article
A DFT, NBO, RDG, MEP and thermodynamic sudy of acrolein
interaction with pristine and Ga‒doped boron phosphide
nanotube
Nasim Korivand, Mahdi Rezaei-Sameti
Department of Applied Chemistry, Faculty of Science, Malayer University, Malayer, 65174, Iran
A R T I C L E I NF O R MA T I O N A B S T R A C T
Received: 27 November 2018
Received in revised: 16 February 2019 Accepted: 3 March 2019
Available online: 9 April 2019
DOI: 10.26655/AJNANOMAT.2019.4.3
In this research, the interaction of the acrolein (Acr) molecule with the pristine and Ga‒doped boron phosphide nanotube (BPNTs) was investigated using the density functional theory (DFT). The electrical, quantum, thermodynamic properties, natural bond orbital (NBO), reduced density gradient (RDG), atom in molecule (AIM), and molecular electrostatic potential (MEP) for all studied models were calculated and analyzed. The results revealed that the thermodynamic parameters (∆H and ∆G) values for all studied models were negative and favorable in thermodynamic point of view. By doping the Ga atom and adsorbing Acr molecule, the HOMO, LUMO, gap energy, conductivity, and optical properties of the nanotube altered slightly from the original values. Whereas, the global hardness and chemical potential of the Ga-doped increased slightly from pristine state and the activity of system decreased slightly from the original state. In addition, the AIM parameters and RDG results showed that the covalent bonding interaction between Acr and BPNTs was so strong.
KEYWORDS Acrolein BPNTs Ga doped DFT MEP
Introduction
Acrolein (Acr) (propylene aldehyde) is a clear or colorless liquid with a burnt, sweet piercing, and pungent smell. It is formed by the breakdown of many pollutants found in outdoor air [1, 2]. Acrolein is toxic to humans following inhalation, oral or dermal exposures and is a strong irritant for the skin, eyes, and nasal passages. At much higher concentrations, it is used to make chemical weapons [3]. Although Acr has been shown to be cytotoxic and genotoxic in human cells, as a suspected carcinogen its carcinogenicity in animal models has not been adequately evaluated because of its extremely potent toxic effects, which often result in death [4, 5]. No information is available on its reproductive, developmental, or carcinogenic effects in humans, and the existing animal cancer data are considered inadequate to make a determination that Acr is carcinogenic to humans [6‒8]. The aims of this study to finding a useful detector or adsorbent of Acrolein for humans’ peace.
In recent years, following the discovery and successful identification of carbon nanotubes in nature [9], extensive research has carried out on other nanotubes that made of the third and fifth group elements.One of the most important them is the boron phosphide nanotubes (BPNTs). The extensive studies have been carried out on the structural and electronic properties of boron phosphide nanotube, and the electric field gradient tensors, chemical shielding tensor parameters, Ge‒doped, electronic properties, Ga-doped, Ge&As‒ doped, Ge‒doped, carbon ring‒doping, Si‒doped , carbon decorated and carbon‒doped of armchair and zigzag boron phosphide nanotubes have been investigated [10‒21]. The results of some studies revealed that boron phosphide nanotube has a unique electrical and mechanical behavior, and it has significant
changes with the replacement of metallic and non-metallic elements. Ahmadi et al. reveal that Ga‒doped, and Pd‒decorated BPNTs increased the adsorption of phenol molecule on the surface of zigzag single‒walled nanotubes [22].
Baei et al. indicated that the pristine and doped
BPNTs are a good adsorbent for CO, H2O2, NH3, thiazole and OCN− , SCN− ions [23‒28]. Soltani et al. showed that the adsorption of SCN− ion on the surface of AlN, AlP, and BP nanotubes is chemisorption [29]. Soleymanabadi et al. results revealed that H2 gas could be dissociated on the surface of BN, AlN, BP, and AlP nanotubes [30]. The results of our pervious study demonstrated that the doping of Ga, N and GaN and 3C atoms on the BPNTs increased adsorption properties of nanotube respect to HCN and F2 molecule respectively [31‒32]. On the other hand, doping of AsGa on the (4, 4) armchair models of BPNTs increased the adsorption of CO gas and alter the electrical properties of nanotube [33]. Following our previous work, in this project we decided to investigate the interaction and adsorption of the acrolein molecule on the surface of pristine and Ga doped BPNTs. The results of this project may be useful for making the adsorbent or detector of acrolein molecule. For this system, there is no any experimental and theatrical result.
Computational details
specify the appropriate configurations. The A and B models are used to determine the adsorption of Acr on the surface of B43 and P53 atoms of the pristine (8,0) zigzag BPNTs respectively. The C and D models are used to determine the adsorption of Acr on the surface
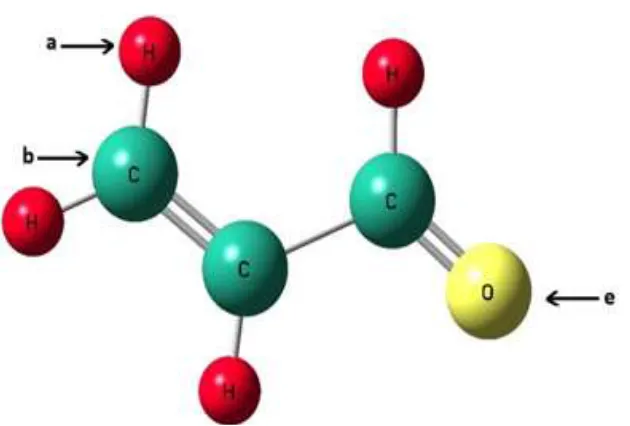
of Ga/B43 and Ga/P53 atoms of the Ga‒doped (8,0) zigzag BPNTs respectively. In each models, the Acr molecule is approaching on the surface of nanotube with three directions. Which are shown in Figure 1 with the a, b, and e letters.
Figure 1. The adsorption position of acrolein molecule on the surface of BPNTs
The full-optimized structures of pristine BPNTs reveal that the bond length of B-P bond is 1.90 Å and this result is in good agreement with other reports [10‒22] and with doping Ga atom increase significantly from original value to 2.25 Å.
The adsorption energy (Eads) and thermodynamic parameters such as ∆H, ∆S and ∆G for ACr adsorption on the surface of the pristine and Ga doped BPNTs were calculated using Equation (1):
∆K = KBPNTs-Acr –(kBPNTs +KAcr)+ BSSE K:Eads, H, S, G
where KBPNTs-ACr is the total energy and thermodynamic parameters of the complex consisting of ACr gas and BPNTs, while KBPNTs and KACr are the total energies and thermodynamic parameters of BPNTs and ACr molecule respectively. The BSSE is basis set
superposition errors. The calculated results reveal that the BSSE values for adsorption energy are in range 0.0002 to 0.0014 eV and all calculated energy were corrected. However, the quantum descriptive such as the gap energy (Egap), electronic chemical potential (μ), global hardness (η) and charge transfer parameters (ΔN) wre calculated at the above level of theory.
Results and Discussion
Structural parameters
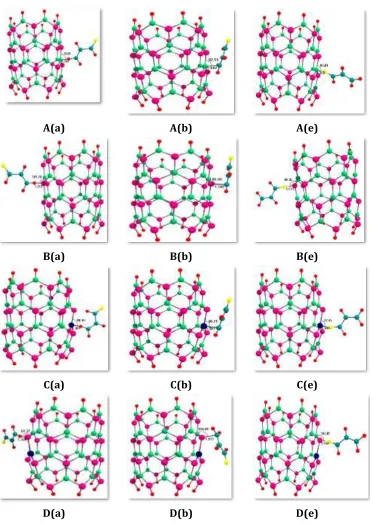
A(a) A(b) A(e)
B(a) B(b) B(e)
C(a) C(b) C(e)
D(a) D(b) D(e)
Figure 2. 2D views of acrolein molecule adsorption on the surface of pristine and Ga doped (6, 0) zigzag model of BPNTs for adsorption models
Based on the calculated results Table 1 the dipole moment values of all adsorption models are in range 0.72 to 11.44 Debye. Among of all adsorption models, the A‒e, B‒e, C‒e and D‒e
structure of the nanotube has the highest polarization.
Table 1. Calculated adsorption, deformation energy of nanotube acrolein (Acr) and total, binding energy (Kcal.mol-1), binding distance (D) and dipole moment (µd ) for nanotube and acrolein for adsorption models (see Figure 1)
A-a A-b A-e B-a B-b B-e C-a C-b C-e D-a D-b D-e
Eads 17.30 - 16.22 - 22.09 - 17.25 - 20.41 - 32.34 - 10.06 - 8.44 - 19.19 - 7.85 - 7.83 - 23.82 -E def-BP 15.85 20.20 - 5.10 15.80 - 15.26 - 5.89 -0.09 0.28 5.28 0.62 0.77 6.66 Edef-Acr -0.95 5.94 1.38 -0.95 -0.85 1.27 -0.81 0.81 - -0.39 0.90 - 0.89 - 0.06
μ𝑑(Debye) 4.98 0.72 11.44 5.44 4.98 10.56 4.17 4.86 10.87 2.87 1.61 10.85 d (Å) 1.24 1.65 1.26 1.32 1.74 1.62 1.30 1.68 1.41 1.32 1.87 1.65 The adsorption energy of all models is
calculated by Eq. 1, and results indicate that the adsorption energy of all systems are in range ‒ 7.83 to‒32.34 Kcal/mol and is exothermic, these results confirm that the adsorption of Acr on the surface of nanotube is physorption type. With doping of Ga atom, the amount of adsorption energy in the C‒a, C‒b, C‒e, D‒a, D‒ b, and D‒e models have been significantly reduced. These results demonstrate that the adsorption of Acr on the surface of pristine model BPNTs is more favorable than Ga doped models. On the other hand, comparison the adsorption energy and dipole moment of Acr/BPNTs complex indicate that with increasing dipole moment the adsorption energy increase.
To understand the interaction of Acr with BPNTs, we calculated the deformation energy (Edef) of Acr, BPNTs and Acr/ BPNTs for adsorption models using Equations. 2 and 3: Edef BPNTs = E BPNTs - EBNTs (2)
E def A cr =E Acr in complexr – E A Cr (3)
where the EBPNTs in complex and EAcr in complex are the total energy of BPNTs and Acr in the
Acr/BPNTs complex, when Acr and BPNTs are absent oneself respectively.
According to the calculated results of Table 1, the deformation energy values of the Acr molecule at the A‒b, A‒e, B‒e, and D‒e are positive and on the other models are negative. While the deformation energy values of BPNTs at the A‒a, B‒a and B-b are negative and on the other models are positive. The negative amount of deformation energy shows that the molecular deformation is spontaneous and the molecular structures of compound change spontaneously from original state. The deformation energy of BPNTs in the A‒a (‒15.85 Kcal/mol), is more negative than other models and so the deformed structure in these models is more stable than other models.
Thermodynamic parameters
The thermodynamic parameters such as ∆H, ∆S and ∆G for adsorption of Acr on the surface BPNTs are calculated and results are listed in Table 2.
ΔG(Kcal/mol) ΔH(Kcal/mol) ΔS (Cal/mol.K) A-a -66.83 -67.99 -4.19 A-b -51.81 -61.87 -34.04 A-e -60.06 -69.17 -30.86 B-a -64.55 -68.60 -13.86 B-b -65.23 -70.06 -16.48 B-e -70.21 -79.39 -31.07 C-a -59.44 -68.14 -29.46 C-b -59.74 -68.51 -29.70 C-e -66.92 -78.14 -37.94 D-a -58.67 -67.57 -31.15 D-b -58.62 -67.79 -31.05 D-e -70.54 -81.58 -37.32
According to calculated results, the ∆H, ∆S and ∆G values for all adsorption models are negative. Comparison results indicate that the ∆H, ∆S and ∆G values for all adsorption models in range (‒61.87 to ‒81.58), (‒4.19 to ‒37.94) and (‒51.61 to ‒70.54) Kcal/mol respectively. The enthalpy value of D‒e model (‒81.58 Kcal/mol) is more than other models and the adsorption of Acr in this model is more exothermic than other models. However, the Gibbs free energy (∆G) of the B‒e and D‒e models (‒70.21 and ‒70.54 Kcal/mol respectively) are more than other models and are more spontaneous than other models. In the all models due to adsorbing Acr on the surface of BPNTs, the entropy of system reduces significantly. The reduction of entropy at the C‒ e (‒37.94 cal/mol K) and D‒e (‒37.32 cal/mol K) is more than other studied models. Whereas the reduction of entropy in the A‒a (‒4.19 cal/mol K) is lower than other models. Inspection of calculated results indicate that with doping Ga atom in the C and D models the ∆G values of C‒a and D‒a models reduce from the above orientation in the pristine models. Whereas in the C‒b, C‒e and D‒e models the ∆G values of system increase from these orientation in the pristine model. Consequently, the thermodynamic parameters of system change with the orientation of Acr adsorption on the surface of BPNTs.
The infrared (IR) spectrum of all adsorption models are determined from output of thermodynamic calculation, and the calculated results are presented in the Figure S1 in supplementary data. Comparison the IR spectrum of all adsorption models show that the maximum peak in each spectrum is shown in the frequency 1000 cm‒1 and with doping Ga atom the altitude of this peak decrease significantly from pristine model.
The HOMO and LUMO orbital descriptor
To understand the electrical properties of the Acr adsorption on the surface of the nanotube, the molecular orbitals and their properties such as gap energy were calculated at the above level of theory. The HOMO (highest occupied molecular orbital) and LUMO (lowest unoccupied molecular orbital) are the most important orbitals in a molecule. The eigenvalues of HOMO and LUMO and their gap energy reflect the reactivity, conductivity, and optical properties of the molecule. A molecule having small gap energy is more polarizable and is generally associated with a high chemical reactivity and low kinetic stability. HOMO is an electron donor and LUMO is an acceptor electrons.
prensted in Figure S2 in the supplementary data. Comparison results indicate that the LUMO orbital density at A(e), C(e) and D(e) models are localized around ACr molecule and at the other models this orbital is distributed uniformly around nanotube. While the HOMO orbital density is widespread on the surface of the nanotubes. Therefore, the surface of the nanotubes is a good place to attack electrophilic species.
By using the HOMO and LUMO energies the gap energy (
E
gap
E
LUMO
E
HOMO), Fermi energy(
2
LUMO HOMO FL
E
E
E
), global hardness (2
LUMO HOMO
E
E
) and electro chemicalpotential (
2
LUMO HOMO
E
E
) and chargetransfer parameters ( N
) are calculated
[11‒22] and results are listed in Table 3. Based on calculated results, HOMO and LUMO energies of the A‒a to D‒e models are in range ‒6.78 to ‒7.20 and ‒2.01 to ‒2.59 eV. With doping Ga atom and adsorbing Acr molecule the HOMO and LUMO energy alter slightly from original values. The gap energy for A‒a to D‒e models are in range 4.18 to 4.89 eV.
Table 3. Calculated quantum parameters for adsorption models (see Figure 1)
Parameter A(a) A(b) A(e) B(a) B(b) B(e) C(a) C(b) C(e) D(a) D(b) D(e) ELUMO/ eV -2.36 -2.59 -2.58 -2.35 -2.17 -2.61 -2.22 -2.21 -2.01 -2.25 -2.24 -2.11
EHOMO/ eV -7.20 -6.91 -6.78 -7.20 -7.02 -6.79 -7.12 -7.11 -6.89 -7.15 -7.14 -6.90
Egap 4.84 4.31 4.19 4.84 4.84 4.18 4.90 4.89 4.88 4.90 4.89 4.78
µ -4.78 -4.75 -4.68 -4.77 -4.60 -4.70 -4.67 -4.66 -4.45 -4.70 -4.69 -4.51
ɳ 2.42 2.15 2.09 2.42 2.42 2.09 2.45 2.44 2.44 2.45 2.44 2.39
EFL -4.78 -4.75 -4.68 -4.77 -4.60 -4.70 -4.67 -4.66 -4.45 -4.70 -4.69 -4.51
ΔN 1.97 2.20 2.23 1.97 1.89 2.25 1.90 1.90 1.82 1.91 1.91 1.88
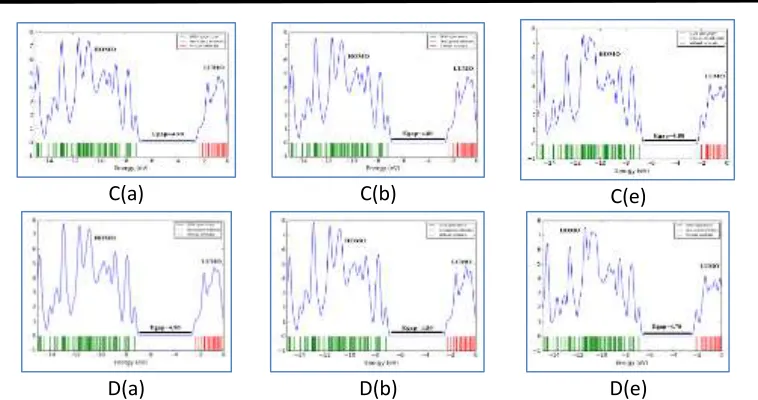
The density of state (DOS) plots for all adsorption models are calculated in interval ‒
15 to 0 eV by using Gaussum software and results are shown in Figure 3.
A(a) A(b) A(e)
C(a) C(b) C(e)
D(a) D(b) D(e)
Figure 3. The DOS plots of acrolein molecule adsorption on BPNTs for adsorption models (see Figure 2)
The calculated DOS results show that in the HOMO and LUMO region it can be seen 11 and 4 maximum peaks. With doping of Ga atom and adsorbing the Acr molecule, the number of maximum peaks in the HOMO and LUMO area has not changed, but the height of the maximum peaks in these two regions has decreased significantly.
It is notable that the gap energy of system with doping Ga atom and adsorbing Acr alter slightly from original state, thus, the adsorption of Acr not change the conductivity and optical properties of the system significantly. The global hardness is the resistance chemical systems towards the deformation of electron cloud under small perturbation encountered during the chemical process.
According to calculated results of Table 3, the global hardness of the A‒a to D‒e adsorption models change from 2.09 to 2.45 eV. With doping Ga atom the global hardness increase slightly from original state and so the activity of system decrease slightly from original state.
The chemical potential and Fermi energy of system alters from ‒4.45 to ‒4.78 eV. Comparison results demonstrate that with
doping Ga atom and Acr adsorbing the stability of system similar global hardness change slightly from original state. The charge transfer parameters of all adsorption models are positive in range 1.88 to 2.25. The positive values of ∆N indicate that in this process the Acr molecule has donor electron effect and increase charge density around nanotube.
Natural bond orbital analysis
The natural bond orbital (NBO) was used to explore the charge transfer and conjugative interaction in the molecular systems, which is an efficient method for studying the intra and intermolecular bonding and interaction among bonds. This method is an effective tool from the chemical interpretation of hyper-conjugative interaction and electron density transfer from the filled lone pair electron toward unoccupied orbitals.
adsorption models except A‒b models are slightly positive and reveal that at all adsorption models the Acr molecule has donor electron effect and this result is in agreement with positive values of ∆N. The positive values of ∆N confirm that that all adsorption models the charge transfer occur from Arc molecule towered nanotube surface. It is noteworthy that the positive charge value of the D(e) model is higher than other models, which indicates the higher charge transfer rate of ACr. As a result, ACr bonding with nanotubes in this model is stronger than other models.
For each donor (i) and acceptor (j) orbital the stabilization energy (E2) associated with the delocalization i→j is determined by using Eq. 4 [15]:
E(2) = qi 𝐹𝑖𝑗 2
𝜀𝑗−𝜀𝑖 (4) where qi is donor orbital occupancy,
i andj
are orbital energies and Fij is the off‒diagonal NBO Fock matrix element. The larger values of E(2) indicate, the strong interaction between donors and acceptors orbital, and the more donating tendency of transfer electrons from donor towered acceptor orbitals and revealing the greater extent of conjugation of the whole system.The results of E(2) values for all adsorption models around doping position are given in Table S6 and are shown in Figure S3 in supplementary data. The strong intramolecular hyper conjugative interaction of donor orbital
to acceptor orbital for A‒a to B‒e models occur in theB54P63 *P62B53
.
The lowestvalue for E(2) value in the A(b) is 0.63 Kcal/mol and the most value for E(2) in the B(e) model is 2.39 Kcal/mol. Which indicates the strongest charge transfer interaction is responsible between the Acr molecule and nanotube in this model. The E(2) value for C‒a to D‒e models occurs inB53/GaP62 *P63B53/Ga . In this model the lowest E(2) value for C(e) and D(e) models is 6.99 and 7.03 Kcal/mol respectively and the most E(2) value for C(a) and D(a) models is 9.09 and 9.17 Kcal/mol respectively. It is notable that with doping Ga atom in all adsorption models the E(2) value increase significantly from original value and so the strongest charge transfer is occurred in them. These facts may be the probable reasons behind the relative stability of the axial and equatorial adsorption Ga atom doped on the outer surface of BPNTs based on energetic data and NBO interpretation.
Molecular electrostatic potential
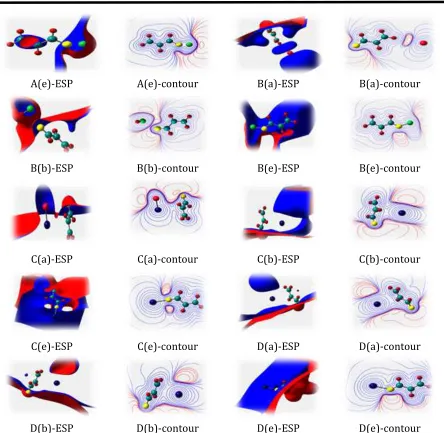
To understand the effect of the Acr adsorption and Ga doped on the charge distribution on the surface of nanotube, we calculate the molecular electrostatic potential (MEP) for all adsorption models. To predict the molecular reactive sites, the MEP for the A‒a to D‒e models is calculated and outcomes are shown in Figure 4.
A(e)-ESP A(e)-contour B(a)-ESP B(a)-contour
B(b)-ESP B(b)-contour B(e)-ESP B(e)-contour
C(a)-ESP C(a)-contour C(b)-ESP C(b)-contour
C(e)-ESP C(e)-contour D(a)-ESP D(a)-contour
D(b)-ESP D(b)-contour D(e)-ESP D(e)-contour
Figure 4. The MEP Plots of acrolein molecule adsorption on the surface of pristine and Ga doped (6, 0) zigzag model of BPNTs for adsorption models (see Figure 2)
The different values of the electrostatic potential at the surface are represented by different colors. Here the blue color represents the positive charges or the nucleophilic regions and the red color represents the negative charges or the electrophilic regions. According to the results in Figure 4, in the A‒a to D‒e models there is a significant electron density, and negative potential, red color, on the surface of nanotube. The maximum positive electrostatic potential occurs around the
increase the electrophilic region around adsorption position.
Atom in molecule method
To further comprehend the electrical properties of Acr adsorption on the surface of BPNTs, from optimized structure the electron densities (ρ) and Laplacian of electron, densities
( ▽ 2ρ) at bond critical point (BCP) are
calculated using AIMALL program [34‒36]. It is
known that the properties ▽2ρ, ρBCP, the potential energy (VBCP), the total electronic energy (HBCP), and the kinetic energy (GBCP) of the bond in critical points are related to the type and strength of the interactions between the attractive atom pairs.
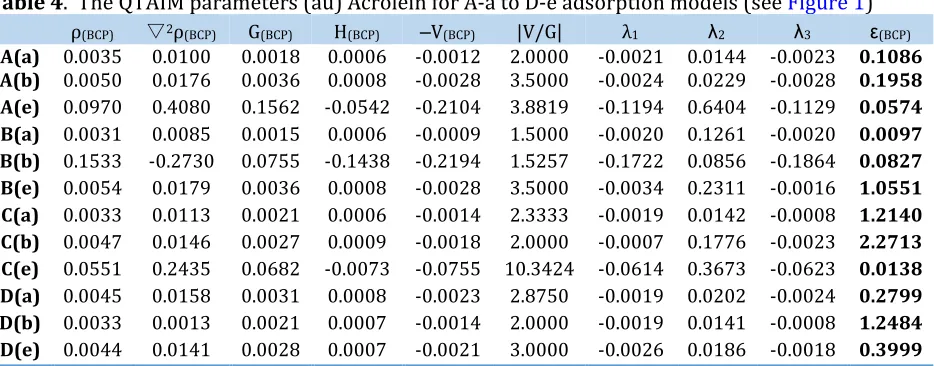
In this study, the ρBCP, ▽2ρ, HBCP, VBCP, and GBCP properties for all the adsorption models were calculated and results are listed in Table 4 and Figure S4 in supplementary data.
Table 4. The QTAIM parameters (au) Acrolein for A-a to D-e adsorption models (see Figure 1) ε(BCP)
λ3
λ2 λ1
|V/G| ‒V(BCP)
H(BCP)
G(BCP)
▽2ρ(BCP)
ρ(BCP) 0.1086 -0.0023 0.0144 -0.0021 2.0000 -0.0012 0.0006 0.0018 0.0100 0.0035 A(a) 0.1958 -0.0028 0.0229 -0.0024 3.5000 -0.0028 0.0008 0.0036 0.0176 0.0050 A(b) 0.0574 -0.1129 0.6404 -0.1194 3.8819 -0.2104 -0.0542 0.1562 0.4080 0.0970 A(e) 0.0097 -0.0020 0.1261 -0.0020 1.5000 -0.0009 0.0006 0.0015 0.0085 0.0031 B(a) 0.0827 -0.1864 0.0856 -0.1722 1.5257 -0.2194 -0.1438 0.0755 -0.2730 0.1533 B(b) 1.0551 -0.0016 0.2311 -0.0034 3.5000 -0.0028 0.0008 0.0036 0.0179 0.0054 B(e) 1.2140 -0.0008 0.0142 -0.0019 2.3333 -0.0014 0.0006 0.0021 0.0113 0.0033 C(a) 2.2713 -0.0023 0.1776 -0.0007 2.0000 -0.0018 0.0009 0.0027 0.0146 0.0047 C(b) 0.0138 -0.0623 0.3673 -0.0614 10.3424 -0.0755 -0.0073 0.0682 0.2435 0.0551 C(e) 0.2799 -0.0024 0.0202 -0.0019 2.8750 -0.0023 0.0008 0.0031 0.0158 0.0045 D(a) 1.2484 -0.0008 0.0141 -0.0019 2.0000 -0.0014 0.0007 0.0021 0.0013 0.0033 D(b) 0.3999 -0.0018 0.0186 -0.0026 3.0000 -0.0021 0.0007 0.0028 0.0141 0.0044 D(e)
Positive ▽2ρ and H values denote the weak covalent interactions (strong electrostatic bond), negative ▽2ρ and H values refer to strong interaction (strong covalent bond), and medium strength (▽2ρ>0 and H<0) is defined as partially covalent bond. On the other hand, the |V/G| ratio is a reliable parameter to classify the different interactions. Based on this parameter, weak interactions are associated with |V/G| <1, medium interactions 1< |V/G| < 2, and strong interactions |V/G|> 2. According to the calculated results (Table 4), the values of ▽ 2ρ and H for B(e) is negative and refers to strong interaction (strong covalent bond). At the A(e) and C(e) models the values of ▽2ρ and H are positive and negative respectively, Which represents a partially covalent bond interaction between ACr and nanotubes. While in other
cases, the positive values of the▽2ρ and H indicate the weak covalent interactions (strong electrostatic bond). The ratio of |V/G| for interaction O atom of ACr molecule with P atom of nanotube [(ACr)O…P (BPNTs)] for the A(e), B(e), C(e) and D(e) models is greater than 2, which indicates strong interactions.
Reduced density gradient (RDG) and NCI index
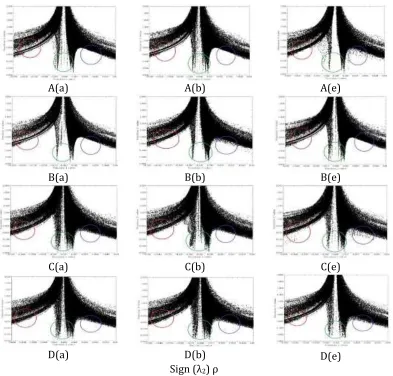
The non-covalent interactions were characterized using the small values of the RDG. These iso-surfaces expand over interacting regions of the complex. The product between electron density ρ(r) and the sign of the second
lowest eigenvalues of electron density hessian matrix (λ2) has been proposed as a tool to distinguish the different types of interactions. The scatter graphs of RDG versus sign(λ2) ρ(r) for all adsorption models are shown in Figure 5.
A(a) A(b) A(e)
B(a) B(b) B(e)
C(a) C(b) C(e)
D(a) D(b) D(e) Sign (λ2) ρ
Figure 5. The RDG Plots of acrolein molecule adsorption on the surface of pristine and Ga doped (6, 0) zigzag model of BPNTs for adsorption models.(see Figure 2)
The X‒axis and Y axis are sign(λ2)ρ(r) and RDG function respectively. The sign(λ2)ρ(r) and NCI‒RDG plots are obtained with Multiwfn program [38]. The sign(λ2)ρ(r) is utilized to distinguish the bonded (λ2<0) interactions from nonbonding (λ2>0) interactions. In the RDG
ACr/BPNTs complex. It clearly observed that in the A(e), B(e), C(e)and D(e) more electron density localized in λ2<0 and λ2=0 regions and the attractive and Van der walls interactions were increased. The results of the RDG scatter confirmed that the interaction and absorption of the ACr from oxygen head on the surface P atom of nanotube is stronger than other positions, and it is recommended that the pristine and Ga doped BPNTs be used as an ACr absorbent.
Conclusions
In this work, the adsorption of the Acr on the surface of the pristine and Ga doped BPNTs was investigated using the density functional theory. The adsorption energy values for all the adsorption models were negative, and exothermic in the thermodynamic approach. When the Acr adsorbed from the O atom on the surface of the nanotube, the dipole moment and the adsorption energy of the complex were more than that of the other sites. The NBO charge of the Acr on the all adsorption models except A‒b, were slightly positive and revealed that at all the adsorption models the Acr molecule had donor electron effect. This result was in agreement with the positive values of the ∆N. The MEP results confirmed that doping Ga atom and adsorbing Acr molecule had a donor electron effect on the surface of the nanotube and increased the electrophilic region around the adsorption position. The calculated results of the thermodynamic parameters, AIM and RDG demonstrated that the interaction and adsorption of the ACr molecule from oxygen head on the P site of the nanotube was stronger than that of the other positions. In addition, it was recommended that the pristine and the Ga doped BPNTs can be used as an ACr absorbent.
Acknowledgment
The author would like to acknowledge the Computational center of Malayer University for providing the necessary facilities to carry out the research.
Supplementary data
Additional supporting information related
to this article can be found, in the online
version, at
References
[1]. Seaman V.Y., Bennett D.H., Cahill T.M.
Environ. Sci. Technol., 2007, 41:6940
[2]. Woodruff T.J., Wells E.M., Holt E.W., Burgin D.E., Axelrad D.A. Env. Health Perspect, 2007, 115:410
[3]. Niosh Pocket Guide to Chemical Hazards, Department of Health and Human Services Centers for Disease Control and Prevention National Institute for Occupational Safety and Health, 2007
[4]. Benz L., Haubrich J., Quiller R.G., Friend C.M. Surface Sci., 2009, 603:1010
[5]. Abraham K., Andres S., Palavinskas R., Berg K., Appel K.E., Lampen A. Mol. Nutr. Food Res., 2011, 55:1277
[6]. Feng Z., Hu W., Hu Y., Tang M. Proc. National
Academy. Sci., 2006, 103:15404
[7]. Gomes R., Meek M.E., Eggleton M. Concise International Chemical Assessment Document,
World Health Organization, Geneva, 2002,
924153043X
[8]. Grafstrom R.C., Dypbukt J.M., Willey J.C., Sundqvist K., Edman C., Atzori L., Harris C.C.
Cancer Res., 1988, 48:1717
[9]. Iijima S. Nature, 1991, 354:56
[10]. Mirzaei M., Giahi M. Physica E., 2010, 42:1667
[13]. Anurag S., Maya S., Neha T. J. Comp. Theo.
Nanosci., 2012, 9:1693
[14]. Rezaei‒Sameti M. Phys. B., 2012, 407:3717 [15]. Rezaei Sameti M., Amirian B. Asian J.
Nanosci. Mat., 2018, 1:262
[16]. Rezaei‒Sameti M. Quantum Matt., 2013, 2:396
[17]. Baei M.T. Monat. Chem. Mon., 2012, 143:881
[18]. Baei M.T., Ahmadi Peyghan A., Moghimi M.
Monat. Chem. Mon., 2012, 143:1627
[19]. Mirzaei M., Meshkinfam M. Solid. State. Sci., 2011, 13:1926
[20]. Rezaei‒Sameti M. Arabian J. Chem., 2015, 8:168
[21]. Esrafili M.D. J. Fullerenes, Nanotubes.Carbon Nanostr., 2015, 23:142
[22]. Ahmadi Peyghan A., Baei M.T., Moghimi M., Hashemian S. J. Clust. Sci., 2013, 24:49
[23]. Beheshtian J., Baei M.T. Surface Sci., 2012, 606:981
[24]. Baei M.T., Varasteh Moradi A., Torabi P., Moghimi M. Monatsh. Für. Chem. Chem.
Monthly., 2012, 143:37
[25]. Baei M.T., Varasteh Moradi A., Moghimi M., Torabi P. Comp. Theo. Chem., 2011, 967:179 [26]. Kanania Y., Baei M. T., Varasteh Moradia A., Soltanic A. Physica E., 2014, 59:66
[27]. Zahra Sayyad‒Alangi S., Baei M.T., Hashemian S. J. Sulfur Chem., 2013, 34:407 [28]. Zahra Sayyad‒Alangi S., Hashemian S., Baei M. T. J. Phosphorus, Sulfur, Silicon Related
Elements., 2014, 189:453
[29]. Soltani A., Ramezani Taghartapeh M., Mighani H., Pahlevani A.A., Mashkoor R. App.
Surface Sci., 2012, 259:637
[30]. Soleymanabadi H., Kamfiroozi M., Ahmadi A. J. Mol. Model., 2012, 18:2343
[31]. Rezaei‒Sameti M., Saki F. Phys. Chem. Res., 2015, 3:265
[32]. Rezaei‒Sameti M., Dadfar E. A. Iranian J.
hys. Res., 2015, 15:41
[33]. Rezaei‒Sameti M., Yaghoobi S. Comp.
Condens Mat., 2015, 3:21
[34]. Bader R.F.W. Acc. Chem. Res., 1985, 18:9 [35]. Biegler‐König F., Schönbohm J. J.
Computational Chem., 2002, 23:1489
[36]. Shahabi M., Raissi H. J. Incl. Phenom.
MAcrocyc. Chem., 2016, 84:99
[37]. Johnson E. R., Keinan S., Mori‒Sanchez P.
J. Am. Chem. Soc., 2010, 132:6498
[38]. Runge E., Gross E. K. U. Phy. Rev. Lett., 1984, 52:997
How to cite this manuscript: Mahdi Rezaei Sameti. A DFT, NBO, RDG, MEP and thermodynamic sudy of acrolein interaction with pristine and Ga‒doped boron phosphide nanotube. Asian Journal of Nanoscience and
Materials, 2019, 2(4), 399-412. DOI: