*Corresponding author: [email protected] 2018 UTHM Publisher. All right reserved.
e-ISSN: 2600-7924/penerbit.uthm.edu.my/ojs/index.php/jst
Deposition and Characterization of Cobalt doped Titanium Dioxide Thin
Films using Sol-gel Method
M. Luqman Harith Abu Mansor
1, Rosniza Hussin
2,3*, Zakiah Kamdi
1,3, Ainun Rahmahwati
Ainuddin
1,3, Siti Aida Ibrahim
2,3, Mohamed Nasrul
Mohamed
Hatta
1,3,
Muhamad Zaini
Yunos
1,31Faculty of Mechanical and Manufacturing Engineering,
Universiti Tun Hussein Onn Malaysia, Parit Raja, Batu Pahat, Johor, Malaysia
2Faculty of Engineering Technology
Universiti Tun Hussein Onn Malaysia, Pagoh Johor Malaysia
3Nano Structure and Surface Modification (NanoSurf) UTHM
Received 30 September 2017; accepted 23March 2018; available online 1 August 2018
1. Introduction
Nowadays nanotechnology becomes more interests for the scientists and academicians as the size is very tiny [1]. Nanomaterials are known to have unique mechanical, thermal, biological, optical and chemical properties, and suitable for versatile industrial applications [1,2]. The thin films has received major research and engineering emphasis with a consistent change of the process for deposition and patterning over the last few decades [3]. The appearing of a material layer with a thickness between fractions of a single and multiple micrometers or thin films are obviously can be found everywhere [4]. The application and the used of thin films such as eyeglasses [5], microelectronics [6], drill bits and cutting tools [7], solar cells [8], mirrors [9], flat screens and windows [4]. Mechanical properties, optical properties, electrical
properties [10] and heat transport are the functional properties that influenced by the microstructure of thin films [4]. Titanium dioxide (TiO2) thin films is commonly studied
as it has to appeal of photocatalytic properties [11]. Photocatalysis [2,12], photovoltaics [13], water purification [14] and thin films transistors [15] are the prospective of applications from TiO2 thin films [16]. Instead of dye-sensitized
solar cells [1] and photoelectrolytic cells [17], TiO2 also being used in water treatment
membranes because of the biocompatible [18] and photocatalytic [19]. Hence, in this study Co-TiO thin films had been synthesized using sol-gel method with spin coating technique on glass substrates and enhancement the structural and optical properties of the thin films.
2. Experimental Detail
Co:TiO2 thin films was prepared using a
sol-gel method where the Titanium butoxide
Abstract: Thin films become more importance and a lot of research and studies have been done toward the improvement and achievement. In this study, the new finding of deposition Cobalt (Co) doped TiO2 thin films
have been prepared by sol-gel method onto a glass substrate at room temperature for enhancement of optical properties. The effect of Co doped TiO2 thin films have been studies. The different concentration of Co was
varied from 1 wt %, 2 wt % and 3 wt % dopant. The deposition of Co doped TiO2 was prepared by using
sol-gel method and spin coating technique on the glass substrate. The obtained films have been annealed at 400
oC, 500 oC, and 600 oC for 2 hours and were investigated. X-ray diffraction (XRD) peaks revealed that the
films exhibit showed that Co:TiO2 films are anatase crystalline structure at orientation (101). The surface
morphologies of the Co:TiO2 thin films were evaluated by Field Emission Scanning Electron Microscopy
(FESEM) and Atomic Force Microscopy (AFM). The calcination temperature and content of Co dopant gave a different size of particle and grain boundary. Root Mean Squared (RMS) roughness values increase by increasing the molar ratio of dopant. While, as the calcination temperature increases, the RMS also increasing. The optical properties were studied by using UV-visible spectroscopy (UV-Vis) with a wavelength range of 300 nm to 1000 nm. The calculated optical band gap decreases with increasing of Co doping.
Keyword: Thin films; TiO2; Co doped TiO2; Sol gel method.
Keyword:Thin films, sol-gel, spin coating, Titanium dioxide, Cobalt, doping.
62 (C16H36O4Ti) as the starting materials was
added with butanol and stirrer for 30 minutes. Then, distilled water (H2O) also being added
into the mixture and stirrer again for 30 minutes. After the solutions have been stirrer for 30 minutes, glacial acetic acid as the stabilizer was added and stirrer for 30 minutes. Lastly, the cobalt hexahydrate was added into the solution to form Co-doped TiO2 solutions.
Then the mixer was stirred using hot plate magnetic stirrer at room temperature for 60 minutes. The sol-gel was aging for 24 hours before being coated into glass substrate. The thin films were deposited onto a glass substrate using sol-gel spin coated method. The Co-doped TiO2 sol-gel on top of the substrate and
the glass substrate will be coated as the coater wheel rotate. The speed of running process for the initial is 1000 rpm for 10 second and then 3000 rpm for 40 seconds for each layer. After five layers, the glass substrate being heated at 100 oC for 10 minutes by using oven. Then,
another five layers on glass substrate to complete 10 layer for each thin films. To make sure the layer completely dry, the glass substrate was heated for 10 minutes at 100oC by
using oven. The remaining solvent from Co:TiO2 thin films was eliminated as the
process of drying and calcination finished. The drying process using the conventional oven for 3 minutes at a temperature of 227 oC. The
calcination process takes place using furnace box at 400 oC, 500 oC and 600 oC for 2 hours
for each sample. From the observation, there is no effect on thin film such as crack or defect before the characterisation. The characterisation of Co:TiO2 thin films was
undergo several steps of analytical instruments which are X-ray Diffraction (XRD), Field Emission Scanning Electron Microscope (FESEM), Atomic Force Microscope (AFM) and UV-Visible Spectroscopy (UV-Vis)
3. Results and Discussion
Structure of TiO2 doped Cobalt thin film
The growth of Co:TiO2 thin films were
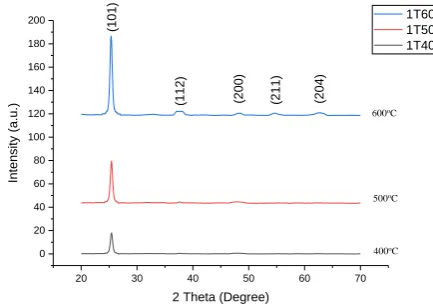
studied using XRD as shown in Fig. 1, Fig. 2, and Error! Reference source not found.. The XRD spectra of the thin films of TiO2 after
annealing at 400 °C, 500 °C and 600 °C for 1 wt%, 2 wt% and 3 wt% of Co respectively. Diffraction pattern observed from XRD
machine matched with reference spectra JCPDS 01-086-1157 (structure: a = 3.78300 Å and c = 9.497Å). XRD analysis confirmed that the TiO2 are present as the Co:TiO2 thin films
have an anatase phase located at peak at 2θ = 25.322 corresponds to anatase (101) crystal plane. Similar with the studies by Boutlala et.al (2016) [20], the (121) peak intensity increases with increasing concentration of cobalt. No peak has been detected corresponding to the brookite and rutile phase of TiO2. However, the
presence of Co was not shown in XRD analysis. Co cannot be detected by XRD analysis due to the small amount of doping. The EDS analysis was used to confirm the existence of Co. Studies by Boutlala [20] and Rengasamy et al [21] also cannot detect the present of Co by using XRD machine but by using Energy Dipersive Spectroscopy (EDS) the Co existed as the wt % is more than 10 wt %. Therefore, Co cannot be seen as the wt % is less than 10 wt % by using XRD or EDS.
20 30 40 50 60 70
0 20 40 60 80 100 120 140 160 180 200 Int en sity (a .u. )
2 Theta (Degree)
1T600 1T500 1T400 (1 01 ) (1 12 ) (2 00 ) (2 11 ) (2 04 )
600oC
500oC
400oC
Fig. 1 XRD patterns of Co:TiO2 thin film (1 wt%
of Co) with different calcination temperature.
20 30 40 50 60 70
0 20 40 60 80 100 120 140 160 180 200 Int en sity (a .u. )
2 Theta (Degree)
2T600 2T500 2T400 (1 01 ) (2 11 ) (2 04 ) (2 00 )
600oC
500oC
400oC
Fig. 2 XRD patterns of Co:TiO2 thin film (2 wt%
63
20 30 40 50 60 70
0 20 40 60 80 100 120 140 160 180
Int
en
sity (a
.u.
)
2 Theta (Degree)
3T600 3T500 3T400
(1
01
)
(2
00
)
(0
04
)
(1
16
)
400oC
500oC
600oC
Fig. 3 XRD patterns of Co:TiO2 thin film (3 wt%
of Co) with different calcination temperature.
Nanostructure analysis
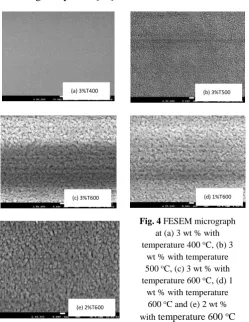
The nanostructure of Co:TiO2 thin film
was studied using FESEM. The images capture with scale of 100 nm and magnification of 50 000x as shown in Error! Reference source not found.. From the Fig. 4, as the calcination temperature increases, the particle and boundary are clearly can be seen. Using SEM micrograph shows the increases of the Co doping concentration, the particle growth bigger and the grain boundary size become smaller similarly with the studies by Rengasamy et.al. [21].
Morphology and roughness
The surface of Co:TiO2 thin films was
characterized by using AFM. Fig. 5 shows the 3D and 2D view of AFM images of surface morphology Co:TiO2 thin films prepared on
glass substrates and indicates a porous and fine structure with small size grains in anatase phase. From the studies by Boutlala et.al (2016) [20] also mentioned that the value of surface root means square (RMS) roughness of the Co:TiO2 thin films shows the presence of
small crystalline grains with spaces, the appearance of grains making the films to have higher surface roughness. Similarly with the study by Rengasamy et al. [21], the summary of the RMS shown in Table 1 shows that the RMS roughness values increases from 1.543 nm to 3.078 nm by increasing the molar ratio of dopant from 0 wt% to 3 wt%. While, as the calcination temperature increasing from 400 oC
to 600 oC, the RMS also increasing from 0.236
nm to 3.078 nm.
Fig. 5 3wt% Co:TiO2 thin films at temperature
600oC
Transmittance of Co:TiO2 thin films
From Table 1, the optical transmittance is improved by increasing the value of Co dopant. The Co:TiO2 thin films result as enhancement
of the optical properties. The calcination temperature also give an influence of the increment of transmittance value as it formed better crystallite. From the research from A Boutlala et.al (2016) [20] with the increases the percentage of transmittance, this can be attributed on the one hand to the structural change and the increase in grain size to increase the values of extinction coefficient K with the rise in temperature.
As the calcination temperature increases, the band gap values also increase. The optical
(a) 3%T400 (b) 3%T500
(c) 3%T600 (d) 1%T600
(e) 2%T600
Fig. 4 FESEM micrograph at (a) 3 wt % with temperature 400 oC, (b) 3
wt % with temperature 500 oC, (c) 3 wt % with
temperature 600 oC, (d) 1
wt % with temperature 600 oC and (e) 2 wt %
64 band gap is determined from the plotting of
(αhν)2 versus photon energy (eV), the
extrapolation intercepting the photon energy axis given the optical band gap (Eg) It varied between 3.32 eV to 3.16 eV. From Table 2, it is easy to notice that the gap value decreases with increasing temperature treatment. At this stage, the annealing temperature contributes to the reorganization of the structure and impurities that come to their sites more easily occupied when it rises and the decrease of band gap energy can be correlated with the grain size, which increases with temperature.
Table 1 Summary of the RMS value of Co:TiO2 thin
films
Table 2 Summary of value of transmittance and band gap
Calcination Temperature
Molar ratio
of Co
dopant
Transmittance Band Gap (eV)
400oC
1% 72 3.32
2% 85 3.30
3% 92 3.28
500oC
1% 70 3.30
2% 75 3.26
3% 83 3.22
600oC
1% 75 3.26
2% 88 3.21
3% 88 3.16
4. Conclusion and Recommendation
As the conclusion the XRD results obtained shows that the TiO2 anatase structure
found but Co cannot be detected using XRD as well as the EDS as the content of Co dopant is little. From the XRD result, it shows that by increasing the calcination temperature the intensity also increases but the intensity decreases as the content of Co dopant increasing. Therefore, the intensity affected by the calcination temperature and content of Co dopant. From the FESEM results, the calcination temperature and content of Co dopant gave a different size of particle and grain
boundary. While the RMS from the analysis by AFM increases with calcination temperature and content of Co dopant increases.
References
[1] Devi, M. and Panigrahi, M.R. “Synthesis and Characterization of Mg Doped TiO2 Thin Film For Solar Cell
Application,” in Int. J. Eng. Appl. Sci., (2015) pp. 1–7.
[2] Khataee, A. and Mansoori, G. A. Nanostructured Titanium Dioxide Materials: Properties, Preparation and Applications.. World Scientific Publishing Co. (2011)
[3] Henini, M. Handbook of Thin-Film Deposition Processes and Techniques, Vol. 31. No. 3 (2000).
[4] Magnfält, D. Fundamental Processes in Thin Film Growth (2014).
[5] Fujishima, A., Rao, T. N. and Tryk, D. A. “Titanium Dioxide Photocatalysis,”
in J. Photochem. Photobiol. C
Photochem. Rev., Vol. 1. No. 1 (2000) pp. 1–21.
[6] Mondal, S. and Kumar, A. “Tunable Dielectric Properties of TiO2 Thin Film
Based MOS Systems for Application in Microelectronics,” Superlattices Microstruct., (2016) pp. 1–10.
[7] Thampi, V. V. A., Bendavid, A. and Subramanian, B. “Nanostructured TiCrN Thin Films by Pulsed Magnetron Sputtering for Cutting Tool Applications,” Ceram. Int., vol. 42, no. 8, (2016) pp. 9940–9948.
[8] Yuan, C., Zhang, L., Liu, W. and Zhu, C. “Rapid Thermal Process to Fabricate Sb2Se3 Thin Film For Solar Cell Application,” Sol. Energy, Vol. 137 (2016) pp. 256–260.
[9] Yamada, Y. Miura, M. Tajima, K. Okada, M. Tazawa, M. and Yoshimura, K. “Optical Indices of Switchable Mirrors based on Mg-Y Alloy Thin Films in the Transparent State,” Thin Solid Films, Vol. 571, No. P3, (2014) pp. 712–714.
[10] Fallis, A. The Materials Science of Thin Films, Vol. 53, No. 9 (2013).
[11] Bensouici, F., Bououdina, M., Dakhel, A. A., Tala-Ighil, R., Tounane, M., Iratni, A., Souier, T., Liu, S., Cai, W., “Optical, Structural and Photocatalysis Calcination
Temperature
Molar ratio of
Co dopant RMS (nm)
400oC 3% 0.236
500oC 3% 1.543
600oC
0% 1.127
1% 2.491
2% 2.345
65 Properties of Cu-doped TiO2 Thin
Films,” Appl. Surf. Sci., Vol. 2 (2016). [12] Qin, H. L. Gu, G. B. and Liu, S.
“Preparation of Nitrogen-doped Titania using Sol-gel Technique and its Photocatalytic Activity,” Mater. Chem. Phys., Vol. 112, No. 2 (2008) pp. 346– 352.
[13] Chen, C.-C. Chang, S. H. Chen, L.-C.,. Cheng, H.-M., Tseng, Z.-L. and Wu C.-G., “Manipulating Multicrystalline Grain Size in CH3NH3PbI3 Thin Films
for Application in Photovoltaics,” Sol. Energy, Vol. 139 (2016) pp. 518–523. [14] Arcadipane, E., Sanz, R., Miritello, M.,
Impellizzeri, G., Grimaldi, M. G., Privitera, V., and Romano L. “TiO2
Nanowires on Ti Thin Film for Water Purification,” Mater. Sci. Semicond. Process., Vol. 42 (2016) pp. 24–27. [15] Liau, L. C.-K. and Lin, Y.-G.
“Fabrication of Assembled ZnO/TiO2
Heterojunction Thin Film Transistors using Solution Processing Technique,” Solid. State. Electron., Vol. 103 (2015) pp. 54–58.
[16] Juma, A., Oja Acik, I., Oluwabi, A.T., Mere, A., Mikli, V., Danilson, M., and Krunks M. “Zirconium Doped TiO2
Thin Films Deposited by Chemical Spray Pyrolysis,” Appl. Surf. Sci., Vol. 387 (2016) pp. 539–545.
[17] Kowalski, J. M. “Ceramic Electrodes for Photoelectrolytic Decomposition of Water,” Vol. 7 (1981).
[18] Roy, P. Berger, S. and Schmuki, P. “TiO2 nanotubes: Synthesis and
applications,” Angew. Chemie - Int. Ed., Vol. 50, No. 13 (2011) pp. 2904–2939. [19] Kim, J., Suh, D., Kim, C., Baek, Y., Lee,
B., Kim, H. J., Lee, J. C., Yoon J. “A High-performance and Fouling Resistant Thin-film Composite Membrane Prepared via Coating TiO2
Nanoparticles by Sol-gel-derived Spray Method for PRO Applications,” Desalination, Vol. 397 (2016) pp. 157– 164.
[20] Boutlala, A. Bourfaa, F. Mahtili, M. and Bouaballou, A. “Deposition of Co-doped TiO2 Thin Films by Sol-gel
Method,” IOP Conf. Ser. Mater. Sci. Eng., Vol. 108 (2016) pp. 12048. [21] Renugadevi, R. Venkatachalam, T.
Narayanasamy, R. and Dinesh Kirupha,
S. “Preparation of Co Doped TiO2 Nano