International Journal of Medical Science and Current Research (IJMSCR) Available online at: www.ijmscr.com
Volume2, Issue 4, Page No: 60-74 July-August 2019
60
ISSN (Online): 2209-2862
PUBMED-National Library of Medicine ID-101739732
Clinical Profile of the Acute Lymphoblastic Leukemia Patients Treated With Modified
BFM 90 and UK All XII Protocols
Dr.Sajad Geelani, Dr.Javaid A Dar, Dr Sona Ullah Shah, Dr.Javid Rasool, Dr.Subuh Parvez Khan, Dr.Syed Mudasir Qadri, Dr Syed Saulat Quadri
Additional Professor, Department of Clinical Hematology, Sher e Kashmir Institute of Medical Sciences, Srinagar, J&K, India MD Internal Medicine, Sher e Kashmir Institute of Medical Sciences, Srinagar ,J&K ,India
Professor, Department of Internal Medicine, Sher e Kashmir Institute of Medical Sciences, Srinagar, J&K, India Professor and Head, Department of Clinical Hematology, Sher e Kashmir Institute of Medical Sciences, Srinagar, J&K ,India
Senior resident, Department of Haematopathology, Sher e Kashmir Institute of Medical Sciences, Srinagar, J&K, India Associate professor, Department of Internal Medicine, Sher e Kashmir Institute of Medical Sciences, Srinagar, J&K, India
Dental Surgeon, Health Services, Kashmir
*Corresponding Author:
Dr.Subuh Parvez Khan
Department of Haematopathology, Sher e Kashmir Institute of Medical Sciences, Srinagar, J&K, India.190011
Type of Publication: Original Research Paper Conflicts of Interest: Nil
ABSTRACT
Background: Acute lymphoblastic leukemia (ALL) is a heterogeneous group of lymphoid neoplasm resulting from the proliferation of malignant lymphoid cells, In adults, the most frequent chromosomal translocation is t(9;22), or the Philadelphia chromosome. This study
was carried to know the phenotype in Acute Lymphoid Leukemia (ALL) in Kashmir valley, to prognosticate the various upfront current treatment protocols study adversities of the protocol used Outcome of the patients treated with different treatment protocols METHODS: This study was conducted at the Sher-i-Kashmir Institute of Medical Sciences, Srinagar in the Department of Clinical Hematology on patients diagnosed as ALL between January 2005 and December 2012. Consecutive patients diagnosed to have ALL were included in the study according to the FAB (French American British) classification.
Patients with Chronic myeloid leukemia transformed to acute lymphoblastic leukemia were excluded. RESULTS: A total of 156 cases were studied and immunophenotyping was done in 132 cases. The most common presentation was fever. Younger patient’s ≤ 18 years of age had higher rates of presentation with fever and lymphadenopathy as compared to adults > 18 years of age and it was statistically significant. A significant association was seen in serum albumin levels with respect to age with younger age groups having lower levels of serum albumin as compared to adults. The most common morphology on bone marrow examination was L1, present in 57.7% of the cases. Younger patients showed predominantly L1 morphology, whereas adults > 18 years of age showed predominantly L2 morphology, again statistically significant. Cytogenetic analysis was performed in 84.6% of the cases with 90.2% 0f the patients had normal cytogenetics. Immunophenotyping was also done in 84.6% of the total cases with B-cell lineage ALL was the commonest in 65.9% of the cases. T-cell ALL was significantly associated with the worse outcome.CR was highest in pediatric Standard risk BFM protocol which was 86.7% at the end of the study.
CONCLUSION: T-cell ALL was associated with a worst outcome as compared to B-cell ALL. UK XII protocol was associated with significantly less complete remission and survival possibly because of the high risk patients who got UK ALL XII protocol.
Keywords: NIL.
INTRODUCTION
Acute lymphoblastic leukaemia (ALL) is a heterogeneous group of lymphoid neoplasm resulting from the proliferation of malignant lymphoid cells. It can arise either from T cell or B-cell lineage, although B- cell leukemia is more common. Patients typically
Pag
e
61
Pag
e
61
Pag
e
61
Pag
e
61
Pag
e
61
Pag
e
61
Pag
e
61
Pag
e
61
Pag
e
61
Pag
e
61
Pag
e
61
Pag
e
61
Pag
e
61
Pag
e
61
Pag
e
61
Pag
e
61
Pag
e
61
Pag
e
61
Pag
e
61
Pag
e
61
Pag
e
61
patients with mature B-cell acute lymphoblastic leukaemia, who are treated with short-term intensive chemotherapy (including high-dose methotrexate, cytarabine, and cyclophosphamide),2 treatment for acute lymphoblastic leukaemia typically consists of a remission- induction phase, an intensification (or consolidation) phase, and continuation therapy to eliminate residual disease. 3The prognosis among Adolescents and young adults (AYA) is intermediate between children, who have a very good prognosis with a 5-year survival rate of 80%, and adults, who have a worse prognosis with an overall survival of about 30-50%.
AIMS AND OBJECTIVES:
1. To know the phenotype in Acute Lymphoid Leukemia (ALL) in Kashmir valley
2. To prognosticate the various upfront current treatment protocols.
3. Adversities of the protocol used
4. Outcome of the patients treated with different treatment protocols
PATIENTS AND METHODS:
This study was conducted at the Sher-i-Kashmir Institute of Medical Sciences, Srinagar in the Department of Clinical Haematology on patients diagnosed as ALL between January 2005 and December 2012.
INCLUSION CRITERIA:
1. Consecutive patients diagnosed to have ALL were included in the study according to the FAB (French American British) classification.
EXCLUSION CRITERIA:
1. Patients with Chronic myeloid leukemia transformed to acute lymphoblastic leukemia.
Patients who received treatment with BFM based chemotherapy or as per UK ALL XII protocol for ALL from January 2005 to December 2012 were studied and were followed till November 2014. The clinical history, baseline investigations and other specific investigations like bone marrow examination and immune-phenotyping was recorded. The data of all patients was analyzed with respect to clinical presentation, morphological and immuno-pathological features and treatment outcomes. Approval by the
Institutional Ethical Committee was obtained for this observational study .Statistical software SPSS (version 16.0) and Microsoft excel were used to carry out the statistical analysis of the data.
RESULTS:
Pag
e
62
Pag
e
62
Pag
e
62
Pag
e
62
Pag
e
62
Pag
e
62
Pag
e
62
Pag
e
62
Pag
e
62
Pag
e
62
Pag
e
62
Pag
e
62
Pag
e
62
Pag
e
62
Pag
e
62
Pag
e
62
Pag
e
62
Pag
e
62
Pag
e
62
Pag
e
62
Pag
e
62
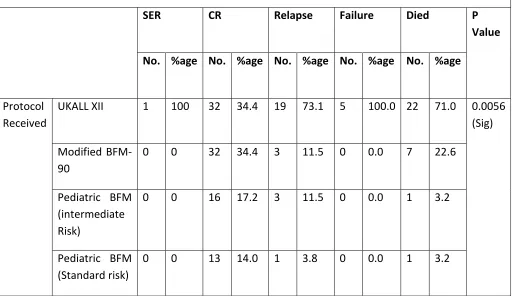
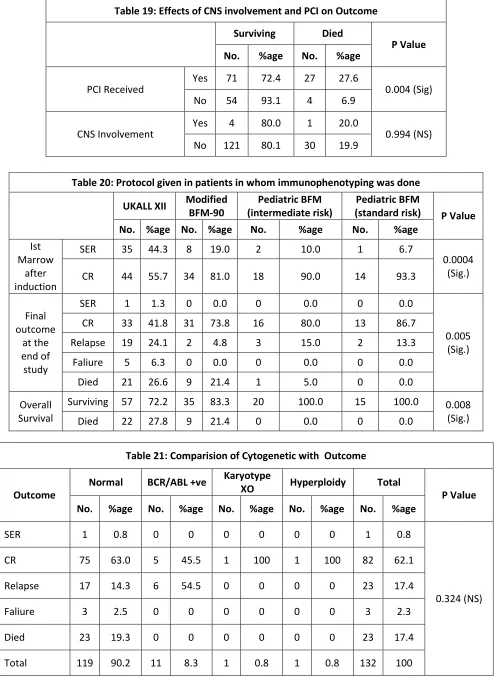
and Failure rates while T-cell ALL was significantly associated with the worse outcome, with higher rates of relapse and failure. The treatment protocol employed had significant bearing on the outcome of the patients (Table 18) : Effects of CNS involvement and PCI on Outcome was studied(Table 19) patients who received prophylactic cranial irradiation had significantly longer survival than those patients who did not receive it. Significant difference was noted in the outcome of patients on different protocols (table 20). Comparision of Cytogenetic with Outcome is shown in Table 21.
DISCUSSION:
Our study included a total of 156 cases, among which immunophenotyping was done in 132 cases. The clinical-pathological characteristics of our 156 ALL patients are more or less similar to the studies in different countries, including India. The male patients (88/156 or 56.4%) were greater than female patients (68/156 or 43.6%) which is more or less similar to a study in Kashmir conducted by Sharma et al. whose study population consisted of 56.5% male patients and 43.5% female patients. The GIMEMA trial conducted by Annino et. al.4 which had 778 ALL patients consisted of 59% males versus 41% females. In our study, B-cell lineage ALL was the commonest in 65.9% of the cases, of which early pre-B-cell constituted 36.4% of the cases. T-cell ALL was seen in 26.5% 0f the cases. Overall 94 of the total cases were cALLa + VE which constituted about 71.2% of the total cases and most of the cALLa +ve Cases were B-cell. Bi-phenotypic leukemia was seen in one patient and Mixed phenotypic leukemia was seen in 9 patients which constituted about 6.8% of the total cases.It was observed that the proportion of T-cell leukemia’s in our population is higher as compared to western data. Many other Indian studies have documented the same observation. In their study conducted by Rajalakeshmy et.al.5 in south India, documented the proportion of T-cell leukemia in about 53% of ALL patients.
They also reported that T-cell ALL was equally common in both sexes, in childhood and adult cases. They also observed L2 morphology in greater than 90% of the cases, however, L2 morphology in our study was present in 37.8% of the cases. A study conducted by Bhargava et.al. 6 who performed pretreatment immunophenotyping in 152 adult and
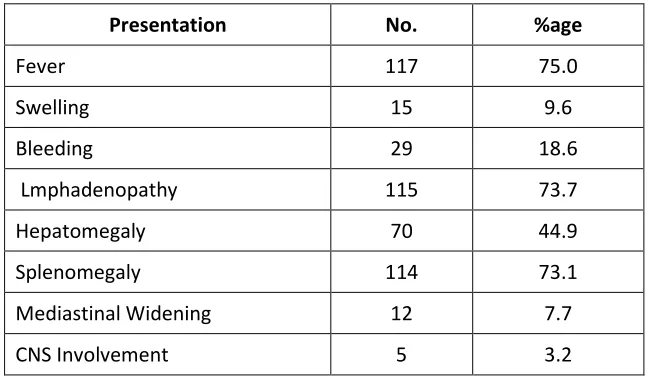
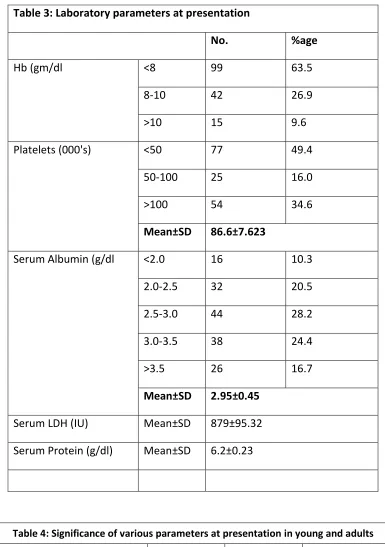
childhood ALL cases using monoclonal antibodies in indirect immunoflourescence and E-rosette procedure, they found T;cell ALL in 37.7%, Null cell ALL in 33.1%, common ALL in 21.5%. T-cell ALL was equally common in adult and pediatric cases. Around 22% of the cases with T-cell ALL had mediastinal masses and 59% of the T;cell ALL were FAB L2 in their series and L2 was overall seen in 50% of the cases.In their study by Kamat et al.7 who studied 124 cases of ALL for immune markers by E-rosette assays and immunoflourescence method. They found T-cell ALL in 41 cases (33%), common ALL in 39 cases (31%), B-cell ALL in 4 cases (0.03%), and Null cell ALL in 40 cases (42%). T- Cell ALL was equally common between childhood and adult ALL cases. The most common presentation in our study was fever, followed closely by lymphadenopathy, splenomegaly and symptoms of anemia and bleeding. CNS involvement was seen in 3.2% 0f the cases.Around 63% of the cases had a haemoglobin level of less than 8gm/dL, while around 49% had a platelet count of less than 50,000/mm3. Serum LDH levels were significantly raised with the mean levels of 879±95.32. The most common bone marrow morphology was L1, followed by L2. l3 morphology was seen in 2.6% and 1.9% of the cases were misdiagnosed as AML which were subsequently diagnosed as ALL on immunophenotyping.
Pag
e
63
Pag
e
63
Pag
e
63
Pag
e
63
Pag
e
63
Pag
e
63
Pag
e
63
Pag
e
63
Pag
e
63
Pag
e
63
Pag
e
63
Pag
e
63
Pag
e
63
Pag
e
63
Pag
e
63
Pag
e
63
Pag
e
63
Pag
e
63
Pag
e
63
Pag
e
63
Pag
e
63
positivity was seen in 7.5% of the cases and there was no statistically significant effect on the outcome of the patients. Westbrook CA et al 10 in a prospective study on 56 patients with adult ALL found Ph +ve chromosome in 23% by cytogenetic methods, whereas by molecular methods BCR-ABL fusion gene was detected in 30% cases.In our study complete remission was achieved in 70.5% of the cases, 16.7% relapsed and 19.9% died at the end of the study. The mean follow up period was 18.1±12.4 months. In their study by Sun XF et. al.11 who studied 36 ALL patients- adolescents and children treated with modified BFM 90 protocol and they found that of 88% achieved complete remission, with an overall response rate of 90.7%. In their study by Shaikh MU et al.12 who did a retrospective study on the outcome of adult patients with acute lymphoblastic leukemia receiving the MRC UKALL XII protocol. They found tha 85 percent patients achieved complete remission.
In their study by Islam N et. al.13 who did a prospective observational study on the outcome of adult acute lymphoblastic leukemia following induction chemotherapy with modified MRC UKALL XII/ECOG E2993 protocol. They found that 40% patients after phase 1 and overall 80% patients after phase 2 induction therapy, achieved morphologic complete remission (CR). No significant effect of BCR-ABL positivity on the outcome was observed. However, BCR-ABL positivity was significantly associated with increasing age groups (75% of the cases were more than 18 years of age ).In our study the most common treatment protocol used in our study was UK ALL XII, which was used in 50.6% of the patients. The next commonest protocol used was Modified BFM 90, which was used in 26.9% of the patients. The UK ALL XII protocol was associated with lesser complete remission and higher mortality when compared with other protocols, which was significant. The difference may be explained due to the fact that most of the patients treated with UK ALL XII protocols were adults, which usually is a bad prognostic factor, and most of the T-cell ALL, which again has a poor prognosis.UK ALL XII protocol was associated with higher rates of relapse and failures. Slow early response was seen maximum in UK ALL XII protocol and minimum in Pediatric BFM (SR), though the number of patients on the later protocol was small as compared to that on UK ALL XII protocol. Complete remission after induction in cases on UK
ALL XII protocol was achieved in 55.7% of the cases which came down to 41.8% of the cases at the end of the study, which was significantly less when compared to other protocols.CR was highest in pediatric Standard risk BFM protocol which was 86.7% at the end of the study. Relapse and mortality and were also higher in patients on UK ALLXII protocol.
The high mortality could be explained by the underlying high risk characteristics of the patients to whom UK ALL XII was given as it tended to be given to adult patients whose age in itself is a high risk factor in case of ALL. Also it tended to be given to T-cell ALL and T-cell phenotype is again a high risk factor in ALL. The BFM based protocols had better rates of complete remission and lesser mortality. There was no significant difference in the complications, like febrile neutropenia, sepsis, bleeding, and tumor lysis syndrome, when compared with other protocols. In their study by Aziz SA et.al.14 who studied 159 cases of ALL, they found CR of 41.4% and an overall survival of 71.4% with UK ALL XII protocol and a CR of CR of 71.1% and an overall survival of 78.9% with Modified BFM 90 protocol. They also found that there was no significant difference in the rate of complications with respect to these protocols. The most common complication seen across all protocols was febrile neutropenia which was seen in about 89% of the cases. Female gender had better outcome and less chances of failure, relapse and death which is consistent with the world literature. In our study, T-cell phenotype was associated with lesser rates of complete remission and higher deaths, while B- cell morphology was associated with higher complete remission and less death rates. Patients who received prophylactic cranial irradiation had significantly higher survival rates than those who had not received it. CNS involvement by the disease had no statistical significance on the survival. Nachman J et al 15 in their study concluded that high risk pediatric ALL patients showed a rapid early response (RER) to induction therapy and are treated with systemic children cancer group modified BFM chemotherapy, Presymptomatic CNS therapy that consisted of either IT MTX plus CRT or intensified IT MTX alone resulted in a similar 5 year event free survival.
CONCLUSION:
Pag
e
64
Pag
e
64
Pag
e
64
Pag
e
64
Pag
e
64
Pag
e
64
Pag
e
64
Pag
e
64
Pag
e
64
Pag
e
64
Pag
e
64
Pag
e
64
Pag
e
64
Pag
e
64
Pag
e
64
Pag
e
64
Pag
e
64
Pag
e
64
Pag
e
64
Pag
e
64
Pag
e
64
associated with a worst outcome as compared to B-cell ALL. UK XII protocol was associated with significantly less complete remission and survival possibly because of the high risk patients who got UK ALL XII protocol. Febrile neutropenia was the most common complication after chemotherapy and occurred in about 90% of the patients. BCR-ABL positivity and other cytogenetic abnormalities were not associated significantly with the difference in outcome. Patients who received prophylactic cranial irradiation had significantly longer survival than those patients who did not receive it.
REFERENCES:
1. Ren R. Mechanisms of BCR-ABL in the pathogenesis of chronic myelogenous leukaemia. Nat Rev Cancer 2005; 5: 172–83. 2. Hong D, Gupta R, Ancli! O, et al. Initiating and
cancer-propagating cells in TEL-AML1-associated childhood leukemia. Science 2008; 319: 336–39.
3. Pui CH, Campana D, Evans WE. Childhood acute lymphoblastic leukaemia: current status and future perspectives. Lancet Oncol2001; 2: 597–607.
4. Annino L, Vegna M L, Camera A, Specchia G, Visani G, Fioritoni G, et al. Treatment of adult acute lymphoblastic leukemia (ALL): long-term follow-up of the GIMEMA ALL 0288 randomized study. Blood. 2002; 99: 863-71. 5. Rajalekshmy K R,Abitha AR,Pramila
R,Gnanasagar T,Shanta V.
Immunophenotyping of ALL in Madras, India. Leukmia Research 1994;18(3):183-190. 6. Bhargava M, Kumar R, Karak A, Kochupillai
V, Arya LS, Mohanakumar T . Immunological subtypes of ALL in north India. Leukmia Research 1988;12(8):673-678.
7. Kamat D M,Gopal R,Advani SH,Nair CN,Kumar A,Saikia T et al. Pattern of subtypes of ALL in India. Leukemia Research; 1985:9(7):927-934
8. Adwani S ,Pai S,Venzon D,Adde M,Kurkure PK, Nair CN et al. ALL in India : An analysis of prognostic factor using a single treatment regimen. Annals of Oncology 10:167-176,1999.
9. Khalil SH,Jackson JM,Pyle RH,Robichand M. Immunophenotyping of acute leukemia at King Faisal Specialist Hosp and Research Centre. Ann Saudi Med. 1995; 15(2):137-9. 10.Westbrook CA, Hooberman AL, Spino C,
Dodge RK, Larson RA, Davey F et al. Clinical signifance of BCR-ABL fusion gene in ALL.Blood 1992;80(12):2983-2990.
11.Sun XF,Zhen ZJ,Liu DG,Xia ZJ, Huang HQ,Zhang L et al.Modified BFM-90 regimen greatly improves treatment outcomes of chinese childhood and adolescent lymphoblastic lymphoma.Zhonghua zhong Lui Za Zhi.2007 Jan;29(1):58-61.
12.Shaikh MU,Ali N,Adil S,Khurshid M . Outcome of adult patients with acute lymphoblastic leukaemia receiving the MRC UKALL XII protocol: a tertiary care centre experience. Hematol Oncol. 1997 Aug;15(3):141-9.
13.Islam N, Rahman MM, Aziz MA, Begum F, Yunus ABM. Outcome of adult acute lymphoblastic leukaemia following induction chemotherapy with modified MRC UKALL XII/ECOG E2993 protocol. Bangladesh Med Res Counc Bull 2012; 38: 43-46.
14.Aziz SA, Sharma SK, Sabah I, Jan MA.Prognostic significance of cell surface phenotype in acute lymphoblastic leukaemia.South Asian J Cancer.2015 Apr-Jun;4(2):91-94.
Pag
e
65
Pag
e
65
Pag
e
65
Pag
e
65
Pag
e
65
Pag
e
65
Pag
e
65
Pag
e
65
Pag
e
65
Pag
e
65
Pag
e
65
Pag
e
65
Pag
e
65
Pag
e
65
Pag
e
65
Pag
e
65
Pag
e
65
Pag
e
65
Pag
e
65
Pag
e
65
Pag
e
65
Table 1: Demographic Characteristics of all patients in Kashmir
Age
Male Female Total
P-Value
No. %age No. %age No. %age
Age (Yr)
≤10 28 31.8 31 45.6 59 37.8
0.502 (NS)
11-20 39 44.3 21 30.9 60 38.5
21-30 11 12.5 6 8.8 17 10.9
31-40 7 8.0 8 11.8 15 9.6
>40 3 3.4 2 2.9 5 3.2
≤18 60 68.2 49 72.1 109 69.9
>18 28 31.8 19 27.9 47 30.1 Age (Yr) Mean±SD 16.7±13.34 15.3±12.23 16.1±12.75
Dwelling
Rural 78 88.6 54 79.4 132 84.6
0.231 (NS)
Urban 10 11.4 14 20.6 24 15.4
Total 88 56.4 68 43.6 156 100
Table no. 2.Various Clinical Presentations in ALL Patients
Presentation No. %age
Fever 117 75.0
Swelling 15 9.6
Bleeding 29 18.6
Lmphadenopathy 115 73.7
Hepatomegaly 70 44.9
Splenomegaly 114 73.1
Mediastinal Widening 12 7.7
Pag
e
66
Pag
e
66
Pag
e
66
Pag
e
66
Pag
e
66
Pag
e
66
Pag
e
66
Pag
e
66
Pag
e
66
Pag
e
66
Pag
e
66
Pag
e
66
Pag
e
66
Pag
e
66
Pag
e
66
Pag
e
66
Pag
e
66
Pag
e
66
Pag
e
66
Pag
e
66
Pag
e
66
Table 4: Significance of various parameters at presentation in young and adults
≤18 >18 P-value
No. %age No. %age
Hb (gm/dl
<8 69 63.3 30 63.8
0.605 (NS) 8-10 31 28.4 11 23.4
>10 9 8.3 6 12.8
Platelets (000's) <50 64 58.7 13 27.7 0.002 (Sig)
Table 3: Laboratory parameters at presentation
No. %age
Hb (gm/dl <8 99 63.5
8-10 42 26.9
>10 15 9.6
Platelets (000's) <50 77 49.4
50-100 25 16.0
>100 54 34.6
Mean±SD 86.6±7.623
Serum Albumin (g/dl <2.0 16 10.3
2.0-2.5 32 20.5
2.5-3.0 44 28.2
3.0-3.5 38 24.4
>3.5 26 16.7
Mean±SD 2.95±0.45
Serum LDH (IU) Mean±SD 879±95.32
Pag
e
67
Pag
e
67
Pag
e
67
Pag
e
67
Pag
e
67
Pag
e
67
Pag
e
67
Pag
e
67
Pag
e
67
Pag
e
67
Pag
e
67
Pag
e
67
Pag
e
67
Pag
e
67
Pag
e
67
Pag
e
67
Pag
e
67
Pag
e
67
Pag
e
67
Pag
e
67
Pag
e
67
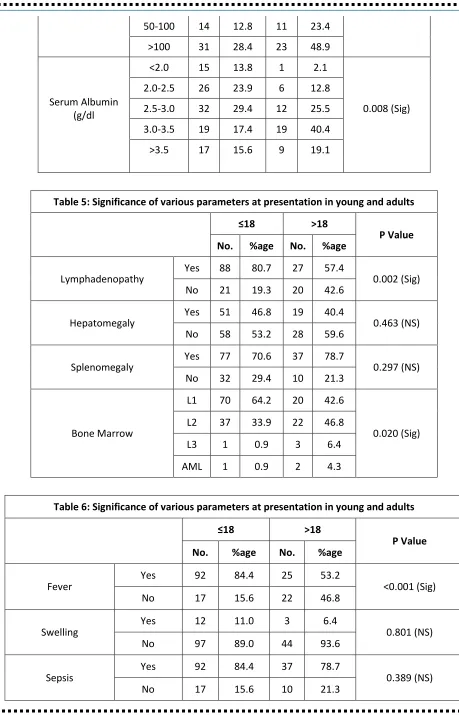
50-100 14 12.8 11 23.4 >100 31 28.4 23 48.9
Serum Albumin (g/dl
<2.0 15 13.8 1 2.1
0.008 (Sig) 2.0-2.5 26 23.9 6 12.8
2.5-3.0 32 29.4 12 25.5 3.0-3.5 19 17.4 19 40.4 >3.5 17 15.6 9 19.1
Table 5: Significance of various parameters at presentation in young and adults
≤18 >18 P Value
No. %age No. %age
Lymphadenopathy Yes 88 80.7 27 57.4 0.002 (Sig) No 21 19.3 20 42.6
Hepatomegaly Yes 51 46.8 19 40.4 0.463 (NS) No 58 53.2 28 59.6
Splenomegaly Yes 77 70.6 37 78.7 0.297 (NS) No 32 29.4 10 21.3
Bone Marrow
L1 70 64.2 20 42.6
0.020 (Sig) L2 37 33.9 22 46.8
L3 1 0.9 3 6.4
AML 1 0.9 2 4.3
Table 6: Significance of various parameters at presentation in young and adults
≤18 >18 P Value
No. %age No. %age
Fever Yes 92 84.4 25 53.2 <0.001 (Sig)
No 17 15.6 22 46.8
Swelling Yes 12 11.0 3 6.4 0.801 (NS)
No 97 89.0 44 93.6
Sepsis Yes 92 84.4 37 78.7 0.389 (NS)
Pag
e
68
Pag
e
68
Pag
e
68
Pag
e
68
Pag
e
68
Pag
e
68
Pag
e
68
Pag
e
68
Pag
e
68
Pag
e
68
Pag
e
68
Pag
e
68
Pag
e
68
Pag
e
68
Pag
e
68
Pag
e
68
Pag
e
68
Pag
e
68
Pag
e
68
Pag
e
68
Pag
e
68
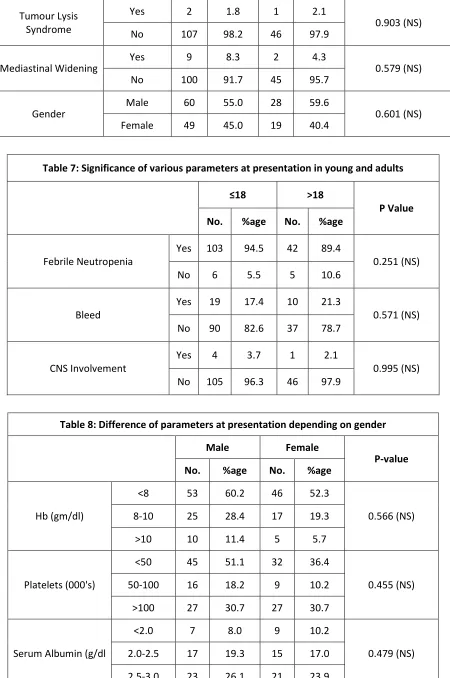
Tumour Lysis Syndrome
Yes 2 1.8 1 2.1
0.903 (NS)
No 107 98.2 46 97.9
Mediastinal Widening Yes 9 8.3 2 4.3 0.579 (NS)
No 100 91.7 45 95.7
Gender Male 60 55.0 28 59.6 0.601 (NS)
Female 49 45.0 19 40.4
Table 7: Significance of various parameters at presentation in young and adults
≤18 >18
P Value No. %age No. %age
Febrile Neutropenia
Yes 103 94.5 42 89.4
0.251 (NS)
No 6 5.5 5 10.6
Bleed
Yes 19 17.4 10 21.3
0.571 (NS) No 90 82.6 37 78.7
CNS Involvement
Yes 4 3.7 1 2.1
0.995 (NS) No 105 96.3 46 97.9
Table 8: Difference of parameters at presentation depending on gender
Male Female P-value
No. %age No. %age
Hb (gm/dl)
<8 53 60.2 46 52.3
0.566 (NS) 8-10 25 28.4 17 19.3
>10 10 11.4 5 5.7
Platelets (000's)
<50 45 51.1 32 36.4
0.455 (NS) 50-100 16 18.2 9 10.2
>100 27 30.7 27 30.7
Serum Albumin (g/dl
<2.0 7 8.0 9 10.2
0.479 (NS) 2.0-2.5 17 19.3 15 17.0
Pag
e
69
Pag
e
69
Pag
e
69
Pag
e
69
Pag
e
69
Pag
e
69
Pag
e
69
Pag
e
69
Pag
e
69
Pag
e
69
Pag
e
69
Pag
e
69
Pag
e
69
Pag
e
69
Pag
e
69
Pag
e
69
Pag
e
69
Pag
e
69
Pag
e
69
Pag
e
69
Pag
e
69
3.0-3.5 23 26.1 15 17.0 >3.5 18 20.5 8 9.1
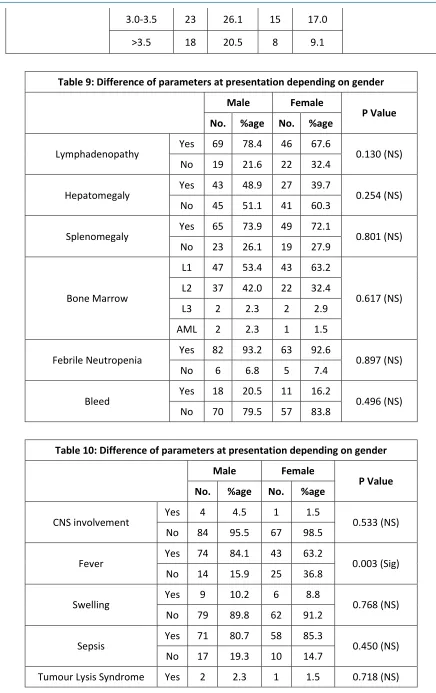
Table 9: Difference of parameters at presentation depending on gender
Male Female P Value
No. %age No. %age
Lymphadenopathy Yes 69 78.4 46 67.6 0.130 (NS) No 19 21.6 22 32.4
Hepatomegaly Yes 43 48.9 27 39.7 0.254 (NS) No 45 51.1 41 60.3
Splenomegaly Yes 65 73.9 49 72.1 0.801 (NS) No 23 26.1 19 27.9
Bone Marrow
L1 47 53.4 43 63.2
0.617 (NS) L2 37 42.0 22 32.4
L3 2 2.3 2 2.9 AML 2 2.3 1 1.5
Febrile Neutropenia Yes 82 93.2 63 92.6 0.897 (NS) No 6 6.8 5 7.4
Bleed Yes 18 20.5 11 16.2 0.496 (NS) No 70 79.5 57 83.8
Table 10: Difference of parameters at presentation depending on gender
Male Female P Value
No. %age No. %age
CNS involvement Yes 4 4.5 1 1.5 0.533 (NS) No 84 95.5 67 98.5
Fever Yes 74 84.1 43 63.2 0.003 (Sig) No 14 15.9 25 36.8
Swelling Yes 9 10.2 6 8.8 0.768 (NS) No 79 89.8 62 91.2
Sepsis Yes 71 80.7 58 85.3 0.450 (NS) No 17 19.3 10 14.7
Pag
e
70
Pag
e
70
Pag
e
70
Pag
e
70
Pag
e
70
Pag
e
70
Pag
e
70
Pag
e
70
Pag
e
70
Pag
e
70
Pag
e
70
Pag
e
70
Pag
e
70
Pag
e
70
Pag
e
70
Pag
e
70
Pag
e
70
Pag
e
70
Pag
e
70
Pag
e
70
Pag
e
70
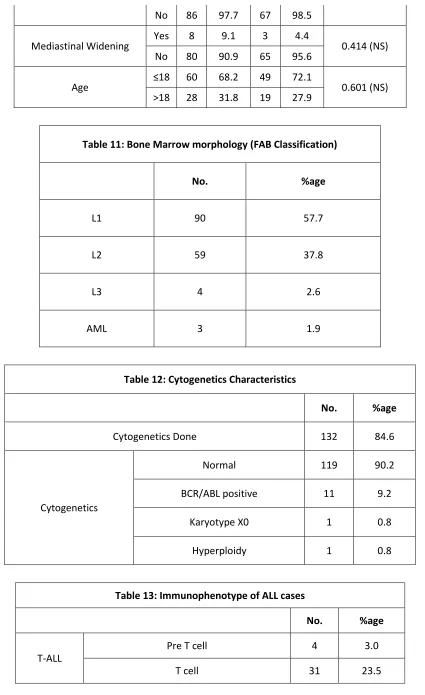
No 86 97.7 67 98.5
Mediastinal Widening Yes 8 9.1 3 4.4 0.414 (NS) No 80 90.9 65 95.6
Age ≤18 60 68.2 49 72.1 0.601 (NS) >18 28 31.8 19 27.9
Table 11: Bone Marrow morphology (FAB Classification)
No. %age
L1 90 57.7
L2 59 37.8
L3 4 2.6
AML 3 1.9
Table 12: Cytogenetics Characteristics
No. %age
Cytogenetics Done 132 84.6
Cytogenetics
Normal 119 90.2
BCR/ABL positive 11 9.2
Karyotype X0 1 0.8
Hyperploidy 1 0.8
Table 13: Immunophenotype of ALL cases
No. %age
T-ALL
Pre T cell 4 3.0
Pag
e
71
Pag
e
71
Pag
e
71
Pag
e
71
Pag
e
71
Pag
e
71
Pag
e
71
Pag
e
71
Pag
e
71
Pag
e
71
Pag
e
71
Pag
e
71
Pag
e
71
Pag
e
71
Pag
e
71
Pag
e
71
Pag
e
71
Pag
e
71
Pag
e
71
Pag
e
71
Pag
e
71
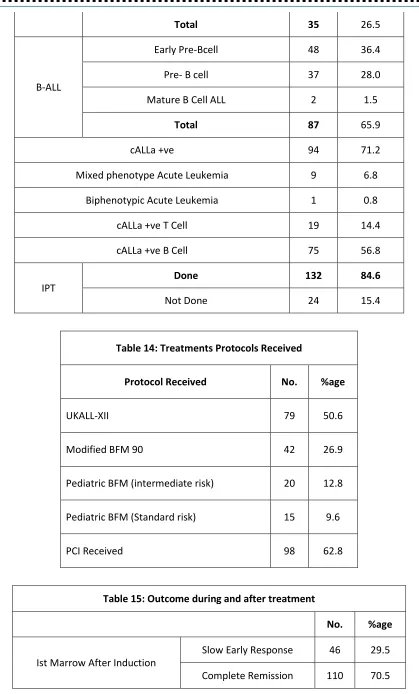
Total 35 26.5
B-ALL
Early Pre-Bcell 48 36.4
Pre- B cell 37 28.0
Mature B Cell ALL 2 1.5
Total 87 65.9
cALLa +ve 94 71.2
Mixed phenotype Acute Leukemia 9 6.8
Biphenotypic Acute Leukemia 1 0.8
cALLa +ve T Cell 19 14.4
cALLa +ve B Cell 75 56.8
IPT
Done 132 84.6
Not Done 24 15.4
Table 14: Treatments Protocols Received
Protocol Received No. %age
UKALL-XII 79 50.6
Modified BFM 90 42 26.9
Pediatric BFM (intermediate risk) 20 12.8
Pediatric BFM (Standard risk) 15 9.6
PCI Received 98 62.8
Table 15: Outcome during and after treatment
No. %age
Ist Marrow After Induction
Pag
e
72
Pag
e
72
Pag
e
72
Pag
e
72
Pag
e
72
Pag
e
72
Pag
e
72
Pag
e
72
Pag
e
72
Pag
e
72
Pag
e
72
Pag
e
72
Pag
e
72
Pag
e
72
Pag
e
72
Pag
e
72
Pag
e
72
Pag
e
72
Pag
e
72
Pag
e
72
Pag
e
72
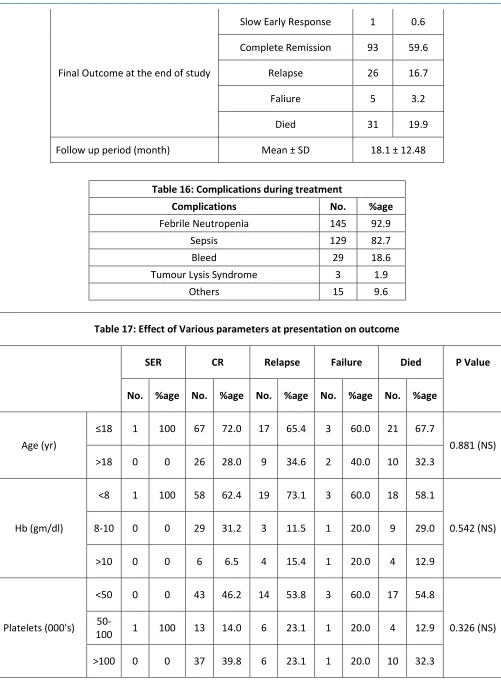
Final Outcome at the end of study
Slow Early Response 1 0.6 Complete Remission 93 59.6
Relapse 26 16.7
Faliure 5 3.2
Died 31 19.9
Follow up period (month) Mean ± SD 18.1 ± 12.48
Table 16: Complications during treatment
Complications No. %age
Febrile Neutropenia 145 92.9
Sepsis 129 82.7
Bleed 29 18.6
Tumour Lysis Syndrome 3 1.9
Others 15 9.6
Table 17: Effect of Various parameters at presentation on outcome
SER CR Relapse Failure Died P Value
No. %age No. %age No. %age No. %age No. %age
Age (yr)
≤18 1 100 67 72.0 17 65.4 3 60.0 21 67.7
0.881 (NS) >18 0 0 26 28.0 9 34.6 2 40.0 10 32.3
Hb (gm/dl)
<8 1 100 58 62.4 19 73.1 3 60.0 18 58.1
0.542 (NS) 8-10 0 0 29 31.2 3 11.5 1 20.0 9 29.0
>10 0 0 6 6.5 4 15.4 1 20.0 4 12.9
Platelets (000's)
<50 0 0 43 46.2 14 53.8 3 60.0 17 54.8
0.326 (NS)
Pag
e
73
Pag
e
73
Pag
e
73
Pag
e
73
Pag
e
73
Pag
e
73
Pag
e
73
Pag
e
73
Pag
e
73
Pag
e
73
Pag
e
73
Pag
e
73
Pag
e
73
Pag
e
73
Pag
e
73
Pag
e
73
Pag
e
73
Pag
e
73
Pag
e
73
Pag
e
73
Pag
e
73
Table 18: Effect of Various parameters at presentation on outcome
SER CR Relapse Failure Died P
Value
No. %age No. %age No. %age No. %age No. %age
Protocol Received
UKALL XII 1 100 32 34.4 19 73.1 5 100.0 22 71.0 0.0056
(Sig)
Modified BFM-90
0 0 32 34.4 3 11.5 0 0.0 7 22.6
Pediatric BFM (intermediate Risk)
0 0 16 17.2 3 11.5 0 0.0 1 3.2
Pediatric BFM (Standard risk)
0 0 13 14.0 1 3.8 0 0.0 1 3.2
Total T cell Yes 1 100 11 13.8 4 19.0 4 100.0 15 57.7 <0.001 (Sig) No 0 0 69 86.3 17 81.0 0 0.0 11 42.3
Total B cell Yes 0 0 69 86.3 11 52.4 0 0.0 7 26.9 <0.001 (Sig) No 1 100 11 13.8 10 47.6 4 100.0 19 73.1
Lymphadenopathy Yes 1 100 67 72.0 17 65.4 4 80.0 26 83.9 0.529 (NS) No 0 0 26 28.0 9 34.6 1 20.0 5 16.1
Hepatomegaly Yes 0 0 40 43.0 10 38.5 5 100.0 15 48.4 0.104 (NS) No 1 100 53 57.0 16 61.5 0 0.0 16 51.6
Pag
e
74
Pag
e
74
Pag
e
74
Pag
e
74
Pag
e
74
Pag
e
74
Pag
e
74
Pag
e
74
Pag
e
74
Pag
e
74
Pag
e
74
Pag
e
74
Pag
e
74
Pag
e
74
Pag
e
74
Pag
e
74
Pag
e
74
Pag
e
74
Pag
e
74
Pag
e
74
Pag
e
74
Table 19: Effects of CNS involvement and PCI on Outcome
Surviving Died P Value
No. %age No. %age
PCI Received Yes 71 72.4 27 27.6 0.004 (Sig) No 54 93.1 4 6.9
CNS Involvement Yes 4 80.0 1 20.0 0.994 (NS) No 121 80.1 30 19.9
Table 20: Protocol given in patients in whom immunophenotyping was done
UKALL XII
Modified BFM-90
Pediatric BFM (intermediate risk)
Pediatric BFM
(standard risk) P Value No. %age No. %age No. %age No. %age
Ist Marrow
after induction
SER 35 44.3 8 19.0 2 10.0 1 6.7
0.0004 (Sig.) CR 44 55.7 34 81.0 18 90.0 14 93.3
Final outcome
at the end of study
SER 1 1.3 0 0.0 0 0.0 0 0.0
0.005 (Sig.) CR 33 41.8 31 73.8 16 80.0 13 86.7
Relapse 19 24.1 2 4.8 3 15.0 2 13.3
Faliure 5 6.3 0 0.0 0 0.0 0 0.0
Died 21 26.6 9 21.4 1 5.0 0 0.0
Overall Survival
Surviving 57 72.2 35 83.3 20 100.0 15 100.0 0.008 (Sig.)
Died 22 27.8 9 21.4 0 0.0 0 0.0
Table 21: Comparision of Cytogenetic with Outcome
Outcome
Normal BCR/ABL +ve Karyotype
XO Hyperploidy Total P Value
No. %age No. %age No. %age No. %age No. %age
SER 1 0.8 0 0 0 0 0 0 1 0.8
0.324 (NS)
CR 75 63.0 5 45.5 1 100 1 100 82 62.1
Relapse 17 14.3 6 54.5 0 0 0 0 23 17.4
Faliure 3 2.5 0 0 0 0 0 0 3 2.3
Died 23 19.3 0 0 0 0 0 0 23 17.4