Open Access
Research
Developmental variations in plasma leptin, leptin soluble receptor
and their molar ratio in healthy infants
Winston WK Koo*
1, Mouhanad Hammami
1and Elaine M Hockman
2Address: 1The Carman and Ann Adams Department of Pediatrics, Wayne State University and Hutzel Hospital, Wayne State University, Detroit,
Michigan, USA and 2Computing and Information Technology, Wayne State University, Detroit, Michigan, USA
Email: Winston WK Koo* - [email protected]; Mouhanad Hammami - [email protected]; Elaine M Hockman - [email protected] * Corresponding author
Abstract
Background: Leptin and its soluble receptor (sOB-R) are important to regulation of body composition but there are no data on the developmental variations in these plasma variables and their relationship with body composition measurements,
Methods: Weight, length, and body composition (bone, fat and lean mass) by dual energy absorptiometry, and plasma variables were measured in healthy infants at 2, 4, 8 and 12 months.
Results: 15 whites and 29 African Americans (21 males and 23 females) with mean birth weight 3357 +/- 45 (SEM) g and gestation of 39.3 +/- 0.17 weeks were studied. The overall Z score for weight, length and weight for length during the study were 0.00 +/- 0.15, -0.08 +/- 0.11 and 0.12 +/ - 0.14 respectively. With increasing age, plasma leptin (1.0 to 18.2, median 5.5 ng/mL) and sOB-R:leptin molar ratio (10.1 to 247.4, median 59.9) were lowered (r = -0.47, p < 0.01; and r = -0.37, p < 0.05 respectively), best predicted by weight Z score and percentage of fat mass, and higher in African American and female. Presence of body composition measurements eliminated the race and gender effect on the plasma variables. Plasma sOB-R (49.5 to 173.9, median 81.3 ng/mL) did not change significantly with age and was correlated and predicted only by body composition measurements.
Conclusion: In healthy growing infants, plasma leptin but not sOB-R decreases with age. Gender, race and anthropometric measurements are additional physiological determinants predictive of plasma leptin and the receptor:ligand ratio. However, body composition is the only variable that can predict plasma leptin and its soluble receptor and the receptor: ligand ratio; and body composition measurements eliminated the race and gender effect on these plasma variables.
Background
Hormonal responses from the gastrointestinal tract, brain and body tissues associated with dietary intake and regu-lation of nutritional status and body weight are well described in adults [1-3]. There are increasing data indi-cating that similar hormonal changes can occur in chil-dren and infants [4-9]. Understanding their relationship
with body composition measurements as indicators of tis-sue accretion might shed light on the physiological basis to integrate nutrition support, growth and tissue accre-tion.
Concentration of circulating leptin, an adipocyte hor-mone, reflects the amount of energy stored in adipose tis-Published: 4 June 2007
Nutrition Journal 2007, 6:11 doi:10.1186/1475-2891-6-11
Received: 7 November 2006 Accepted: 4 June 2007
This article is available from: http://www.nutritionj.com/content/6/1/11
© 2007 Koo et al; licensee BioMed Central Ltd.
sue and is considered a marker of nutritional status [1-3]. Leptin is bound to the soluble leptin receptor (sOB-R) in the circulation, which modulates steady state leptin levels by preventing the hormone from degradation and clear-ance [10], and sOB-R:leptin ratio may be considered a marker of bioavailable leptin.
In the neonate, dramatic changes in circulating leptin and sOB-R with a decrease in leptin by as much as 80% [5-7] and increase in sOB-R by >5 folds [7] are reported. At birth, weight and body mass index are positively corre-lated with plasma leptin concentrations [5,6,8], and one report indicated that sOB-R is inversely related to birth weight [7]. This pattern of changes in leptin and its sOB-R and their relationship with body weight and body mass index presumably reflect the loss of placental contribu-tion for leptin and the physiologic adaptacontribu-tion to lower availability of free leptin, thereby allowing an increase in energy intake to initiate the phase of rapid postnatal growth.
Infancy is the period of most rapid postnatal growth and one report in healthy but relatively malnourished infants with average weight for age Z score of -1.9 at 52 weeks shows a decrease in plasma leptin from birth to 1 year. Changes in plasma sOB-R in infants beyond the immedi-ate newborn period are not well defined. Furthermore, the relationship between body composition measurements as reflection of tissue accretion, with these plasma variables is not known. The aim of this study is to define the devel-opmental variations in circulating leptin and sOB-R in healthy infants specifically the physiologic determinants including age, gender, race, and measures of growth or body composition on these plasma variables.
Methods
This is a cross sectional design with anthropometry, body composition and circulating leptin and sOB-R measure-ments performed on the same day for each subject. All subjects were singleton infants between 37 and 42 weeks gestation with appropriate birth weight for gestation [11] and studied at approximately 2, 4, 8 and 12 months. None of the infants had major malformation or medical or surgical conditions that may affect long term growth.
Weight, length, and head circumference were measured using standard methods [12,13]. Infants were weighed in the nude to the nearest 5 g using an electronic scale (Seca, Toledo, OH) that was calibrated daily. Length was meas-ured in duplicate to the nearest 0.1 cm with the infant in a recumbent position using O'Leary Lengthboard ™ (Ellard Instruments Ltd, Seattle, WA).
Body composition is indicated by total body bone mass as bone mineral content, and fat and lean mass were
deter-mined by fan beam dual energy X-ray absorptiometry (DXA) (QDR 4500A, Hologic Inc, Waltham, MA). Scan acquisition techniques have been reported elsewhere [14]. Each infant was wrapped in cotton blanket for the scan. The use of a diaper with or without light undergarment for the infant was allowed prior to bundling the infant in the cotton blanket. However, all coverings were weighed with an electronic scale and the weight recorded. Scan analysis used software vKHS11 validated by carcass analysis [15,16]. Only scans with no significant movement arti-facts [17] were included in data analysis. In our labora-tory, the precision error [18] from duplicate infant whole body scans for bone, fat and lean mass were 2.6, 7.1 and 2.5% respectively. Bone, fat and lean mass also were expressed as a percent of DXA measured total body mass.
Plasma samples for the measurement of leptin and sOB-R were kept at -70°C until measurement. Plasma leptin and sOB-R were measured using the commercial enzyme linked immunoassay kits from the same manufacturer (Diagnostic Systems Laboratories, Inc., Webster, TX). Recombinant human leptin and human soluble leptin receptor were used as standards and controls in the respec-tive assays. In our laboratory, the coefficient variation of the leptin assay was 9% and for the sOB-R assay was 5%.
Ethical approval for the study was obtained from the Insti-tutional Review Board for Human Investigations at Wayne State University, Detroit, MI. Written informed consent was obtained from the parent of each infant.
Statistical analysis
The absolute values of anthropometric measurements were normalized by expression as Z scores using the age and gender matched normative data from the National Center for Health Statistics [19]. The absolute values for bone, fat and lean mass were transformed to a percentage of total weight. Plasma sOB-R:leptin molar ratio was cal-culated according to the molecular mass of 130 kD for sOB-R and 16 kD for leptin. All statistical analysis included the use of absolute and transformed measure-ments.
weight is the sum of body composition measurements; and both weight and length are predictive of various aspects of body composition [20-22]. Neither age nor gen-der was entered as independent variables with any analy-sis using Z scores since the Z scores were standardized to age and gender.
All values are mean +/- SEM. Statistical tests were per-formed with SPSS Version 13.5 for Windows (SPSS Inc., Chicago, IL) at an adopted significance level of 0.05 and were two-tailed.
Results
There were 44 infants with mean birth weight 3357 +/- 45 g and gestation of 39.3 +/- 0.17 weeks, with 15 whites and 29 African Americans, and 21 (7 white) males and 23 (8 white) females. Anthropometric and DXA measurements and blood collection were performed at 56 +/- 0.8, 112 +/ - 1.0, 240 +/- 1.5, and 366 +/- 2.7 days. Age was positively correlated with all absolute values of anthropometric and DXA measurements (p < 0.01 for all comparisons). Weight for age Z score (WAZ) decreased (r = -0.36, p = 0.02) but recumbent length for age (HAZ) and weight for length (WHZ) Z scores were not significantly different with age. The overall WAZ, HAZ and WHZ were 0.00 +/-0.15 and -0.08 +/- 0.11, and 0.12 +/- 0.14 respectively. Bone mass as a percentage of total mass was increased (r = 0.58, p < 0.01) but the percentages of fat and lean mass did not change significantly with age. The overall percent-ages for bone, fat and lean mass were 2.5 +/- 0.04, 26.3 +/ - 0.92, and 71.2 +/- 0.93 respectively.
Plasma leptin concentrations varied from 1.0 to 18.2 (median 5.5) ng/mL and decreased with age (r = -0.47, p < 0.01) (Fig 1). The relationships between plasma leptin concentrations and anthropometric measurements are shown in Table 1. Z scores were better correlated with plasma leptin than absolute measurements. The relation-ships between plasma leptin concentrations and body composition measurements are shown in Table 2. Body compositions as percentage of total weight were better correlated with plasma leptin than absolute measure-ments. Percent fat mass was positively correlated with plasma leptin although both absolute and percent bone and lean masses were negatively correlated with plasma leptin. African American infants had higher plasma leptin concentrations (p < 0.05) after adjustment for age at study. There was no race and gender interaction effect on plasma leptin. Neither race nor gender affected absolute or percent fat mass.
Plasma sOB-R concentrations varied from 49.5 to 173.9 (median 81.3) ng/mL, did not change significantly with age (Fig 2) and were not significantly correlated with plasma leptin concentrations. There was no correlation
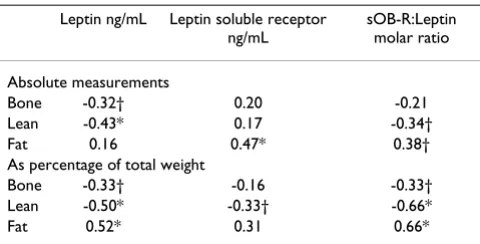
between plasma sOB-R with any anthropometric meas-urements (Table 1). Plasma sOB-R was positively corre-lated with fat mass and negatively correcorre-lated with percent lean mass (Table 2). Plasma sOB-R was not affected by race or gender.
Plasma sOB-R:leptin molar ratio varied from 10.1 to 247.4 (median 59.9) and decreased with age (r = -0.37, p = 0.05). Weight and WAZ were the only anthropometric variables significantly correlated with plasma sOB-R:lep-tin ratio. Whereas, plasma sOB-R:lepsOB-R:lep-tin ratio was posi-tively correlated with absolute and percent fat mass, but negatively correlated with lean mass and percent lean and bone mass. The relationship was stronger based on per-cent lean or fat mass than the absolute mass (Table 2). There was no race or gender effect on plasma sOB-R:leptin ratio.
Weight or WAZ had positive and length or HAZ had neg-ative predictive effect on plasma leptin. Females have higher plasma leptin concentrations and sOB-R:leptin ratio compared to males. None of the physiologic
varia-Table 2: Correlation of plasma leptin, leptin soluble receptor (sOB-R), and sOB-R:Leptin ratio with body composition measurements as absolute values or as percentage of total weight in term infants
Leptin ng/mL Leptin soluble receptor
ng/mL
sOB-R:Leptin molar ratio
Absolute measurements
Bone -0.32† 0.20 -0.21
Lean -0.43* 0.17 -0.34†
Fat 0.16 0.47* 0.38†
As percentage of total weight
Bone -0.33† -0.16 -0.33†
Lean -0.50* -0.33† -0.66*
Fat 0.52* 0.31 0.66*
Pearson correlation with 2 tailed significance: * p ≤ 0.01, † p ≤ 0.05 Table 1: Correlation of plamsa leptin, leptin soluble receptor (sOB-R), and sOB-R:Leptin ratio with anthopometric measurements and their Z scores in term infants
Leptin ng/mL Leptin soluble
receptor ng/mL
sOB-R:Leptin molar ratio
Absolute measurements
Weight -0.29 0.29 -0.14
Length -0.44* 0.23 -0.30
Weight:length ratio 0.45* -0.25 0.30
Z scores
Weight 0.58* 0.22 0.66*
Length 0.05 0.29 0.21
Weight for length 0.57* 0.17 0.62*
bles entered into analysis with anthropometric measure-ments were predictive for plasma soluble receptor concentration (Table 3).
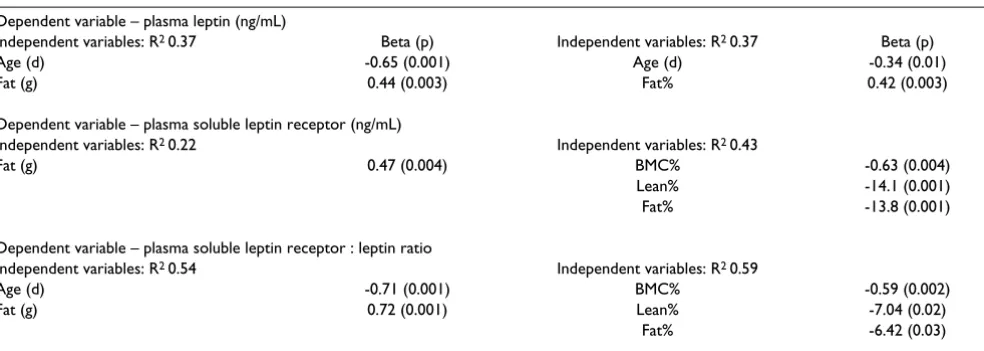
The absolute or percent fat mass was consistently predic-tive of plasma leptin, sOB-R and sOB-R:leptin molar ratio (Table 4). Percentage of body composition component was slightly better than the absolute values in the predic-tion of the plasma variables. Age was predictive of plasma leptin and sOB-R:leptin ratio. Presence of body composi-tion measurements eliminated any race or gender effect on plasma sOB-R and sOB-R:leptin ratio.
Discussion
Study of leptin and its regulation has demonstrated its importance as an integral part of homeostatic mechanism in the regulation of body weight [1-3]. However, it is not known whether this is applicable to all life stages and what changes it may have during growth in which weight gain and tissue accretion rather than maintenance of body weight is the physiologic norm.
To our knowledge, this is the first report of the relation-ship of the circulating leptin and sOB-R concentrations to various physiological variables of growth and body com-position specifically, bone, fat and lean masses, during infancy. Age appears to be a major physiologic determi-nant of plasma leptin concentrations. It is decreased dur-ing infancy in those with normal age and gender specific weight and length Z scores as indicated by our data, and is also decreased in infants with poor postnatal growth dur-ing longitudinal measurement of plasma leptin from cord blood and at 8, 16 and 52 weeks [9]. In this study, the ini-tial measurement of circulating leptin and its soluble receptor at 2 months likely eliminated the confounding factors of placental leptin [23], the initial physiologic adaptation that occurs commonly with other endocrine systems [24], and the apparent transient increase in plasma leptin during the first weeks after birth observed by some [25,26] but not by other [9] investigators. In the two reports on postnatal increase in plasma leptin con-centration, one reported an increase in plasma leptin at 30 days which was significantly correlated with interval weight gain [25] but no data was available beyond 30 days. In the other report, plasma leptin concentration was higher in term versus preterm infants up to 30 days but there was no significant difference between groups at 90 days. The increase in plasma leptin was correlated with weight gain and increase in subcutaneous tissue [26]. Whether this transient increase in plasma leptin is related to changes in leptin transport, metabolism or clearance is not known.
Plasma sampling in our study tend to correspond to ages when milk intake is the exclusive or dominant source of nutrient, namely at 2 and 4 months, and when mixed diet becomes increasingly established at 8 and 12 months respectively. Our preliminary data suggest that usual die-tary intake in healthy and normally grown infants proba-bly does not affect plasma leptin or its soluble receptor concentrations, although determination of the relation-ship between leptin and its receptor with details of nutri-tional intake was not the primary goal of this study and further studies are needed.
Anthropometric and body composition measurements are related to and predictive of plasma leptin. This is con-sistent with other reports that plasma leptin is correlated
Variation in plasma leptin soluble receptor (sOB-R) concen-trations with age in healthy infants
Figure 2
Variation in plasma leptin soluble receptor (sOB-R) concen-trations with age in healthy infants.
0 100 200 300 400
Age (days)
sOB-R
n
g/m
l
180
160
140
120
100
80
60
40
N = 36
N = 36
r
r= 0.15, p = NS= 0.15, p = NS
Variation in plasma leptin concentrations with age in healthy infants
Figure 1
Variation in plasma leptin concentrations with age in healthy infants.
0 100 200 300 400 20
15
10
5
0
Age (days)
Lept
in
ng/
m
l
N = 44
N = 44
r =
with actual [26] or gain [25,26] in body weight, and actual [8,9] and changes [9] in body mass index, and with indi-rect indicators of body fat such as subcutaneous skinfold thicknesses [7,25,26]. Plasma leptin was also found to dis-criminate both the long term and changes in energy status based on skinfold thickness [9].
The consistent relation between the plasma leptin partic-ularly with fat mass is supportive of adipose tissue being the major source of circulating leptin. The negative corre-lation of percent bone mass and percent lean mass with plasma leptin is not surprising since an increase in the proportion of fat mass is generally correlated with decreased proportion of lean and bone mass. However, a direct relation between plasma leptin and other tissue mass may be possible since increasing numbers of non-adipose tissues including skeletal muscle [27], chondro-cyte [28] and human osteoblast [29] are reported to syn-thesize leptin and may have cellular leptin receptor forms
with physiological activity in experimental models. In any case, the exact role of leptin in the changes in skeletal mus-cle and bone in humans remain to be defined.
Our data show elevated sOB-R concentrations throughout infancy. Other investigators have reported persistently ele-vated sOB-R concentrations during early childhood [30]. The positive relation between plasma sOB-R and fat mass may be indicative of the increased membrane-bound lep-tin receptor forms, the source of sOB-R. The negative cor-relation of percent lean mass with plasma sOB-R is consistent with the generally inverse relation between per-cent lean and fat mass.
The correlation between these plasma variables with anthropometric or body composition measurements were better with the use of Z scores rather than absolute meas-urements, with fat percent rather than absolute fat mass, and generally better with body composition, specifically
Table 4: Prediction values of physiologic variables including age, race, gender, and absolute values (left 2 columns) or percent bone, lean and fat mass (right 2 columns) for plasma leptin and leptin soluble receptor concentrations, and leptin soluble receptor:leptin molar ratio
Dependent variable – plasma leptin (ng/mL)
Independent variables: R2 0.37 Beta (p) Independent variables: R2 0.37 Beta (p)
Age (d) -0.65 (0.001) Age (d) -0.34 (0.01)
Fat (g) 0.44 (0.003) Fat% 0.42 (0.003)
Dependent variable – plasma soluble leptin receptor (ng/mL)
Independent variables: R2 0.22 Independent variables: R2 0.43
Fat (g) 0.47 (0.004) BMC% -0.63 (0.004)
Lean% -14.1 (0.001)
Fat% -13.8 (0.001)
Dependent variable – plasma soluble leptin receptor : leptin ratio
Independent variables: R2 0.54 Independent variables: R2 0.59
Age (d) -0.71 (0.001) BMC% -0.59 (0.002)
Fat (g) 0.72 (0.001) Lean% -7.04 (0.02)
Fat% -6.42 (0.03)
Table 3: Prediction values of physiologic variables including age, race, gender, and absolute values (left 2 columns) or age and gender specific Z scores (right 2 columns) of anthropometric measurements for plasma concentrations of leptin and leptin soluble receptor*, and leptin soluble receptor:leptin molar ratio.
Dependent variable – plasma leptin (ng/mL)
Independent variables: R2 0.49 Beta (p) Independent variables: R2 0.46 Beta (p)
Weight (g) 1.87 (0.001) Weight Z score 0.83 (0.001)
Length (cm) -2.17 (0.001) Length Z score -0.44 (0.01)
Gender (Female = 1, male = 0) 0.27 (0.03)
Dependent variable – plasma soluble leptin receptor : leptin molar ratio
Independent variables: R2 0.50 Independent variables: R2 0.44
Age (d) -0.75 (0.001) Weight Z score 0.66 (0.001)
Weight (g) 1.51 (0.001)
Gender (Female = 1, male = 0) 0.39 (0.01)
fat mass, rather than anthropometric measurements. Thus the use of standardized rather than absolute measure-ments of anthropometry and body composition is indi-cated in future studies on the interplay of leptin and its receptor with different nutrition support in growing sub-jects. Furthermore, body composition measurements are probably more sensitive indicators of leptin production and bioactivity.
It is interesting that even with the limited sample size, our findings of higher leptin concentration in African Ameri-can infants independent of fat mass is consistent with the report on adult males and females that non-Hispanic blacks have slightly higher values compared to non-His-panic whites or Mexican Americans [31]. Our data of higher plasma leptin concentration in female infants also are consistent with the presence of sexual dimorphism [9,32]. Furthermore, our data show that race and gender effects were eliminated in the presence of body composi-tion measurements, presumably body composicomposi-tion meas-urements more specifically reflect the source of leptin and its receptors. Our data indicate that variations in plasma sOB-R are independent of race, gender or age but are pre-dicted by body composition measurements.
Complexes of leptin with sOB-R reflect a molecular ratio of 1:1 [33] and reached a median value of >10 as early as 3 days after birth because of a decrease in circulating lep-tin with an accompanied increase in sOB-R [7]. Our data indicated that plasma sOB-R:leptin ratios remained >10 throughout infancy. Limited data indicate the high plasma sOB-R:leptin ratios may persist until 2 to 3 years [30]. It is possible that high circulating concentrations of sOB-R may block leptin function by its competition with the membrane receptor for the ligand, which in turn may be an important stimulus for energy uptake in the rapidly growing infant or in other conditions with a high energy demand. However, the decreasing sOB-R:leptin ratio dur-ing later infancy is presumably associated with increasdur-ing bioavailable leptin, and is consistent with slowing of growth [19] and tissue accretion [20-22].
Our report represents an exploratory step to determine the developmental variations of plasma leptin and its soluble receptor during the period of most rapid postnatal growth when the body weight and tissue accretion triples over a one year period. These data when coupled with the body composition measurements are critical to the design of future studies to determine the interplay of leptin and its receptors with nutrition support and the regulation of growth and tissue accretion.
Conclusion
We conclude that in healthy growing infants, plasma lep-tin and sOB-R:leplep-tin ratio but not sOB-R decreases with
age. Body composition is the only variable that can pre-dict plasma leptin and its soluble receptor and the recep-tor:ligand ratio, and body composition measurements eliminate the race and gender effect on these plasma vari-ables. Based on limited size of subgroups in this study, the race and gender effect on these plasma variables appears to be consistent with that for adults.
Competing interests
The author(s) declare that they have no competing inter-ests.
Authors' contributions
WK participated in design and execution of the study, analysis and interpretation of the data, and completion of the manuscript. MH participated in execution of the study, interpretation of the data, and manuscript writing. EH participated in statistical analysis, interpretation of the data and manuscript writing.
References
1. Janeckova R: The role of leptin in human physiology and patho-physiology. Physiol Res 2001, 50:443-459.
2. Jequier E: Leptin signaling, adiposity, and energy balance. Ann NY Acad Sci 2002, 967:379-388.
3. Wynne K, Stanley S, McGowan B, Bloom S: Appetite control. J Endocrinol 2005, 184:291-318.
4. Ellis KJ, Nicolson M: Leptin levels and body fatness in children: effects of gender, ethnicity, and sexual development. Pediatr Res 1997, 42:484-8.
5. Marchini G, Fried G, Ostlund E, Hagenas L: Plasma leptin in infants: relations to birth weight and weight loss. Pediatrics
1998, 101:429-432.
6. Matsuda J, Yokota I, Iida M, Murakami T, Yamada M, Saijo T, Naito E, Ito M, Shima K, Kuroday Y: Dynamic changes in serum leptin concentrations during the fetal and neonatal periods. Pediatr Res 1999, 45:71-75.
7. Kratzsch J, Schubring C, Stitzel B, Bottner A, Berthold A, Thiery J, Kiess W: Inverse changes in the serum levels of the soluble leptin receptor and leptin in neonates: relations to anthropo-metric data. J Clin Endocrinol Metab 2005, 90:2212-2217. 8. Jaquet D, Leger J, Levy-Marchal C, Oury JF, Czernichow P:
Ontog-eny of leptin in human fetuses and newborns: effect of intra-uterine growth retardation on serum leptin concentrations.
J Clin Endocrinol Metab 1998, 83:1243-1246.
9. Collinson A, Moore S, O'Connell M, Charalambos C, Prentice A:
Developmental changes in leptin as a measure of energy sta-tus in human infants in a natural ecologic setting. Am J Clin Nutr 2005, 81:488-494.
10. Huang L, Wang Z, Li C: Modulation of circulating leptin levels by soluble receptor. J Biol Chem 2001, 276:6343-6349.
11. Oken E, Kleinman KP, Rich-Edwards J, Gillman MW: A nearly con-tinuous measure of birth weight for gestational age using a United States national reference. BMC Pediatr 2003, 3:6. 12. Gordon CC, Chumlea WC, Roche AF: Stature, recumbent
length, and weight. In Anthropometic Standardization Reference Man-ual Edited by: Lohman TG, Roche AF, Martorell R. Champaign, IL: Human Kinetics Books; 1988:3-8.
13. Callaway CW, Chumlea WC, Bouchard C: Circumference. In
Anthropometic Standardization Reference Manual Edited by: Lohman TG, Roche AF, Martorell R. Champaign, IL: Human Kinetics Books; 1988:39-54.
14. Hammami M, Koo WWK, Hockman EM: Technical considera-tions for fan beam dual energy x-ray absorptiometry body composition measurements in pediatric studies. JPEN 2004,
Publish with BioMed Central and every scientist can read your work free of charge "BioMed Central will be the most significant development for disseminating the results of biomedical researc h in our lifetime."
Sir Paul Nurse, Cancer Research UK
Your research papers will be:
available free of charge to the entire biomedical community
peer reviewed and published immediately upon acceptance
cited in PubMed and archived on PubMed Central
yours — you keep the copyright
Submit your manuscript here:
http://www.biomedcentral.com/info/publishing_adv.asp
BioMedcentral 15. Koo WWK, Hammami M, Hockman EM: Use of fan beam dual
energy X-ray absorptiometry to measure body composition of piglets. J Nutr 2002, 132:1380-1383.
16. Chauhan S, Koo WWK, Hammami M, Hockman EM: Fan beam dual energy X-ray absorptiometry body composition measure-ments in piglets. J Amer Coll Nutr 2003, 22:408-414.
17. Koo WWK, Hockman EM, Hammami M: Dual energy X ray absorptiometry measurements in small subjects: conditions affecting clinical measurements. J Amer Coll Nutr 2004,
23:212-219.
18. Gluer CC, Blake G, Lu Y, Blunt BA, Jergas M, Genant HK: Accurate assessment of precision errors: how to measure the repro-ducibility of bone densitometry techniques. Osteoporos Int
1995, 5:262-270.
19. Kuczmarski RJ, Ogden CL, Grummer-Strawn LM, Flegal KM, Mei Z, Wei R, Curtin LR, Roche AF, Johnson CL: 2000 CDC growth charts for the United States: methods and development.
Vital Health Stat 11 2002, 246:1-190.
20. Koo WWK, Bush AJ, Walters J, Carlson SE: Postnatal develop-ment of bone mineral status during infancy. J Amer Coll Nutr
1998, 17:65-70.
21. Koo WWK, Walters JC, Hockman EM: Body composition in human infants at birth and postnatally. J Nutr 2000,
130:2188-2194.
22. Hammami M, Koo WWK, Hockman EM: Body composition of neonates from fan beam dual energy X-ray absorptiometry measurement. JPEN 2003, 27:423-426.
23. Hassink SG, de Lancey E, Sheslow DV, Smith-Kirwin SM, O'Connor DM, Considine RV, Opentanova I, Dostal K, Spear ML, Leef K, Ash M, Spitzer AR, Funanage VL: Placental leptin: an important new growth factor in intrauterine and neonatal development?
Pediatrics 1997, 100:E1.
24. Van Vliet G, Polar M: Thyroid disorders in infancy. In Pediatric Endocrinology Edited by: Lifshitz F. New York, NY: Informa Healthcare USA, Inc; 2007:391-404.
25. Harigaya A, Onigata K, Nako Y, Nagashima K, Morikawa A: Role of serum leptin in the regulation of weight gain in early infancy.
Biol Neonate 1999, 75:234-238.
26. Toprak D, Gokalp AS, Hatun S, Zengin E, Arisov AE, Yumuk Z:
Serum leptin levels of premature and full-term newborns in early infancy: metabolic catch-up of premature babies. Turk J Pediatr 2004, 46:232-238.
27. Wang J, Liu R, Hawkins M, Barzilai N, Rossetti L: A nutrient-sensing pathway regulates leptin gene expression in muscle and fat.
Nature 1998, 393:684-688.
28. Kishida Y, Hirao M, Tamai N, Nampei A, Fujimoto T, Nakase T, Shimizu N, Yoshikawa H, Myoui A: Leptin regulates chondrocyte differentiation and matrix maturation during endochondral ossification. Bone 2005, 37:607-621.
29. Reseland JE, Syversen U, Bakke I, Ovigstad G, Eide LG, Hiertner O, Gordeladze JO, Drevon CA: Leptin is expressed in and secreted from primary cultures of human osteoblasts and promotes bone mineralization. J Bone Miner Res 2001, 16:1426-1433. 30. Kratzsch J, Lammert A, Bottner A, Seidel B, Mueller G, Thiery J,
Hebebrand J, Kiess W: Circulating soluble leptin receptor and free leptin index during childhood, puberty, and adoles-cence. J Clin Endocrinol Metab 2002, 87:4587-4594.
31. Ruhl CE, Everhart JE: Leptin concentrations in the United States: relations with demographic and anthropometric measures. Am J Clin Nutr 2001, 74:277-278.
32. Vatten LJ, Nilsen ST, Odegard RA, Romundstad PR, Austgulen R:
Insulin-like growth factor I and leptin in umbilical cord plasma and infant birth size at term. Pediatrics 2002,
109:1131-1135.