©2012 JNAS Journal-2012-1-1/17-24 ISSN 0000-0000 ©2012 JNAS
An Impact Time Motion Study In The Automation Process
Abdul Talib Bon* and Aliza Ariffin
Faculty of Technology Management and Business Universiti Tun Hussein Onn Malaysia. Johor, MALAYSIA
Corresponding author Email : [email protected]
ABSTRACT: The purpose of this research is to improve production capabilities for Small Medium Enterprise (SME) industry.Research focused on SME,which produce sauce.This research used Time and Motion technique to improve work process at SME,and the research objectives towards accomplished this study is to identify problems in the production work process and improved it in terms of production time, number of process and production layout by proposing an efficient work process to SME.This research used systematic observation; process chart and stopwatch time study as research methodology.Stat Fit and Pro Model Software are used for data testing and develop new work process. The improvement of work process was executed by eliminating and combining of work process,which reduces production time, number of process and space utilization.
Keywords:Production Time, Production Layout, Time and Motion Study, Work Process
INTRODUCTION
Background of Study
Small Medium Enterprise or SME Industry consists of small numbers of employees and annual turnover. There can categorize into three criteria – primary agriculture, manufacturing and services.One of the SME Industry was SME that produces sauce.The small of its enterprise caused difficult for them to competing with other firmed companies such as Jalen, Kimball, Maggie and Life.Thus, this research takes initiative to used Time and Motion technique to improve the work process in order to permit them to compete with international rivalry.The Time and Motion study will examine the work process and eliminate nonproductive process, which can reduce number of process, space utilization and production and operation time.Time is important in production industry because according Fred (1992) time is money and time tells us exactly how much money was used. Besides that, this research was conducted based on Small Medium Industry Development (SMIDP) strategies and encouragement.
Problem Statement
SME use semi automatic machines in producing their products, where most of their work process was done manually by their workers. Sometimes, the production takes extra time in producing their products. Moreover, the production department does not have any fixed or standard time for each process. They just decide and estimate the time for each process. Because of that, they often take longer than the time estimated. Thus, it might be difficult for them to increase productivity and competes with other rivals.
Research Question
The research question that emerged on this research is:
18
Objective of Study
The objective towards accomplishing the study are :
Using the time and motion study to identify problems in the production work process.
Improving the work process in terms of production time, number of process and production layout by proposing the new work process to SME.
Scope of Study
The scopes of this research are:
This study concentrates on Small Medium Enterprise (SME) Industry, SME, which is the company produced SME sauce.
The scope of study is the work process in producing sauce that contains 5kg for each bottle.
The research is focused on time and the flow of work process in production department from the start until it produces finish products, which it will concentrate on production time and number of work process.
The data that needs to be carried out in this study is flow chart of the work process, the details for each process, the required time for specific process, number of employees, distance and number of products that they produced in specific time.
Benefits from this study
This study was chosen because it will give many benefits to production and operation management. Among the advantages for SME in producing their sauce are:
Eliminate the Unnecessary
Knowing what is unnecessary is important as knowing what is the most important in production and operation. Based on those, we can eliminate insignificant tasks and nonproductive activities.Preoccupation, layout of production, errors, too much motion and travel during performing the tasks are examples of nonproductive activities and it wasted the production time.
Change the Sequence of Operations
Changing the sequence of operations based on the process chart and flow diagram to affect a smooth flow of work through plant, which can reduce production time. Besides that, changing the sequence of operation also involve layout of production, where it can reduce space utilization.
Simplify the Necessary Operations
Simplify the necessary operations to make the job easier by analyzing the process in order to improve it through elimination, combine or rearrange the sequence and layout of operations. By simplifying the operations, it can also effect for the production time.
Literature Review Motion Study
According to Ralpha M. Barnes (2001) Frank and Lillian M. Gilbreth are known as the parents of motion study. Gilbreth begin investigation to find the “best way” of performing a given task trough analyzing the motions used by his workmen and he easily saw how to make improvements. He also possessed for analyzing work motion situations to enhance their ability for shorter or less fatiguing motions to improve the work environment.The research included the elimination of all useless motions and the reduction of those remaining motions.The elimination of this unwanted waste known as work simplification. According Fred (1992), Elton Mayo started their research known as the human relations movement and he discovered that people work better when their attitude is better. He undertook a research project to study what factors affected productivity in the Hawthrone plant. Their studied took place between 1924 and 1933.
Time Study
19
number of breaks and work hours. The results were fantastic which it reduced time, saving numbers of workers and budgeting for every year.
Techniques of Motion and Time Study
Motion study has the greatest potential for savings. We can by eliminating the task or combining the task with some task. We can rearrange the elements of work to reduce the work content and we can simplify the operation by moving part. Thus, among the techniques for motion study are :
Process charts Flow diagrams Operation charts Flow process charts Multiple activity charts
Gilbreths used flow diagrams to show movement of product around an entire plant because they gave an accurate geographical picture of the entire process. They also develop methods study techniques such as cyclograph, chronocyclographs, movie cameras, etc. The techniques of time study start with the last motion technique and it shows the close relationship between motion study and time study. The techniques of time study are :
Stopwatch time study Expert opinion standards Predetermined time standards Work sampling time standards
Frederick W. Taylor used a stopwatch and a clipboard to record the time and findings of his study (Foster, 2003). Motion and Time study technique can be used widely for variety of research. For example, Ann Hendrich, Marilyn Chow, Boguslaw A. Skierczynski, Zhenqiang Lu (2008) used this techniques to study spend time of nurse at hospital. L. Aharonson Daniel (1996) used time studies in A&E department. While, Jeffrey S. Smith (2003) survey that many production and manufacturing used simulation as alternative way to develop new effective system.
Relationship and Utilization of Motion and Time Study
Motion and time study helps management determine how much is produced by workers in a specific period of time, therefore making it easier to predict work schedules and output. Motion and Time Study is a scientific method designed by two different people for the same purpose, to increase productivity and reduce time. The two methods evaluate work and try to find ways to improve processes.Frank B. Gilbreth invented motion study designed to determine the best way to complete a job. Frederick W. Taylor designed Time Study; it measures how long it takes a worker to complete a task. Time and Motion Study has become a necessary tool for businesses to be successful today. Time and Motion Study is very important in production control. Now, Offices, Banks, Department Stores, and Hospitals use Motion and Time Study.Offices use it to measure and simplify work in order to reduce costs. Banks use it to help team members reach their sales goals (Foster, 2003).
Research Methodology Methodology Framework
There are several methods that will be use to achieve research objectives.After the literature review, observation and collecting data is needed. The complete field data collection will be tested before it will be used for data analysis. The problems and non productive in the work process can be identified based on the data collection and their analysis. Then, the result from the data testing will be determined whether the result can be used or not and if there are any incomplete data, the data collection will be executed again until it fulfills the objective requirement. After all the data and analysis are complete, proposal and opinion will be issued to SME
Research Design
20
Variables
The variables in this study can be classified into two types, which are independent (time and motion technique and dependent variable (an impact in the work process for producing sauce).This research used time and motion technique to study on improving the work process. Meaning, the increasing of work process efficiency is depending on the time and motion technique.
Basic Procedure for Research
There are four steps to complete this study. There are given below according to their sequence : Select: select the process or job to be studied.
Record: observe and record all the relevant facts related to the work process. Examine: examine each recorded fact critically
Develop: develop the most efficient work process.
Data Collection
This research requires to collect data that are related to the time during the work process occurs, the movement or distance for each process and number of products that they can produces in specific time, which was collect based on several methods :
Systematic Observation Stopwatch Time Study Process Chart
Systematic Observation
Systematic observation means researcher are required to observe the whole work process in that industry, then select and focusing on which process or job that want to study. Based on the observation, is needs to record everything happens in each process from the start to finish the work process.
Stopwatch Time Study
Stopwatch time study is the work measurement to determine the baseline for future improvement. It is also used to analyze a specific process by qualified workers in an effort to find the most efficient ways in terms of time. Moreover, this method measures the time necessary for a work process to be completed using the best ways. The time was measured using snapback stopwatch equipment because it is easier and faster in data recording. Moreover, this type of stopwatch is suitable for this research because it can develop accurate data. This allows the element times to be entered directly on the time study sheet without the need for subtractions.
Process Chart
Process chart is used to show facts as handling, inspection, operations, storage and delays that occur in the work process, where it was happened when the process moves from one process to another process until it finished. Each fact can be represented by symbols, where it is used to describe the process steps.
Data Analysis
After all data was collected, the next step is analyzing the data thoroughly for each work process. Analyzing data based on systematic observation and the process chart, which recorded all the relevant facts about the work process. Examine each recorded fact critically using chart and graph that was produced by Stat Fit and ProModel software. Then, we can detect which part are nonproductive and take a long time in the work process.
Introduction to Pro Model software
21
Data Analysis and Outcomes Data Collection
Data collection is done to determine the data required for building the process design. The data collected can explain how the process operates, when, where and how the activities takes place. The data was included : flow chart for the process
the detail operation for each process production time
layout
the motion from one process to another process
Work Process
Based on systematic observation, we know that there are seven main work processes in producing chili sauce. Each work process included minor process. The process started with cleaning the raw material, mixture, cooking, filling, labelling and the end process is packaging the sauce into four bottles for each.
Work Process Operations
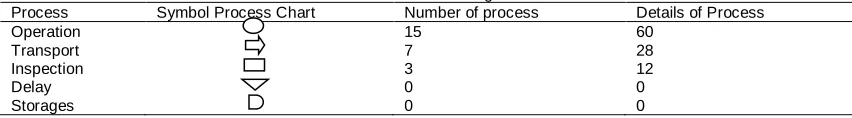
Overall process takes as much as twenty five processes and each process can be summarized as operation, transport, inspection, delay or storages. Table 1 shows the numbers and percentages of each process. Numbers of operation in producing chili sauce is fifteen processes or 60% from the entire processes.Among the operations process are cleaning the raw material, blend, mixture, cooking and packaging. While, transport process consist of seven processes or 28% from the entire processes that involve transportation of raw material from one process to another processes, such as transport the raw material from blender machine to cooking machine.
Table 1. The Numbers and Percentages of Each Process
Process Symbol Process Chart Number of process Details of Process
Operation 15 60
Transport 7 28
Inspection 3 12
Delay 0 0
Storages 0 0
Besides that, this process also included three part of inspection, which is performed during the cooking and packaging operations. These processes did not have delay and storages process because it is a continuous process, where the whole processes takes at least four hours. These analyses are important for future improvement because it can be as a baseline in developing the new work process.
Production Time
Production department is the functional area responsible for turning inputs into finished outputs through a series of production processes. There are seven workers in production department and they produce four tons chili sauce per process into 800 bottles, each bottle contains 5kg chili sauce. In production department, the production time was taken during collecting data. The purpose is to study the required time in order to accomplish the whole process, from the start until it finish. The data was taken by using stopwatch time study and recorded in the Process Chart form. The data collected in the previous stage are required for the future improvements. From the observation, we can detect that the work must be carried out smoothly based on its process and production layout for making work more efficient.
22
between the same processes occur because of the differences of filling tank location. Filling 2 was takes shorter time rather than filling 1 because it is nearly to the labeling table. The differences between these locations cause wasted time in production.
Statistical Analysis of Data
In a simulation model, raw data that has been collected must be analyzed and interpreted, so the system operation is correctly represented in the model. Prior to developing a representation of model, the data should be analyzed to ascertain their suitability for use in the simulation model. Irrelevant or insignificant data need to discard. Data characteristics should be determined by using data analysis software such as Stat::Fit.
Stat: Fit Software
Besides that, the data were also tested with Kolmogorov – Smirnov as normality test to decide whether the data will be accepted or rejected. If the value greater than 0.05, means the data will suitable to run the simulation. Table 2 shows the data testing for each process using Stat::Fit.
Table 2. The Data Testing for Each Process
Process Distribution Rank Acceptance
Cooking Exponential 98.7 Do not reject
To steam area Lognormal 100 Do not reject
Steam the material Triangular 86.5 Do not reject To filling tank 1 Exponential 100 Do not reject
To filling tank 2 Lognormal 100 Do not reject
To labeling (F1) Triangular 100 Do not reject
To labeling (F2) Lognormal 100 Do not reject
Actual Production Layout
An effective layout facilitates the flow of materials, people and information within and between areas. Actual production layout takes 54m² space utilization and the production layout must be analyzed because layout is one of the key that determine the long-run efficiency of work process. Based on observation and data collection, there are find that layout is one of the factors that contributes to the delay in production. Based on current production layout, we can see that the layout lacks in the arrangement of machine and equipments especially at filling tank 1 and filling tank 2, where it involves packaging processing. The arrangement of packaging equipments is not suitable because it utilizes more space in the production. In addition, the length of distance will cause utilization of a lot of times. Thus, as a consequence, these situations caused the excessive in the production time in producing the products.
Discussion And Conclusion Recommendation to Enterprise
It can be conclude that the problem occurs in the work process are related to production time, where it takes extra time in producing its products and from the analysis, we know that the problems may occur in the packaging activities because of the arrangement of its filling tank machine. Thus, the fact that related in this identified problems are :
Number of process Production time Production layout
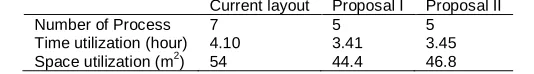
From the observation, data collection and data analysis, then, researcher develops the actual simulation to identify the problems. Then, based on the current model, researcher proposes two new models that included the new work process which combines some process and changes the arrangement of equipments in production department to reduce the total production time. The new process was simulated to view the flow of work process. The researcher develops two new work processes in order to make comparisons which obtain the best work process at the production department. These new work processes will reduce number of process, total production time and space utilization. The comparison between the current work process and new work process explained in Table 3.
Table 3. The comparison between the current work process and new work process Current layout Proposal I Proposal II
Number of Process 7 5 5
Time utilization (hour) 4.10 3.41 3.45
23
Number of Process
By motion study, it can be used to make improvement in the work process through changes, combining or eliminating some unnecessary processes. According to Frank and Lillian M. Gibreth, the goal of motion study is to search the best way of doing jobs. Figure 1 shows the flow chart for the new work process. Based on the chart, the number of work process was decreased two processes because it was the process of combining the mixture and cooking activities. Other combinations are between labeling and packaging activities.
Production Time
Based on time study using stopwatch, it helps to uncover non-value added areas of waste, inconsistency and non-standardization that exist in the production department. Time studies uncover ways to make work easier and to produces products more quickly rather than the previous processes. Table 5.1 indicates that the current work process takes extra 10 minutes. While, the improvement for the work process was decrease the total time to 3.41 hours for Proposal 1 and 3.45 hours for Proposal 2. The time decrement was executed by eliminating the wasted and ineffective time from the current work process, which the new improvement success to achieve production department goals and objectives.
Layout
An effective layout facilitates the flow of materials, people and utilizes the minimal area. An effective layout can also help and support an enterprise to achieve some improvement. A good layout results in a streamlined flow with minimal movement thus minimizing material handling. The new work process can benefit from a layout analysis, while the simulation helps to identify inefficient flow patterns and to create better layouts to economize the flow of resources. The changes of equipment arrangement will help to solve the current work process problem. The machine and equipments are arranged according to the sequence of operations because it is a continuous work process. Table 5.1 shows the proposed layout to the enterprise with the decrement of 17.78% and 13.33% space utilization.
Recommendation for Future Research
There are several affairs that must be attended during collecting data. The data collections are the important part for analyzing and obtain accurate outcomes. Among the recommendations are :
All the machines or equipments that are found in the production layout needs to measure their dimension in order to develop accurate actual layout.
All matters that are related to distance between processes needs to record to obtain useful comparison. Collection of operating time must be recorded in more systematically to prevent error or mistake during
data analysis.
Besides that, for future and advanced research, researcher recommends that this research will execute with more details towards all research parameters. Researcher also suggests that the research performed in other industry with a wide scope, which is the other researcher can calculate the cost of the work process in order to improve it because time is very important in production. Moreover, the quality of product can also be one of the parameter in future research.
CONCLUSION
From the discussion of the three parameters, it can be concluded that this process can be improved based on the three parameters that cause the problems.With combination of work process and time measurement and the changes of production layout, it will improve the current work process. These modifications are made by eliminating the wasted time and reduction of the work contents. From the comparison between current and new work process in table 5.1, it indicates that the best alternative towards this problem by choosing proposal 1. These improvements was successful to achieve the project goals and objectives, which the improvements was included the processes, production layout, economy in human effort and the reduction of unnecessary fatigue.
REFERENCES
24
B. Kumar 1999.Industrial Engineering. Khanna Publishers, Delhi Brian Price 1989. Frank and Lillian Gibreth and the Manufacture and Marketing of Motion Study, 1908 – 1924.
Business and Economic History, Second Series, Volume Eighteen, 1989 Business History Conference ISSN 0849 – 6825. Eok Su Sim, Hyoung Gon Lee, Jung Chul Lee, Jin Woo Park 2004. Efficient Work Measurement System of Manufacturing Cells
Using Speech Recognition and Digital Image Processing Technology. International Journal Manufacturing Technology 29 2006 Pages 772 – 785.
Foster 2003. Operational Management – Time and Motion Study.ppt. www.freequality. org /sites_ free quality_org/ document/tranning.
Fred E. Meyers 1992. Motion and Time Study – Improving Work Methods and Management. Prentice Hall Inc.
Grace Au, Ray J. Paul 1993. Visual Interactive Modelling : A Pictorial Simulation Specification System. European . Journal of Operation Research 91 1996 Pages 14 – 26.
Harrell, Ghosh, Bowden 2004, Simulation Using ProModel Second Edition. McGraw Hill.
Jay Heizer and Barry Render 2006. “Operations Management” Eight Edition. Pearson Education.
Jeffrey S. Smith (2003). Survey on the Use of Simulation for Manufacturing System Design and Operation. Journal of Manufacturing Systems, Vol. 22 / No 2 2003 Pages 157 – 171.
L. Aharonson Daniel 1996 Time Studies in A&E Departments – A Useful Tool for Management: Journal of Management in Medicine, Vol 10 No 3 Pages 15 – 22.
Lawrence S. Aft 2001. Work Measurement and Method Improvement. John Wiley and Sons Inc.
Marvin E. Mundel and David L. Danner 1994. Motion and Time Study – Improving Productivity. Seventh Edition. Prentice Hall Inc.
Ming Lu, Lap Chi Wong 2005. Comparison of Two Simulation Methodologies in Modelling Construction System : Manufacturing – Oriented PROMODEL vs Construction – Oriented SDESA. Journal of Automation 16 2007 Pages 86 – 95.
O. C Jensen, S. Stage, P.Noer 2004. Injury and Time Studies of Working Process in Fishing. Journal of Safety Science 44 (2006) Pages 349 – 358.
Ralph M. Barnes 2001. Motion and Time Study – Design and Measurement of Work. Seventh Edition. John Wiley and Sons Inc.
Russell and Taylor 2005. Operations Management – Quality and Competitiveness in a Global Environment. Fifth Edition. John Wiley and Sons Inc.
SMIDEC 2002. SMI Development Plan 2001 – 2005. SMIDP Executive Summary.
Surjit Angra, Rakesh Sehgal, Z. Samsudeen Noori 2004. Cellular Manufacturing – A Time Based Analysis to the Layout Problem. International Journal of Production Economic 112 2008 Pages 427 – 438.