http://www.ijcmph.com pISSN 2394-6032 | eISSN 2394-6040
Original Research Article
Determinants of hospital waiting time for outpatient care in India: how
demographic characteristics, hospital ownership, and ambulance
arrival affect waiting time
Shyamkumar Sriram*, Rakchanok Noochpoung
INTRODUCTION
Waiting time is the amount of time a patient has to wait in a clinic or hospital before being seen by clinical personnel.1 Healthcare organizations that aim to improve quality must focus on their waiting times.2 Waiting time in clinics and hospitals is an important factor leading to patient dissatisfaction and creating discomfort for the patient. This condition seems to exist around the world. A
report of the Institute of Medicine says that patients must be seen within 30 minutes after their arrival to a hospital/clinic.3 This is not the case in most developing countries, where patients experience an average waiting time of 2- 4 hours before seeing a doctor.4-6 Even developed countries are having trouble dealing with this issue.7 The duration of waiting times seems to vary between countries and also among different regions of the same country. In the US, the average waiting time was
ABSTRACT
Background: Waiting time in hospital outpatient clinics affects patient satisfaction, access to care, health outcomes, trust, willingness to return and hospital revenue. Only a few studies have explored length and variability of waiting times among patients. This study is an attempt to understand factors affecting waiting time experienced by patients in outpatient clinics.
Methods: For this study, data were collected in 2012 from 830 patients seeking care from outpatient clinics located in 30 randomly selected hospitals in the district of Nellore, India. Linear regression and logistic regression models have been used to identify the effect of various determinants on hospital waiting times.
Results: The average waiting time in government hospitals was 20.3 minutes compared to 15.5 minutes in private hospitals and 39.71 minutes in voluntary hospitals. Waiting time of men was about six minutes lower than women. After controlling for other patient related and hospital related factors, median wait time was 19% lower for male patients compared to females. Length of waiting declines with patient's age. Patients arriving by ambulance waited 64% less that patients not arriving by ambulance but this pattern was not valid for public hospitals.
Conclusions: Significant gender bias was present in all facility-types implying that policy and legal interventions would be required. For-profit hospitals had lower waiting time of patients to ensure higher demand for their services by the economically better-off sections of the population. The results highlight the importance of lowering the waiting time in public sector hospitals, especially for patients arriving in ambulances.
Keywords: Waiting times, Linear regression, Arrival by ambulance, Hospital ownership
Department of Health Services Policy and Management, University of South Carolina, Columbia, South Carolina, USA
Received: 24 April 2018
Revised: 29 May 2018
Accepted: 30 May 2018
*Correspondence:
Dr. Shyamkumar Sriram,
E-mail: [email protected]
Copyright: © the author(s), publisher and licensee Medip Academy. This is an open-access article distributed under the terms of the Creative Commons Attribution Non-Commercial License, which permits unrestricted non-commercial use, distribution, and reproduction in any medium, provided the original work is properly cited.
around 60 minutes in Atlanta, while in Michigan the average waiting time was approximately 188 minutes.8 In some countries with more public hospitals, like the UK and Canada, waiting times seem to be a major concern.9,10 Waiting times are considered to be significant barriers for people’s access to care.9
Studies show that waiting in the hospital is agonizing, frustrating, and demoralizing, and also leads to an increase in expenses for the patient. Clinic waiting time is considered to be one of the most important aspects of patient satisfaction.11 Customer satisfaction, which is a key indicator of service delivery in a hospital, seems to be related to waiting time.12 Dangerous consequences may occur due to long waiting times, such as the worsening of a health condition, a decrease in the quality of life for the person, and death.13 Studies note that an individual’s capacity to wait for treatment without experiencing any dangerous effects should be taken into account when deciding the waiting times for patients.14 Long waiting lists also seem to affect the mental health of patients, leading to depression, psychological distress, and anxiety disorders.15,16 Longer waiting times are associated with an increase in the level of discomfort experienced by the patient.12,17 Waiting times not only affect the level of patient satisfaction but also the willingness to return to the hospital.18,19
Reducing patient waiting times is also important for maintaining the business of hospitals. Studies indicate that waiting times erode the value that is derived as a result of treating the patient.20 Studies show that the experience of the patient in a hospital determines their willingness to return to that hospital; this includes both the medical care they received as well as non-medical service aspects, which include waiting times.21-23 Waiting times seem to be an independent factor and also an exclusive risk factor for the assessment of patient dissatisfaction.24 In countries with both public and private hospitals, longer waits in public hospitals compel patients to move to private hospitals for treatment.25
Studies show that patients who were given expected waiting times were more satisfied than those who were not. This factor further affects patient trust in an institution as well as their views about the service of the staff and responsiveness of the hospital.26 Waiting lists are also used as a way to ration health services in case there are limited available resources. Studies also show that waiting lines create stress not only to the patient but also to the physician who is treating the patient.27 It is also interesting to note that patient waiting times can be attributed to the doctor, the patient, or the hospital appointment system.27
Waiting time also serves as an indicator for horizontal equity and managerial effectiveness of the provision of health services.28 Thus it is vital to determine whether waiting lines have any relationship to the ethnicity of the population or other characteristics such as age and sex to find out whether there has been equity in the access to
health services. Some studies show that socioeconomic factors are important determinants for the wait time for a required health service.29 Women in all the different age groups are found to have longer waiting times when compared to men.30 Although some studies did not show any difference between ethnic groups in patient waiting time, it would be useful to further investigate this possibility in our study.28 Other studies showed that waiting times for some surgeries such as renal surgeries have been significantly lengthened for minority ethnic groups, women, and people with lower education and socio-economic status.31-33 We wish to ascertain whether this situation is the same for patients visiting outpatient departments as well. Various factors such as age of the patient, type of hospital, method of arrival of the patient (i.e., walk-in, ambulance) and insurance status affect waiting times.34
Considering the importance of waiting times as a measure of quality, equity, patient satisfaction, and access to health services, it is vital for us to study the various determinants of waiting times such as demographic characteristics (age, sex, and ethnicity) to find out whether there are disparities based on demographic features. Other determinants such as the nature of the ownership of hospitals and patient arrival by ambulance are also studied to find out whether waiting time changes based on these facility level determinants.
METHODS
checked for the continuous data for waiting time. The best method to make the data normal has been researched. With the appropriate transformation being done, the data has been made normal to satisfy the assumptions of OLS. The residuals were predicted and checked for heteroscedasticity, which has been corrected or cured. Multicollinearity among the independent variables has been checked.
RESULTS
We tested and evaluated the association between the characteristics of patients (sex, race, age) and other characteristics such as arrival by ambulance and ownership of the hospital with the waiting time
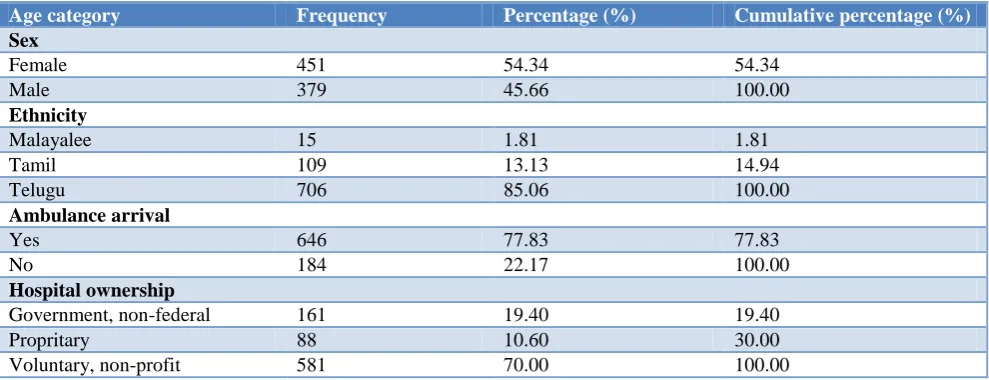
experienced by the patients. Analysis was done to assess whether the independent variables were associated with the dependent variable (waiting time). Statistical significance was assessed at the 5%, 1%, and 0.1% significance levels. The data set contains 830 observations of the study that took place between May 2012 and September 2012 in India. The descriptive characteristics of continuous waiting time and age variables have a mean of 33.4 minutes and 36.02 years respectively as described in Table 1. The descriptive characteristics of the dummy variables, namely sex, race, arrival by ambulance, and hospital ownership, are given in Tables 2–4. 4 models of regressions analysis were used and the results are discussed.
Table 1: Summary statistics of continuous variables.
Variable Observation Mean Std. dev. Minimum Maximum
Waiting time 830 33.37229 52.20249 1 730
Age 830 36.02169 22.73404 1 94
Table 2: Cross tabulation of hospital ownership and arrival by ambulance.
Ownership Arrival by ambulance Total
No Yes
Government 77 84 161
Proprietary 76 12 88
Voluntary non-profit 493 88 581
Total 646 184 830
Table 3: Cross tabulation of sex and ethnicity.
Sex Ethnicity Total
Malayalee Tamil Telugu
Female 9 63 379 451
Male 6 46 327 379
Total 15 109 706 830
Table 4: Descriptive statistics of dummy variables.
Age category Frequency Percentage (%) Cumulative percentage (%)
Sex
Female 451 54.34 54.34
Male 379 45.66 100.00
Ethnicity
Malayalee 15 1.81 1.81
Tamil 109 13.13 14.94
Telugu 706 85.06 100.00
Ambulance arrival
Yes 646 77.83 77.83
No 184 22.17 100.00
Hospital ownership
Government, non-federal 161 19.40 19.40
Propritary 88 10.60 30.00
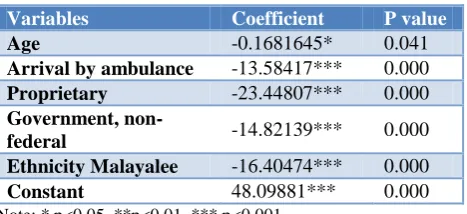
Table 5: Model 1- multiple regression model.
Variables Coefficient P value
Age -0.1681645* 0.041
Arrival by ambulance -13.58417*** 0.000
Proprietary -23.44807*** 0.000
Government,
non-federal -14.82139*** 0.000 Ethnicity Malayalee -16.40474*** 0.000
Constant 48.09881*** 0.000
Note: * p<0.05, **p<0.01, *** p<0.001
In Model 1 (Table 5), a multiple regression model assuming linearity and without any transformations were used. For every year increase in age, the waiting time decreases by 0.16 minutes on average, holding other variables constant. Being of Malayalee ethnicity decreases the waiting time by 16.40 minutes on average, compared to that of other races, holding other variables constant. Using a government owned, non-federal health facility decreases the waiting time by 14.82 minutes on average, compared to people using other types of facilities, holding other variables constant. Using a proprietary owned health facility decreases waiting time by 23.44 minutes on average, compared to other facilities, holding other variables constant. Arrival by ambulance decreases the waiting time by 13.54417 minutes on average, compared to people who do not arrive by ambulance, holding other variables constant.
Table 6: Model 2 - regression model with polynomial and interaction functions.
Variables Coefficient P value
Arrival by ambulance -20.95313*** 0.000
Proprietary -24.52323*** 0.000
Government,
non-federal -19.55298*** 0.000 Ethnicity Malayalee -15.37663*** 0.000
Interaction between ambulance arrival and government owned
14.63223*** 0.002
Constant 43.20722*** 0.000
Note: *p<0.05, **p<0.01, ***p<0.001.
In Model 2 (Table 6), a regression model with polynomial and interaction functions are used. Arrival by ambulance decreases the waiting time by 20.95 minutes on average, compared with those who do not arrive by ambulance, holding other variables constant. Using a government owned, non-federal health facility decreases the waiting time by 19.55 minutes on average, compared to people using other health facilities, holding other variables constant. Using a proprietary owned health facility decreases waiting time by 24.52 minutes on average, compared to people using other types of facilities, holding other variables constant. Being a Malayalee decreases the waiting time by 15.37663 minutes on average, compared to being a member of another race, holding other variables constant. People
who arrive by ambulance to a government owned facility will wait 24.84 minutes less on average, when compared to people not arriving by ambulance in other health facilities, holding other variables constant.
Table 7: Model 3 - regression model with interaction and log transformations.
Variables Coefficient P value
Gender -0.2090173*** 0.008
Arrival by Ambulance -1.035254*** 0.000
Proprietary -0.9005406*** 0.000
Government,
non-federal -0.0202192 0.883 Interaction between
ambulance arrival and government owned
0.7349084*** 0.001
Constant 3.171588*** 0.000
Note: *p<0.05, **p<0.01, ***p<0.001.
The model 3 (Table 7) used a regression model with interaction and log transformation functions. The median waiting time for male patients is 18.86% shorter than that of female patients, holding other variables constant. The median waiting time for patients who arrive by ambulance is 64% shorter than patients who do not arrive by ambulance, holding other variables constant. The median waiting time of patients using a proprietary owned hospital is 59% shorter compared to patients using other types of hospitals, holding other variables constant. The median waiting time of patients using a government owned hospital is 2% shorter compared to patients using other types of hospitals, holding other variables constant. Patients who arrive by ambulance to a government owned health facility wait 2.08 times longer than people who do not arrive in ambulance to other types of health facilities, holding other variables constant.
Table 8: Model 4 - logistic regression model.
Variables Coefficient Odds ratio
P value
Arrival by
Ambulance 1.049854*** 2.857233 0.000 Proprietary 1.393226*** 0.5687373 0.000
Government,
non-federal -0.5643366*** 4.027823 0.005 Constant -0.2112421* 0.8095781 0.017
Note: *p<0.05, **p<0.01, ***p<0.001.
Table 9: Logistic model for waiting time—other characteristics.
Characteristics Value (%)
Sensitivity 42.08
Specificity 79.85
Positive predictive value 68.46
Negative predictive value 57.02
Correctly cassified (using estat
In Model 4 (Table 8 and 9), a logistic regression model was used The patients who arrive in an ambulance are 2.86 times more likely to wait longer than 365.5 minutes compared to people who do not arrive by ambulance, holding other variables constant. Patients who visit proprietary hospitals are 0.5 times less likely to wait more than 365.5 minutes, compared to people visiting other
hospitals, holding other variables constant. Patients who visit government owned hospitals are 4.03 times more likely to wait more than 365.5 minutes compared to people visiting other hospitals, holding other variables constant. The model is classified to 60.60%, which shows that it is a good model for predicting waiting time.
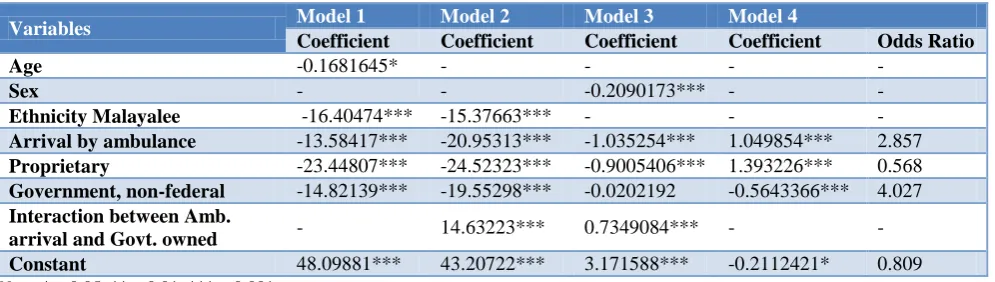
Table 10: Comparison between the four models: significant variables and coefficients.
Variables Model 1 Model 2 Model 3 Model 4
Coefficient Coefficient Coefficient Coefficient Odds Ratio
Age -0.1681645* - - - -
Sex - - -0.2090173*** - -
Ethnicity Malayalee -16.40474*** -15.37663*** - - -
Arrival by ambulance -13.58417*** -20.95313*** -1.035254*** 1.049854*** 2.857
Proprietary -23.44807*** -24.52323*** -0.9005406*** 1.393226*** 0.568
Government, non-federal -14.82139*** -19.55298*** -0.0202192 -0.5643366*** 4.027
Interaction between Amb.
arrival and Govt. owned - 14.63223*** 0.7349084*** - - Constant 48.09881*** 43.20722*** 3.171588*** -0.2112421* 0.809
Note: *p<0.05, **p<0.01, ***p<0.001.
Finally, we compared the results from the four models together to highlight the significant variables and coefficients as shown in Table 10. As we look at the comparison between the above models, we find that arrival by ambulance, proprietary hospital ownership, and government owned hospitals have a significant effect on the waiting time of patients across all the models. Age is significant in the linear regression model, and it becomes insignificant when the polynomial and interaction model is calculated. The interaction term is significant in models 2 and 3, and the ethnicity Malayalee variable is significant in models 1 and 2.
DISCUSSION
Our study found the following by using models 1 – 3. The waiting time of older patients is shorter when compared to that of younger patients, which shows that the health facilities have been sensitive to the needs of the elderly in terms of faster initiation of care. Being of Malayalee ethnicity leads to waiting less time, possibly because of their socio-economic status, or this may be due to other reasons that require further study. Profit proprietary hospitals have shorter waiting times compared to other hospitals, possibly because the private ownership of the hospitals makes them more sensitive to the waiting times for patients. Government hospitals have a longer waiting time than profit proprietary hospitals, followed by the non-profit hospitals, which have the longest waiting time. Further studies may be required to study non-profit hospitals and their effect on waiting times, since our study shows that non-profit hospitals are the least sensitive to the needs of the patient due to their lengthy waiting times. Our study also shows that people who arrive by ambulance have shorter waiting times than people who do not arrive by ambulance. The reason for this could possibly be that people who arrive by
ambulance have serious health problems and are seen by a physician faster than other patients. People who arrive in an ambulance to government owned health facilities have longer waiting times compared to others; this may be due to the fact that most of the ambulances that are operated by the government health facilities may be poor. One of our final models also shows that males have shorter waiting times compared to females. This may be that due to the misogynist culture of India; where men are given preference everywhere, women have longer waiting times. Our study findings are consistent with that of the findings of Ray AA, which shows that women have longer waiting times than men.30 However, the findings of our logistic regression model (Model 4) are only consistent with the other models in the findings of reduced waiting time in proprietary hospitals compared to other hospitals.
CONCLUSION
Government facilities should shorten the waiting time for people arriving by ambulance. This may mean that they need to have more emergency medical personnel or physicians and transport patients from the outpatient department to the emergency department faster.
Limitations
In this study multiple models that produced significant results were considered. The majority of the numbers of variables that are significant were common to many models. Yet, there may have been variables that were significant in only one or two models. But those variables have also been considered for the explanation of the model since the underlying theory supports its inclusion. Further research studies need to be carried out to explain some of the determinants completely.
ACKNOWLEDGEMENTS
We thank Dr. Veluru Chandrasekhar, Professor and Head of the Department of Narayana Medical College, Nellore, India and Dr. Zaina Quershi, Assistant Professor, Department of Health Services Policy and Management, University of South Carolina, USA for their support for the research and writing the manuscript.
Funding: No funding sources Conflict of interest: None declared
Ethical approval: The study was approved by the Institutional Ethics Committee
REFERENCES
1. Rossiter CE, Raynolds FA. Automatic monitoring of the time waited in an outpatient clinic. J Storage: Med Care. 1968;1:218–25.
2. Rondeau KV. Managing the clinic wait: an important quality of care challenge. Journal of nursing care quality. 1998;13(2):11-20.
3. O'Malley MS, Fletcher SW, Fletcher RH, Earp JA. Measuring patient waiting time in a practice setting: a comparison of methods. J Ambulatory Care Management. 1983;6(3):20-7.
4. Singh H, Haqq ED, Mustapha N. Patients' perception and satisfaction with health care professionals at primary care facilities in Trinidad and Tobago. Bull World Health Organ. 1999;77(4):356-60.
5. Ofilli AN, Ofowve CE. Patient's assessment of efficiency of services at a teaching hospital in a developing country. Ann Afr Med. 2005;4(4):150– 3.
6. Anderson R, Barbara A, Feldman S. What patients want: A content analysis of key qualities that influence patient satisfaction. The Journal of medical practice management: MPM. 2007;22(5):255-61.
7. Siciliani L, Hurst J. Tackling excessive waiting times for elective surgery: a comparative analysis of
policies in 12 OECD countries. Health policy (Amsterdam, Netherlands). 2005;72(2):201-15. 8. dos Santos LM, Stewart G, Rosenberg NM.
Pediatric emergency department walk-outs. Pediatric Emergency Care. 1994;10(2):76-8. 9. Sanmartin C, Gendron F, Berthelot JM, Murphy K.
Access to health care services in Canada, 2003. Catalogue no. 82-575-XIE. Ottawa. Statistics Canada. Available at: http://publications.gc.ca/
Collection/Statcan/82-575-X/82-575-XIE2006002.pdf. Accessed 10 January 2018. 10. Booth AJ, Harrison CJ, Gardener GJ, Gray AJ.
Waiting times and patient satisfaction in the accident and emergency department. Arch Emer Med. 1992;9(2):162-8.
11. Bar-dayan Y, Leiba A, Weiss Y, Carroll JS, Benedek P. Waiting time is a major predictor of patient satisfaction in a primary military clinic. Military Med. 2002;167(10):842-5.
12. Dansky KH, Miles J. Patient satisfaction with ambulatory healthcare services: waiting time and filling time. Hospital Health Services Admin. 1997;42(2):165-77.
13. Derrett S, Paul C, Morris JM. Waiting for elective surgery: effects on health-related quality of life. International journal for quality in health care. J International Society Quality Health Care. 1999;11(1):47-57.
14. Llewellyn-Thomas HA, Arshinoff R, Bell M, Williams JI, Naylor CD. In the queue for total joint replacement: patients' perspectives on waiting times. Ontario Hip and Knee Replacement Project Team. J Evaluation Clin Practice. 1998;4(1):63-74.
15. Horgan D, Davies B, Hunt D, Westlake GW, Mullerworth M. Psychiatric aspects of coronary artery surgery. A prospective study. Med J Aust. 1984;141(9):587-90.
16. Peduzzi P, Hultgren H, Thomsen J, Detre K. Ten-year effect of medical and surgical therapy on quality of life: Veterans Administration Cooperative Study of Coronary Artery Surgery. Am J Cardiol. 1987;(59):1017-23.
17. Katz K, Larson B, et al. Prescription for the waiting line blues: entertain, enlighten, and engage. Sloan Manag Rev. 1991;32(2):44-53.
18. Zoller JS, Lackland DT, Silverstein MD. Predicting patient intent to return from patient satisfaction scores. J Ambul Care Manage. 2001;24(1):44-50. 19. Burroughs TE, Davies AR, Cira JC, Dunagan WC.
Understanding patient willingness to recommend and return: a strategy for prioritizing improvement opportunities. Jt Comm J Qual Improv. 1999;25(6):271-87.
20. Yeung RYT, Leung GM, McGhee SM, Johnston JM. Waiting time and doctor shopping in a mixed medical economy. Health Econ. 2004;13(11):1137-44.
22. Zapka JG, Palmer RH, Hargraves JL, Nerenz D, Frazier HS, Warner CK. Relationships of patient satisfaction with experience of system performance and health status. J Ambul Care Manag. 1995;18(1):73-83.
23. Coffey RM. The effect of time price on the demand for medical care services. J Human Res. 1983;18(3):407-24.
24. Pitrou I, Lecourt AC, Bailly L, Brousse B, Dauchet L, Ladner J. Wait¬ing time and assessment of patient satisfaction in a large refer¬ence emergency department: a prospective cohort study, France. Eur J Emerg Med. 2009;16(4):177-82.
25. Duckett SJ. Private care and public waiting. Aust Health Rev. 2005; 29(1):87-93.
26. Mowen JC, Licata JW, McPhail J. Waiting in the emergency room: how to improve patient satisfaction. J Health Care Mark. 1993;13(2):26-33. 27. Oche, MO, Adamu, H. Determinants of patient
waiting time in the general outpatient department of a tertiary health institution in north western Nigeria. Ann Med Health Sci Res. 2013;3(4):588-92. 28. Badakhshan A, Arab M, Gholipour M, Behnampour
N, Saleki S. Heart Surgery Waiting Time: Assessing the Effectiveness of an Action. Iranian Red Crescent Med J. 2015;17(8):e24851.
29. Arnesen KE, Erikssen J, Stavem K. Gender and socioeconomic status as determinants of waiting time for inpatient surgery in a system with implicit queue management. Health Policy. 2002;62(3):329-41.
30. Ray AA, Buth KJ, Sullivan JA, Johnstone DE, Hirsch GM. Waiting for cardiac surgery: results of a risk-stratified queuing process. Circulation. 2001;104(12):92-8.
31. Kasiske BL, London W, Ellison MD. Race and socioeconomic factors influence early placement on the kidney transplant waiting list. J Am Soc Nephrol. 1998;(9):2142-7.
32. Ayanian JZ, Cleary PD, Weissman JS, Epstein AM. The effect of patients' preferences on racial differences in access to renal transplantation. N Engl J Med. 1999;341(22):1661-9.
33. Epstein AM, Ayanian JZ, Keogh JH, Noonan SJ, Armistead N, Cleary PD, et al. Racial disparities in access to renal transplantation--clinically appropriate or due to underuse or overuse? N Engl J Med. 2000;343(21):1537-44.
34. Thompson DA, Yarnold PR. Relating patient satisfaction to waiting time perceptions and expectations: the disconfirmation paradigm. Acad Emerg Med. 1995;2(12):1057-62.