165 Volume and Issues Obtainable at Center for Sustainability Research and Consultancy
Journal of Business and Social Review in Emerging Economies
ISSN: 2519-089X (E): 2519-0326Volume 5: No. 1, June 2019
Journal homepage: www.publishing.globalcsrc.org/jbsee
The Behavior of Using Simcard in Indonesia Border Area
1
Ray Sastri, 2 Arbi Setiyawan, 3 Setia Permana, 4 Heny Wulandari
1
STIS Polytechnic of Statistics, Indonesia: [email protected]
2
National Statistics Training Centre, Indonesia.
3
STIS Polytechnic of Statistics, Indonesia.
4
Statistics Indonesia.
ARTICLE DETAILS ABSTRACT
History
Revised format: May 2019 Available Online: June 2019
Digital life exists in the border area. The cellphone is a part of daily life. Signals from many telecommunication service providers, both Indonesia and foreign, are captured. The problem is when foreign signals captured, then the roaming rate charged. Some people avoid it by switching their simcard to a local simcard. Some people in border area using local simcard (from Indonesian service providers) some use foreign simcard, and other use mixed of them (local and foreign). Knowing about border crosser behavior in using simcard is important not only for the telecommunication service provider but also for the government. The study aims to estimate the number of border crosser based on their behavior in using simcards when entering Indonesia. This study uses data from Survey of Foreign Tourist Based on Mobile Positioning Data conducted by Statistics Indonesia in 2017. Based on that survey, there were 28.305 of border crosser having cellphones. The method of analysis is multinomial logistic regression. The responsese variable is the behavior of using simcard with 3 categories; foreign, local, and mixed. The model fit the data well. The result show that 53,8 percent of border crosser are foreigners most of them entering Indonesia through Kalimantan. The use of simcard in the boundaries area is significantly influenced by sex, age, purpose to visit Indonesia, and region. There are 7,3 percent of foreigner use mixed cards and only 1,4 percent use local cards. For border crossers from Indonesia, there is 99,7 percent use local cards while the other 0,3 percent use mixed cards and no one uses foreign cards.
© 2019 The authors, under a Creative Commons Attribution-NonCommercial 4.0
Keywords
Cellphone, Simcard, Logistic Regression, Border Area
JEL Classification:
C25, C29
Corresponding author’s email address: [email protected]
Recommended citation: Sastri, R., Setiyawan, A., Permana, S. and Wulandari, H. (2019). The Behavior of Using Simcard in Indonesia Border Area. Journal of Business and Social Review in Emerging Economies, 5 (1), 165-174
DOI: 10.26710/jbsee.v5i1.727
1. Introduction
The general entrance to a country such as at an airport, port, or land border usually have an immigration checking process. In Indonesia, many traditional border gates have no immigration checking
166
East Kalimantan, Papua, East Nusa Tenggara, Riau, Riau Island, and North Sulawesi. They are usually used by locals or resident from neighbor countries that live not far from the border line.
Like other area, digital life also exist in border area. The cellpone is a part of daily life. Signals from many telecommunication service providers, both Indonesia and foreign, are captured. The problem is when foreign signals captured, then the roaming rate charged. Some people avoid it by switching their simcard to local simcard. Some people in border area using local simcard (from Indonesian service providers) some use foreign simcard, and other use mixed of them (local and foreign). Knowing about border crosser behavior in using simcard is important not only for the telecommunication service provider but also for the government. For the service provider, they can improve their service. For Indonesia government, they will get additional information to improve their foreign tourist data.
There has no study about using simcard behavior and its relationship with user characteristics, especially in Indonesian traditional border area. It is due to the location. Almost all of the traditional border gates are located in remote area. It was very difficult to get the data until Statistics Indonesia conducted a Survey of Foreign Tourist Based on Mobile Positioning Data in 2017. From this survey, we get much information about characteristics of border crosser. Mburu and (2012) were about consumer in their simcard. The study was done in Botswana and the result showed that the propensity in switching is influenced by a variety of factors. Some are network rollout, quality service, cost of calling, completion, network failures, and policy. They also concluded that the propensity in switching is different between males and female.
The aim of this study is (1) to analyze the characteristics of border crosser (2) to analyze the effect of the border crosser characteristics to the behavior in using simcard (3) to estimate the number of border crosser based on their behavior in using simcards when entering Indonesia.
2. Research Methodology
This study uses data from Survey of Foreign Tourist Based on Mobile Positioning Data conducted by Statistics Indonesia in 2017. Data collection was carried out by interview using a questionnaire in all traditional border gate around Indonesia. Responsedents in this survey included all people entering Indonesian territory both Indonesian resident and foreign residents. Based on that survey, 32.316 people crossed the border line and 28.305 of them have cellphones. The unit of analysis in this study is border crossers who have cellphones.
The method of analysis is multinomial logistic regression. The responsese variable (Y) have 3 categories, so that we will form 2 logit model with the last category become the reference. The general model of the multinomial logistic regression model as follows:
( ) [ ( )
( )] (1)
( ) [ ( )
( )]
(2)
Y is the responsese variable, is the parameter, and X is the explanatory variable. The parameter measure the relationship between explanatory variable and responses variable. It is estimated using Maximum Likelihood Estimation (MLE). The general form of conditional likelihood with n independent observations is as follows:
( ) ∏ [ ( ) ( ) ( ) ]
Parameter estimation ( ̂) is obtained when the ( ) function maximum. ̂ are obtained through Newton Raphson's iteration method (Hosmer and Lemeshow, 2000).
167 ∑ ( ) ( )
With j is index for catogory of Y, is the observation frequency, is the expected frequency. The null hypothesis is rejected if ( ).
Testing the parameter simultaneously is used to see the effect of all explanatory variables on the responsese variables in logistic regression. The null hypothesis used is that there is no effect of the explanatory variable on the responsese variable against the alternative hypothesis there is at least one explanatory variable that affects the responsese variable. The test statistics is:
(
) ( )
The null hypothesis will be rejected if ( ) or p-value .
Parameter partial test is done by Wald test. The null hypothesis is no effect of the k-th explanatory variable on the responsese variable in the model j. The alternative hypothesis is the k-th explanatory variable affect the responsese variable in the model j.
The test statistics is:
( ̂ ( ̂ )
) ( )
We will reject the null hypothesis if ( ) or p-value .
The interpretation of the multinomial logistic regression model is done by odds ratio. In models with three categories of responsese variables, odds ratios are calculated for the comparison between response variable in category 1 and responsese variables in category 3, and between response variable in category 2 and response variable in category 3. For example:
( ( ) ( ) ( )) ( ( ) ( ) ( ))
( ( ) ( ) ( )) ( ( ) ( ) ( ))
Or it can be written succinctly as dan
168
Table 1. Variables Used in This Research
VARIABLE TYPE CATEGORY
RESPONSESE
VARIABLE SIMCARD CATEGORICAL
1: LOCAL 2: MIXED 3: FOREIGN
EXPLANATORY VARIABLE
SEX CATEGORICAL 1: MALE
2: FEMALE
AGE GROUP CATEGORICAL
1: <30 2: 30-39 3: 40-49 4: >49
PURPOSE OF
VISIT TO
INDONESIA
CATEGORICAL
1: HOLIDAYS (HOLIDAYS, HEALTH, & BEAUTY)
2: VISITING RELATIVES (VISITING FRIENDS
/ RELATIVES, RELIGY CEREMONY /
ZIARAH)
3: JOB AFFAIRS (BUSINESS / BUSINESS, SERVICE, MICE / MEETING, EDUCATION / TRAINING, OR SPORT MISSION / CULTURE) 4: OTHERS
MAIN JOB CATEGORICAL
1: PROFESSIONAL / BUSINESS ACTORS
2: GOVERNMENT OFFICERS/ MILITARY / PENSIONARY
3: PRIVATE EMPLOYEES 4: OTHERS
REGION CATEGORICAL
1: RIAU & KEPRI 2: KALIMANTAN 3: OTHERS
3. Result
During the survey period, the largest number of border crodder was in West Kalimantan, (51 percent), followed by East Nusa Tenggara (18 percent) and Riau (17 percent). The lowest number was in North Sulawesi, (1 percent). West Kalimantan and East Nusa Tenggara can be entered by road, so that easier for someone to cross the border.
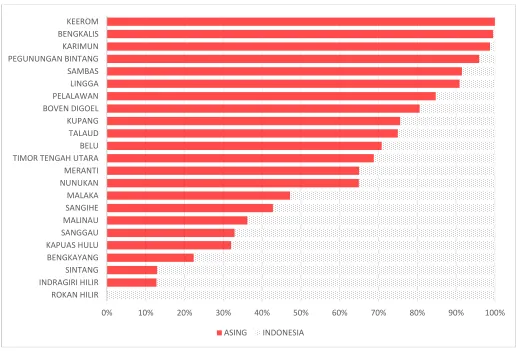
Not all of border crossers are foreigners. About 53,8 percent of them are foreigners and 46,2 percent are Indonesians. However, all of border crossers in the Keerom, Papua, are foreigners. In Bengkalis, Riau, It is about 99,58 percent foreigners but all border crosser in Rokan Hilir are Indonesians. The percentage of border crossers according to residence can be seen in Figure 2.
169
Figure 1. Border Crossing Distribution Based on Crossing Province
The use of cellphone is always followed by the use of simcard. About 10,03 percent of foreigners use local simcard and 16,69 percent use mixed simcard. Indonesian resident whose back to their home are 71,17 use local simcard, 21,01 percent use foreign simcard that they brought from neighbor countries, and 7.82 percent used mixed simcard.
Figure 2. Percentage of Border Crossers by Regency 17%
18%
51% 7%
1%
6% RIAU $ KEPRI
NTT
KALBAR
KALTARA
SULUT
PAPUA
0% 10% 20% 30% 40% 50% 60% 70% 80% 90% 100%
ROKAN HILIR INDRAGIRI HILIR SINTANG BENGKAYANG KAPUAS HULU SANGGAU MALINAU SANGIHE MALAKA NUNUKAN MERANTI TIMOR TENGAH UTARA BELU TALAUD KUPANG BOVEN DIGOEL PELALAWAN LINGGA SAMBAS PEGUNUNGAN BINTANG KARIMUN BENGKALIS KEEROM
170
Figure 3. Percentage of Border Crossers Using Cellphones by Provinces
Table 2. Use of Simcards in Border Areas by Native Country
Most of Indonesian pass traditional border gate to back home after some activities in neighbor country. Whereas, most of the foreigners come to visit their relatives. People living near border areas usually have relatives that live not far from their place but in Indonesian territory. For all of the purpose to visit Indonesia, most number of them use foreign simcard. Table 3 shows that a foreigner tend to use mixed simcard than switching all of their card to local.
Table 3. Use of Cards in Border Areas Based on the Purpose of Visiting Indonesia
PURPOSE SIMCARD TOTAL
LOCAL MIXED FOREIGN
1: HOLIDAYS 1.24 1.32 26.97 29.53
2: VISITING RELATIVES 6.64 10.29 29.38 46.31
3: JOB AFFAIRS 1.42 3.31 6.13 10.86
4: OTHERS 0.73 1.77 10.80 13.30
TOTAL 10.03 16.69 73.28 100.00
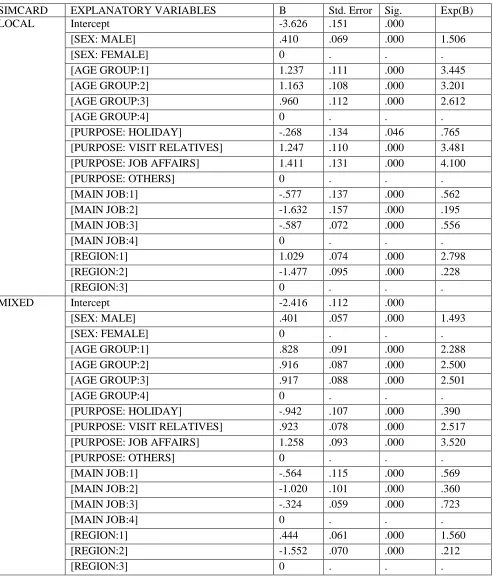
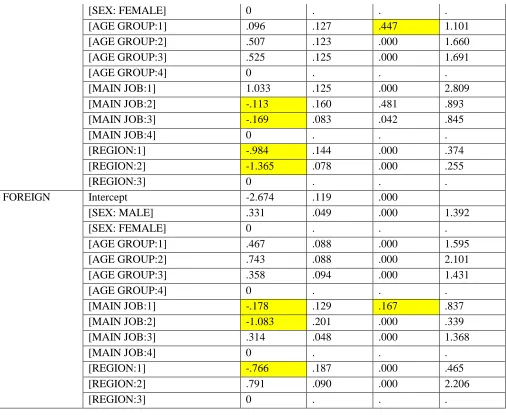
Sex, age, purpose of visit, main job, and region are simultaneously affect the use of simcards of foreigners when entering Indonesian territory through traditional border gate. Foreign men and age under 50 tend to use local simcard. But those visit Indonesia for holiday, main job "other", and cross the border line via Kalimantan are tend to use foreign simcard. For Indonesian, male, age under 50, private employees, and visit Indonesia through Kalimantan are tend to use foreign simcard. Estimation of parameter is completely in Table 4 and Table 5. By region, foreigners entering Indonesia through border gate in Kalimantan are tend to use foreign cards while those who enter Riau and Riau Islands tend to use local cards. Overall, Indonesian people tend to use foreign cards when passing Kalimantan. Whereas for regions other than Kalimantan, Indonesians tend to keep using local cards when crossing the border line.
98.05 94.07 84.24
90.74 95.63 45.43
47.44
0.00 20.00 40.00 60.00 80.00 100.00 120.00
RIAU KEPRI NTT KALBAR KALTIM SULUT PAPUA
Percentage (%)
Pro
vin
ce
NATIVE COUNTRY SIMCARD TOTAL
LOCAL MIXED FOREIGN
FOREIGN 10.03 16.69 73.28 100.00
171
Table 4. Estimation of Parameters of Multinomial Logistic Regression Models for Foreign Border Crossers
SIMCARD EXPLANATORY VARIABLES B Std. Error Sig. Exp(B)
LOCAL Intercept -3.626 .151 .000
[SEX: MALE] .410 .069 .000 1.506
[SEX: FEMALE] 0 . . .
[AGE GROUP:1] 1.237 .111 .000 3.445
[AGE GROUP:2] 1.163 .108 .000 3.201
[AGE GROUP:3] .960 .112 .000 2.612
[AGE GROUP:4] 0 . . .
[PURPOSE: HOLIDAY] -.268 .134 .046 .765
[PURPOSE: VISIT RELATIVES] 1.247 .110 .000 3.481
[PURPOSE: JOB AFFAIRS] 1.411 .131 .000 4.100
[PURPOSE: OTHERS] 0 . . .
[MAIN JOB:1] -.577 .137 .000 .562
[MAIN JOB:2] -1.632 .157 .000 .195
[MAIN JOB:3] -.587 .072 .000 .556
[MAIN JOB:4] 0 . . .
[REGION:1] 1.029 .074 .000 2.798
[REGION:2] -1.477 .095 .000 .228
[REGION:3] 0 . . .
MIXED Intercept -2.416 .112 .000
[SEX: MALE] .401 .057 .000 1.493
[SEX: FEMALE] 0 . . .
[AGE GROUP:1] .828 .091 .000 2.288
[AGE GROUP:2] .916 .087 .000 2.500
[AGE GROUP:3] .917 .088 .000 2.501
[AGE GROUP:4] 0 . . .
[PURPOSE: HOLIDAY] -.942 .107 .000 .390
[PURPOSE: VISIT RELATIVES] .923 .078 .000 2.517
[PURPOSE: JOB AFFAIRS] 1.258 .093 .000 3.520
[PURPOSE: OTHERS] 0 . . .
[MAIN JOB:1] -.564 .115 .000 .569
[MAIN JOB:2] -1.020 .101 .000 .360
[MAIN JOB:3] -.324 .059 .000 .723
[MAIN JOB:4] 0 . . .
[REGION:1] .444 .061 .000 1.560
[REGION:2] -1.552 .070 .000 .212
[REGION:3] 0 . . .
Table 5. Estimation of Parameters of Multinomial Logistic Regression Models for Indonesian Boundaries
SIMCARD EXPALANTORY VARIABEL B Std. Error Sig. Odds Ratio
MIXED Intercept -1.866 .130 .000
172
[SEX: FEMALE] 0 . . .
[AGE GROUP:1] .096 .127 .447 1.101
[AGE GROUP:2] .507 .123 .000 1.660
[AGE GROUP:3] .525 .125 .000 1.691
[AGE GROUP:4] 0 . . .
[MAIN JOB:1] 1.033 .125 .000 2.809
[MAIN JOB:2] -.113 .160 .481 .893
[MAIN JOB:3] -.169 .083 .042 .845
[MAIN JOB:4] 0 . . .
[REGION:1] -.984 .144 .000 .374
[REGION:2] -1.365 .078 .000 .255
[REGION:3] 0 . . .
FOREIGN Intercept -2.674 .119 .000
[SEX: MALE] .331 .049 .000 1.392
[SEX: FEMALE] 0 . . .
[AGE GROUP:1] .467 .088 .000 1.595
[AGE GROUP:2] .743 .088 .000 2.101
[AGE GROUP:3] .358 .094 .000 1.431
[AGE GROUP:4] 0 . . .
[MAIN JOB:1] -.178 .129 .167 .837
[MAIN JOB:2] -1.083 .201 .000 .339
[MAIN JOB:3] .314 .048 .000 1.368
[MAIN JOB:4] 0 . . .
[REGION:1] -.766 .187 .000 .465
[REGION:2] .791 .090 .000 2.206
[REGION:3] 0 . . .
Table 6. Results of Predictions of Multinomial Logistic Regression Models for Foreign Border Crossers and Indonesia
OBSERVATION
PREDICTED
FOREIGN INDONESIA
LOCAL MIXED FOREIGN Percent
Correct LOCAL MIXED FOREIGN
Percent Correct
LOCAL 65 377 1075 4,3% 8974 31 0 99,7%
MIXED 84 483 1923 19,4% 990 8 0 ,8%
FOREIGN 60 234 10710 97,3% 2677 2 0 ,0%
Overall
Percentage 1,4 % 7,3 % 91,3 % 75,0 % 99,7 % 0,3 % 0 % 70,8 %
173
4. Conclusion
About 53,8 percent of border crosser are foreigners most of them entering Indonesia through Kalimantan. The use of simcard in the boundaries area is significantly influenced by sex, age, purpose to visit Indonesia, and region. According to the model, the prediction of a foreigner entering Indonesian territory through traditional border gate is 91,3 percent use foreign cards, the remaining 7,3 percent use mixed cards and only 1,4 percent use local cards. For border crossers from Indonesia, according to the model, 99,7 percent use local cards while the other 0,3 percent use mixed cards and no one uses foreign cards.
Reference
Agresti Alan. 2002. Categorical Data Analysis, Second Edition. New York: John Wiley & Sons.
Badan Pusat Statistik. 2017. Buku Pedoman Pencacahan Pendataan Wisman Berbasis Mobile Positioning Data (MPD) Tahun 2017. Jakarta: Badan Pusat Statistik.
Hosmer D.W. and Lemeshow J.S. 2000. Applied Logistics Regression, Second Edition. New York: John Wiley & Sons.