Multiclass Classification Using Random Forest
Algorithm To Prognosticate The Level Of Activity
Of Patients With Stroke
Norma J. Apao, Larmie S. Feliscuzo, Cherry Lyn C. Sta. Romana, Jennifer Aurea S. Tagaro
Abstract—Predictive analytics in healthcare taps data mining, statistics, modeling, machine learning, and artificial intelligence that allows organizations to speak with their data to predict outcomes effectively. The prime objective of this study was to give an in-depth application of machine learning techniques to prognosticate the level of activity of the necessary actions of the patient with stroke that involve the upper extremity into three classes. Prognosticating the level of basic activities of daily living offers insights both to the patients and health care providers that may support them in making informed decisions. Early prediction of the patient's outcome may help the medical rehabilitation center improve the current approaches and come up with new possibilities and solutions for better services and results. This study employed the knowledge discovery in the database system development method and implemented the random forest algorithm to develop a predictive model to prognosticate the level of activity. The patients’ scores of the tests and measures obtained by the therapist in the 15th session of consecutive or non-consecutive rehabilitation sessions of intensive physical therapy within the first three months after stroke were used in the study. Data from October 2018 to September 2019 of the medical rehabilitation center were utilized as the training and testing datasets with 34 features or attributes. The performance results show that the random forest algorithm achieved a high-level classification accuracy of 88.24% and performed well across all instances with a generated Kappa score of 0.8218. The results further revealed that random forest classifier achieved the highest performance in classifying the prepared datasets compared to J48, Naïve Bayes, Random Tree, and REPTree classification techniques. The most potent predictors in prognosticating the level of activity were also successfully identified in this study.
Index Terms— data mining, decision tree, health analytics, level of activity, multiclass classification, patients with stroke, random forest algorithm
—————————— ——————————
1
I
NTRODUCTIONDATA analytics has become strategic for most organizations nowadays and changes the way information is presented and how real-time decisions are made. Analytics is the process of exploring and evaluating datasets using digital tools and statistical techniques to discover knowledge and information that enables and helps organizations to make informed decisions. Today, we can now effectively speak with our data to answer questions, predict outcomes, and learn new patterns and relationships. With analytical technologies, organizations can tap and realize the potentials of their data. Healthcare analytics provides tools and techniques to develop insights and find meaningful information from the significant amount of data that support in making informed decisions in healthcare. Similarly, healthcare analytics helps streamline the process of data mining. In healthcare analytics, data mining application is commonly used in clinical decision support and administrative purposes [1]. Utilizing healthcare analytics in healthcare organizations is needed to achieve a broader range of goals [2]. The analytics system will provide the ability to derive insights from patterns and correlations found in the patient’s data and recognize how they might impact or influence future outcomes and identify areas for improvement on clinical quality measures and other aspects of care. Predictive health analytics is a new transformative tool that provides more practical and preventive treatment options [3]
and can be used to guide the rehabilitation of individual stroke patients [4]. Ischemic heart disease and stroke remain the significant killers worldwide in the last 15 years that claimed 15.2 million lives in 2016 [5]. Still, stroke is the second leading cause of death globally [6] and also the second leading cause of mortality in both developed and developing countries, more particularly in the Philippines [7]. A stroke also called a cerebrovascular accident or "brain attack," is a medical condition that happens when a blood vessel ruptures and bleeds or when part of the brain loses its blood supply, damaging the brain cells [8].
Stroke is a high-occurrence neurologic disorder [9], [10] and the most common cause of disability [6] and dependency that directly decrease the quality of life of the patients [11]. A stroke can cause temporary or permanent disabilities depending on the severity or how long the brains lack blood flow and which area of the brain was affected [12]. Patients with stroke frequently have difficulties in carrying out daily activities and participating in other activities [13]. Stroke causes a broader range of disabilities and has a more significant impact on disability than other chronic diseases [14]. Disability affects not only the patient but to the family as well, and effects can be felt in social, financial, and other aspects of life [11]. Commonly, stroke can cause the following types of disabilities: paralysis or loss of muscle movement in an area of the body, pain, sensory disturbances, aphasia and other speech disorders, cognitive and memory problems, and emotional disturbances [15]. Rehabilitation services give hope to the patients who have physical, mental, and emotional deficits to restore their life and return to the level of activity they had before the stroke. Improving the quality of life is the desired outcome for patients undertaking rehabilitation services. The rehabilitation of stroke patients may take weeks or months, depending on the severity of the stroke and the underlying health of the patient. Usually, rehabilitation medicine team that includes the physiatrists, occupational therapists, physical therapists (PT), speech pathologist and the like work in coordination and collaboration to prevent severe complications and help the patients recover from the medical condition. The physical therapists create a plan of care to implement ————————————————
Norma J. Apao is currently pursuing doctorate degree program in information technology in Cebu Institute of Technology - University, Philippines. E-mail: [email protected]
Larmie S. Feliscuzo is currently connected with the College of Computer Studies of Cebu Institute of Technology - University, Philippines.
Cherry Lyn C. Sta. Romana is currently connected with the College of Computer Studies of Cebu Institute of Technology – University, Philippines.
1234 appropriate interventions that help alleviate impairments
secondary to strokes like muscle weakness or paralysis, loss of motor control, and sensory deficits. In the therapy of patients with stroke, the emphasis is on the treatment of physical impairments such as to relieve pain, increased range of motion and muscle strength, regain their motor skills, and reduction of spasticity. All these PT interventions improve activity limitation and participation restriction. This study intends to apply the Random Forest algorithm to prognosticate the level of activity of the patients with stroke after three months of stroke. Several studies demonstrated that this algorithm achieves high accuracy in healthcare data analytics. In the health care analysis of Deepa, et al. [16], the final predictions showed that the accuracy of the Random Forest is higher than Naïve Bayes and concluded that predicting any disease can be accurately done and classified using Random Forest machine learning technique. The study of Kaur et al. [17] employed the different machine learning techniques and considered public healthcare datasets in the cloud to develop a system that allows real-time and remote monitoring of health. The study concluded that the Random Forest algorithm achieves a maximum accuracy of 97.26% on one of the datasets and provides good accurate results for each of the other datasets considered. The study of Abdullah et al. [18] used the Random Forest classifier in developing a data mining model to improve the accuracy of prediction and in investigating several events associated with coronary heart disease. The results have shown that the Random Forest algorithm can be successfully used in predicting the risk factors and measures related to coronary heart disease. The results of the study of Chu et al. [19] that developed a prediction model for patients with gastrointestinal bleeding indicated that the Random Forest models consistently exhibited the best performance in comparison with SVM, ANN, KNN, Decision Trees and Shrunken Centroid machine learning techniques. Considering the outperformance of the Random Forest, this study utilized this algorithm to classify the execution of a task or action by a patient as Level 1 (high), Level 2 (moderate), or Level 3 (severe/none). The prime objective of this study is to give an in-depth application of random forest machine learning technique to predict the level of activity of the patients with stroke after the 15 consecutive or non-consecutive rehabilitation sessions of intensive physical and occupational therapy in the University of Bohol Medical Rehabilitation Center within the first three (3) months after stroke. Consequently, this study aims to determine the most potent predictors for predicting the level of functional outcome in basic activities of daily living (BADL) of the patients with stroke involving the upper extremity. The recovery in stroke patients undertaking rehabilitation typically transpires in the first three months of the incident and continues in the following three months [18]. Early prediction of the patient’s ability to perform activities of daily living (ADL) is substantial to provide insights and support both to the patients and clinicians make an evidence-based decision. It allows clinicians to plan early on the appropriate treatment methods and provides recommendations for enhancing the basic ADL capacity. Further, it helps to determine the level of assistance required, identify effective interventions that healthcare providers can implement to help the patients recover and reduce the burden of ADL care, the length of intervention, and for the patient to plan his or her possible rehabilitation expenditures if and when rehabilitation will be extended, or additional interventions will
be implemented. Likewise, precise prediction of functional outcome in patients with stroke has the potential to improve clinical care and quality of research on stroke [20].
2
M
ETHODOLOGYThis study applied the knowledge discovery in databases system development method based on the principle of Knowledge Discovery in Databases (KDD) coined by Piatetsky-Shapiro at the first KDD workshop in 1989 [21]. Piatetsky-Shapiro, a recipient of the GTE's highest technical achievement for health-care data analysis, defined KDD as "the nontrivial process of identifying valid, novel, potentially useful, and ultimately understandable patterns in data." The KDD process is outlined in Fig. 1.
Fig. 1. The Steps of the KDD Process
2.1 The Dataset and Attributes Used
Data were retrieved from the database of the Medical Rehabilitation Center of the University of Bohol between October 2018 to September 2019. All patients with stroke in the facility with difficulties in carrying out the daily activities and receiving physical and occupational rehabilitation services were included in the study. The data were analyzed to predict the functional outcome of the basic actions of the patient that involve upper extremity in the self-care tasks such as bathing, ambulation, dressing, eating, personal hygiene, and toileting (BADEPT). Scores of the test and measures obtained by the therapist in the 15th session of the patient are used in the study. The significant progress of the patient could be observed in the data collected in the 15th session of the physical rehabilitation program. Each instance or row in the dataset having 34 attributes represents a patient in the medical and rehabilitation with stroke. The dataset does not hold any personal information of the patients. Thus, this study is not violating the privacy of any person or patient in the dataset. The predictor variables include the patient’s characteristics and rehabilitation information listed in Table 1.
2.2 Multiclass Classification
Fig. 2. Binary Classification vs. Multiclass Classification
2.3 Model Construction
The input to the prediction model is the dataset with the features consisting of the patient’s characteristics and clinical data, and the output is a model. The class ―Level‖ of the model indicates the level of activity in executing a task or action.
Level = {1,2,3} where
1 indicates that the level of activity is high. This means that the patient can perform movements out of synergy with near to full function of the upper limb.
2 indicates that the level of activity is moderate. This means that the patient has limited movements of the upper extremity
3 indicates that the level of activity is severe or none. This means that the patient has no upper extremity functions.
The model is developed using the steps depicted in Fig. 3.
Fig. 3. Method Used in Constructing the Model
2.3.1 Decision Tree
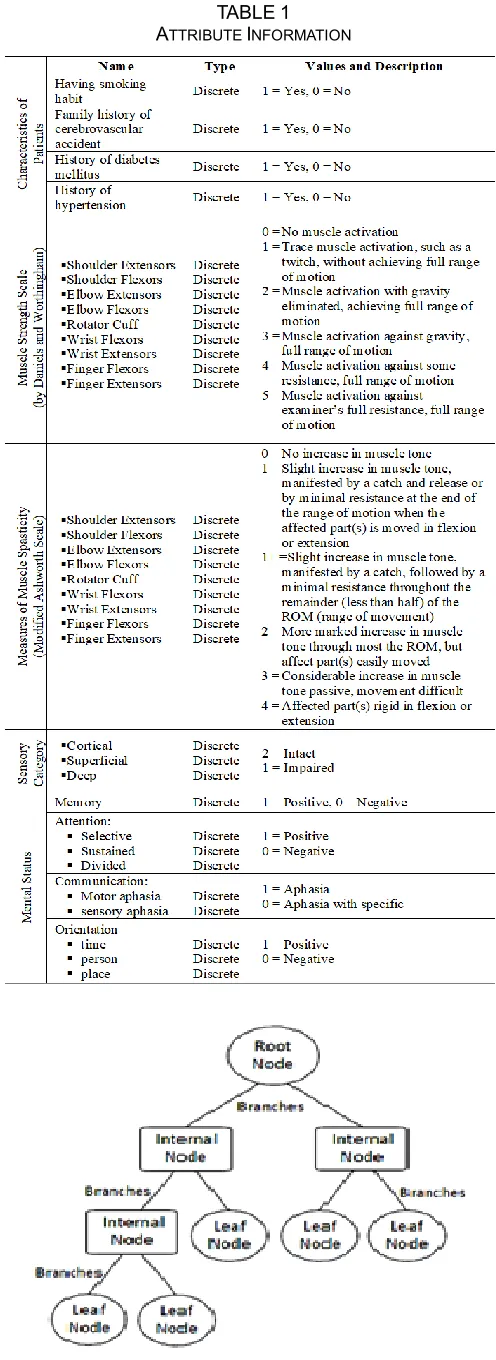
A decision tree is the building block of random forests. It is a supervised machine learning algorithm used for classification and regression problems. To understand the working nature and how random forest works, it is essential to recognize what is a decision tree. A decision tree is a graphical structure that uses a branching method to show every possible outcome or result of a decision. The structure includes the top node or the root node that represents the attribute with the most substantial information gain, branches that represent the outcome of a test, the internal node that represents the test on an attribute or feature, and leaf nodes that hold a class label. Fig. 4 illustrates the components of a decision tree.
1236 𝐸𝑛𝑡𝑟𝑜𝑝𝑦 = −𝑝
𝑝 + 𝑛𝑙𝑜𝑔2 𝑝 𝑝 + 𝑛 −
𝑛 𝑝 + 𝑛𝑙𝑜𝑔2
𝑛 𝑝 + 𝑛
I Attribute = p i +ni
p + n Entropy(A)
Information Gain = Entropy(S) – I(Attribute)
Decision trees are learning methods that can handle both discrete and continuous variables. Classification trees and regression trees are the two main types of decision trees used in data mining. There are different types of decision tree algorithms, and the more popular ones are ID3(Iterative Dichotomiser 3),
C4.5, CART (Classification and Regression Tree), CHAID (Chi-square Automation Interaction Detection), and MARS (Multivariate Adaptive Regression Splines).ID3 by J. R. Quinlan is the core algorithm for building decision trees. ID3 is used to create a decision tree from a dataset. ID3 employs a top-down, greedy search through the given attributes or features of the dataset, where each feature at every node is evaluated or tested, and the algorithm chooses the attribute or feature that is best for classification of a set [22]. To decide what feature is best to choose to generate a decision tree, ID3 uses entropy function and information gain. In creating a decision tree, the best attribute that classifies the training data is chosen as the root node. In selecting the best attribute of the training data, the entropy (amount of uncertainty in a dataset), average information, and information gain (the difference in entropy before and after splitting dataset on attribute ―A‖) are calculated using the following equations.
Entropy: (1)
Where:
p is the number of positive examples n is the number of negative examples
Average Information: (2)
Information Gain: (3)
2.3.2 The Random Forest Classifier
Leon Breiman developed random Forest in 2001. Random forest is an ensemble tree-based learning. It is a supervised machine learning technique used for classification and regression tasks. As the name suggests, the random forest algorithm creates a forest with numerous decision trees and averages predictions over many individual trees. Random Forest classifier uses bagging and random subspace method in building each tree to create an uncorrelated forest of trees. The final decision or prediction is made based on the majority of votes from each of the decision tree nodes. Random Forest uses bootstrap aggregating or bagging to reduce the risk of overfitting and the required training time.
2.3.3 Building the Random Forest Prediction Model
This learning model uses two key concepts that give to this model the name random: 1.) random sampling of training data when building trees and 2.) random subsets of variables or features considered when splitting nodes. The prediction model is created in two phases, as presented in the next section.
Phase 1: Algorithm for Building the Random Forest Input: Training set with N samples and M features Output: A Forest of Decision Trees
1. Create a bootstrap dataset that is the same size as the original by randomly selecting samples from the original dataset.
2. Create a decision tree using the bootstrapped dataset, but only use a random subset of features at each step. Do the following steps to create the decision tree:
2.1 Randomly choose ―m‖ features from total ―M‖ features or attributes, where ―m‖ is less than ―M."
2.2 Determine node ―d‖ from the selected ―m‖ features, applying the best split point.
2.3 Form the child nodes of node ―d‖ using the best split. 2.4 Repeat steps 2.1 to 2.3 until leaf or terminal nodes
are formed.
3. Generate random forest by iterating Steps 1 to 3 for "n" times to form a forest with an "n" number of trees. Create a new bootstrapped dataset and build a tree considering a subset of features or variables at each step.
Phase 2: Algorithm for the Random Forest Prediction
Once the random forest classifier is trained, the final prediction is made through the following steps:
1. Pass the test features through the rules of each randomly created tree in the generated forest.
2. Calculate the votes for each predicted outcome.
3. Consider the predicted outcome with the highest votes as the final prediction.
The Random Forest Algorithm structure is shown in Fig. 5.
Fig. 5. Random Forest Algorithm Structure Source: Adapted from [23]
Precision A = TPA
(TPA+CBA+CCA)
𝑃recision B = (TP TPB
B+CAB+CCB)
Precision C = (TP TPC
C+CAC+CBC)
Recall A = TP TPA
A+CAB+CAC
Recall B = TP TPB
B+CBA+CBC
Recall C = TPC
TPC+CCA+CCB
2.3.4 Performance Measures
Evaluation metric is a measure to assess the performance of the model. It is used to examine how good the model is. The following classification metrics are used to evaluate the performance of the random forest classifier: confusion matrix, accuracy, precision, recall, F1 measure, and Receiver Operating Characteristics Curve (ROC-Curve). These measures are described in the following section.
1. Confusion matrix is a technique used to summarize the
performance of a classification model concerning some test data [25]. Other forms of performance measures are derived from this matrix. The 3-class matrix is illustrated in Table 2.
TABLE2 CONFUSION MATRIX
PREDICTED
A
C
T
U
A
L A B C
A TPA CAB CAC
B CBA TPB CBC
C CCA CCB TPC
These are the essential concepts in understanding and interpreting the confusion matrix:
True Positive (TP) : positive point classified as positive True Negative (TN) : Negative point classified as negative False Positive (FP) : Negative point incorrectly classified
as positive
False Negative (FN) : Positive point incorrectly classified as negative
The diagonal cell marked with TP in the matrix in Table 2 are the true positive values, which are the correctly identified prediction for each class. The TP of ClassA is shown in Table
3. The true negative is the correctly rejected prediction for a particular class. Table 4 illustrates the true negatives of ClassA.
The false-positive of ClassA is the incorrectly identified
prediction of the class, as illustrated in Table 5. False negatives are the incorrectly rejected for a class. For example, the false-negative values of ClassA are shown in Table 6.
TABLE3
TRUE POSITIVE OF CLASS A PREDICTED
A
C
T
U
A
L
A B C
A TPA CAB CAC
B CBA TPB CBC
C CCA CCB TPC
TABLE4
TRUE NEGATIVE OF CLASS A PREDICTED
A
C
T
U
A
L
A B C
A TPA CAB CAC
B CBA TPB CBC
C CCA CCB TPC
TABLE5
FALSE POSITIVE OF CLASS A
PREDICTED
A
C
T
U
A
L
A B C
A TPA CAB CAC
B CBA TPB CBC
C CCA CCB TPC
TABLE6
FALSE NEGATIVE OF CLASS A PREDICTED
A
C
T
U
A
L
A B C
A TPA CAB CAC
B CBA TPB CBC
C CCA CCB TPC
2. Accuracy refers to the total number of instances that are correctly classified by the classification model. This is calculated as the total number of correct predictions divided by the total of the dataset.
3. Precision is a measure of the correctness of a classifier. This is also called a positive predictive value [26]. This is obtained by the following formula:
(6)
(7)
4. Recall or
Sensitivity is a measure of the completeness of a classifier, also known as true positive rate. The following formulas calculate the recall for each class:
5. F-Measure is the weighted mean of precision and recall. Both the false positives and false negatives are taken into account in this measure.
Accuracy = TPA+TPB+TPC+TN
1238 (11)
Receiver Operating Characteristics Curve (ROC-Curve) is used to visualize the performance of the classifier at all classification thresholds. It is a curve of probability that plots the true positive rate and the false positive rate.
3 R
ESULTS3.1 Data Processing
The dataset was explored and preprocessed. The prepared dataset was split into two sets: training and testing sets. The 70% of the total instances, which is equivalent to 34 instances, is used for model development and training, while 30% of the dataset equivalent to 15 is used for testing and evaluating the performance of the model. Since the dataset used in this study is limited and highly imbalanced as visualized in Fig. 6, the stratified 10-fold cross-validation was used to make sure that this unbalanced dataset has some of each of the three classes and obtains a group of instances that best represents the entire dataset being studied. The testing set is the validation set to make sure that the model is not overfitting. The parameters of the random forest classifier are then tuned to improve the performance of the model.
Fig. 6. The Class Distribution in the Dataset
3.2 Random Tree
Fig. 7 shows two of the decision trees grown by the random forest algorithm with a size of 30 and 29, respectively. The predictions created by the different trees generated in the forest are pooled, and based on the majority vote in each sample, a class is predicted.
Fig. 7. Random Trees Generated by Random Forest Algorithm
3.3 Performance Analysis
Fig. 8 depicts the summary of the stratified 10-fold cross-validation of the training set. The results revealed that 88.24% of the total instances were correctly classified, and the model
misclassified 11.76%. The statistical values indicate that the classifier is efficiently performing across all instances in the dataset. The generated Kappa statistic of 0.82 interprets a strong level of agreement and suggests that 64-81% of the data is reliable [27].
Fig. 8. Summary of the Evaluation of Training Set
Fig. 9 shows the true positive rate, false positive, and the other performance measures of the model. The weighted average at the last row gives a total picture of how well the classifier performed. The high precision and recall values reflected in summary indicate that the model fittingly handles the three classes.
Fig. 9. Detailed Accuracy by Class of Training Set
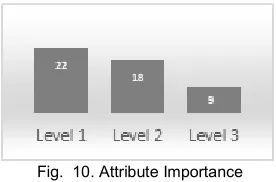
3.4 Important Predictors
Fig. 10 shows the attribute importance based on average impurity decrease and number of nodes using that attribute. The higher the value of the impurity and node columns, the more critical the feature. As exhibited in the table, muscle spasticity and strength are the potent predictors in prognosticating the level of activity of patients with stroke. However, the success of restoring the patient’s optimum level of function is also influenced with the hard skills of therapist as well as their soft skills and the behavior of the patient towards his condition such as his willingness to cooperate in following the PT intervention program either in the clinic or at home and their motivation to be better.
Fig. 10. Attribute Importance
3.5 Assessing the Reliability and Performance of the Developed Predictive Model
The testing set is used to determine the reliability and performance of the developed model. The model correctly classified 73.33% of the test cases. The summary of the
F1=2 x Precision*Recall
evaluation results of the testing set is shown in Fig. 11. Further, the model performed with a weighted average precision of 89.60% in the three classes, recall (or sensitivity) of 88.20%, F-measure of 88.00%, and ROC Area of 0.981.
Fig. 11. Summary of the Evaluation of Testing Set
Using stratified 10-fold cross-validation, the training set was also tested using different classification algorithms. As can be seen in the results presented in Fig. 12, random forest classifier has the highest percentage of correctly classified instances, Kappa statistic, precision, and recall. Further, random forest has the lowest false positive rate compared to the other four classifiers.
Fig. 12. Random Forest and the Other Classifiers
4
C
ONCLUSIONMachine learning techniques can be effectively applied in the healthcare datasets. This paper presented an in-depth application of the random forest algorithm in developing a model with high accuracy in prognosticating the level of activity of a patient with stroke using a dataset with a large number of features. Random forest algorithm has shown outstanding performance in dealing with the multi-class classification problem. In the future, the authors wish to test and assess the performance of the multi-class classifier using a larger dataset. Further study may also be conducted with additional attributes in the set of predictors not included in this study.
A
CKNOWLEDGMENTThe authors would like to express their heartfelt gratitude to the University of Bohol Medical Rehabilitation Center, College of Computer Studies of Cebu Institute of Technology – University, editors, and to the Lord God Almighty, the giver of all blessings.
R
EFERENCES[1] M. Islam, M. Hasan, X. Wang, H. Germack, and M. Noor-E-Alam, ―A Systematic Review on Healthcare Analytics: Application and Theoretical Perspective of Data Mining,‖ Healthcare, vol. 6, no. 2, p. 54, 2018.
[2] J. W. Cortada, D. Gordon, and B. Lenihan, ―IBM Global
Business Services Executive Report The value of analytics in healthcare,‖ 2012.
[3] Alharthi H. Healthcare predictive analytics: An overview with a focus on Saudi Arabia. J Infect Public Health (2018), https://doi.org/10.1016/j.jiph.2018.02.005
[4] C. M. Stinear, W. D. Byblow, S. J. Ackerley, P. A. Barber, and M.-C. Smith, ―Predicting Recovery Potential for Individual Stroke Patients Increases Rehabilitation Efficiency,‖ Stroke, vol. 48, no. 4, pp. 1011–1019, Mar. 2017.
[5] World, ―The top 10 causes of death,‖ Who.int, 24-May-2018. [Online]. Available: https://www.who.int/news-room/fact-sheets/detail/the-top-10-causes-of-death.
[6] M. Katan and A. Luft, ―Global Burden of Stroke,‖ Seminars
in Neurology, vol. 38, no. 02, pp. 208–211, Apr. 2018.
[7] J. C. Navarro, A. C. Baroque, J. K. Lokin, and N. Venketasubramanian, ―The Real Stroke Burden in the Philippines,‖ International Journal of Stroke, vol. 9, no. 5, pp. 640–641, May 2014.
[8] B. Wedro, ―Stroke Warning Signs, Symptoms, Treatment,
Types & Causes,‖ MedicineNet, 2019. [Online]. Available: https://www.medicinenet.com/stroke_symptoms_and_treat ment/article.htm. [Accessed: 29-May-2019].
[9] Heller, A., Wade, D. T., Wood, V. A., Sunderland, A., Hewer, R. L. and Ward, E. (1987). Arm function after stroke: measurement
[10]Kwakkel, G., Kollen, B. J., van der Grond, J. and Prevo, A. J. (2003). Probability of regaining dexterity in the flaccid upper limb: impact of severity of paresis and time since onset in acute stroke. Stroke, 34, 2181-2186.
[11]G. D. Whitiana, Vitriana, and A. Cahyani, ―Level of Activity
Daily Living in Post Stroke Patients,‖ Althea Medical Journal, vol. 4, no. 2, May 2017.
[12]Healthline Editorial Team, ―Everything You Should Know
About Stroke Symptoms,‖ Healthline, 14-Nov-2014.
[Online]. Available:
https://www.healthline.com/health/stroke/symptoms. [Accessed: 15-Oct-2019].
[13]National Institute of Neurological Disorders and Stroke, ―Post-Stroke Rehabilitation Fact Sheet | National Institute of Neurological Disorders and Stroke,‖ Nih.gov, 2014.
[Online]. Available:
https://www.ninds.nih.gov/Disorders/Patient-Caregiver- Education/Fact-Sheets/Post-Stroke-Rehabilitation-Fact-Sheet#disabilities.
[14]J. Adamson, A. Beswick, and S. Ebrahim, ―Is stroke the
most common cause of disability?,‖ Journal of Stroke and Cerebrovascular Diseases, vol. 13, no. 4, pp. 171–177, Jul. 2004.
[15]Kuan-Yi Lia, Keh-Chung Linb,c, Tien-Ni Wanga,b,c, Ching-Yi Wua,∗, Yan-Hua Huangd and Pei OuyangaAbility of three motor measures to predict functional outcomes reported by stroke patients after rehabilitation
[16]Deepa, et al. Health Care Analysis Using Random Forest Algorithm ISSN: 0974-2115
1240 things (IoT),‖ Multimedia Tools and Applications, vol. 78,
no. 14, pp. 19905–19916, Feb. 2019.
[18]A. Sheik Abdullah and R.R.Rajalaxmi A Data mining Model for predicting the Coronary Heart Disease using
Random Forest Classifier
http://dx.doi.or/101109/HICSS.2011.119).
[19]A. Chu et al., ―A decision support system to facilitate
management of patients with acute gastrointestinal bleeding,‖ Artificial Intelligence in Medicine, vol. 42, no. 3, pp. 247–259, Mar. 2008.
[20]R. L. Harvey, ―Predictors of Functional Outcome Following
Stroke,‖ Physical Medicine and Rehabilitation Clinics of North America, vol. 26, no. 4, pp. 583–598, Nov. 2015.
[21]Fayyad, U. M., Piatetsky-Shapiro, G., and Smyth, S. ―From Data Mining to Knowledge Discovery: An Overview.‖ In U. M. Fayyad, G. Piatetsky-Shapiro, P. Smyth, R. Uthurusamy (eds.), Advances in Knowledge Discovery and Data Mining. Menlo Park, Calif.: AAAI Press, 1996, 6.
[22]H. Zhang and R. Zhou, ―The analysis and optimization of
decision tree based on ID3 algorithm,‖ 2017 9th International Conference on Modelling, Identification and Control (ICMIC), Jul. 2017.
[23]I. A. Ibrahim, T. Khatib, A. Mohamed, and W. Elmenreich, ―Modeling of the output current of a photovoltaic grid-connected system using random forests technique,‖ Energy Exploration & Exploitation, vol. 36, no. 1, pp. 132–148, Aug. 2017.
[24]L. Breiman, ―Random Forests,‖ Machine Learning, vol. 45,
no. 1, pp. 5–32, 2001
[25]K. M. Ting, ―Confusion Matrix,‖ Encyclopedia of Machine Learning and Data Mining, pp. 260–260, 2017.
[26]R. Trevethan, ―Sensitivity, Specificity, and Predictive
Values: Foundations, Pliabilities, and Pitfalls in Research and Practice,‖ Frontiers in Public Health, vol. 5, Nov. 2017.
[27]M. L. McHugh, ―Interrater reliability: the kappa
![Fig. 5. Random Forest Algorithm Structure Source: Adapted from [23]](https://thumb-us.123doks.com/thumbv2/123dok_us/8633425.1423133/4.612.318.552.364.572/fig-random-forest-algorithm-structure-source-adapted.webp)