Diabetic Retinopathy Detection Using Matlab
Hamood Ali Hamood Al shamaly, Sumesh E P, Vidhyalavanya R, Jayakumari C
Abstract: Diabetic Retinopathy (DR) has been considered to be the most menacing eye related disease which causes blindness or vision loss in a long run. This disease, usually spread to people who are affected by diabetes. Thus detecting this disease at first place is mandatory. Diagnosing to be done from medical images has been gaining importance in medical science. However, identifying abnormalities in retinal images are difficult and challenging in medical field. Thus efficient computing methods has to be employed to facilitate the detection of DR from Retinal images. Digital image processing is one such method where it has influence in medical field. In this paper, a DR detection technique, involving digital image processing, has been developed by utilizing retinal image, where fundus image has been obtained from patient’s retina. Here, a MATLAB based system has been utilized for analysing the fundus image that are captured via Peek retina attached on smartphone camera lens. This proposed work aims at segmenting the fundus image into Exudates, Micro aneurysm, Optical Disk and haemorrhage and examine whether the retinal condition is in Proliferative / Non-Proliferative DR stage. To achieve this, additionally, morphological methods such as erosion and dilation have been utilized which enables the MATLAB base system to learn the pixel positioning pattern of the fundus images in order to detect the factors associated with DR. Various performance measures has been utilized in validating the proposed technique. From those performance analysis, we could observe 98% accuracy in detecting PDR and NPDR within 39 seconds (half minute). Though the attainment of accuracy is relatively high, there are further possibilities in improving the detection rate of the system.
Index Terms: Diabetic Retinopathy (DR), Retinal Images, Fundus Image, Image Processing, MATLAB, PDR / NPDR stage, Deep Learning Based AI method.
—————————— ——————————
1.
INTRODUCTION
hole world always concerns much and gives the maximum efforts to the screening procedures contributing to the curable yet dangerous eye ailment like Diabetic Retinopathy. Anyway, many difficulties arose globally whenever trying to implement these kind of procedures for the purpose of identifying and curing those ailments with much precision and accuracy. As a result of these difficulties faced by several countries, numerous of visually diseased persons came across eye ailment in accordance with lack of appropriate cautionary procedures and prior identification of it. Diabetic retinopathy or the diabetic eye is considered as a condition caused due to extreme level of diabetes mellitus. The existence and severity of this neurovascular complication have been linked greatly with the glycemic control level and duration of type I and II diabetes[1].This damaged retinal blood vessel condition now a days leads to new blindness cases in the adults. The earlier DR symptoms are floaters, difficulty in observing colors and complete vision loss. Non proliferative diabetic retinopathy and Proliferative diabetic retinopathy (advanced) are the two kinds of DR. The early diagnosis and detection is a great challenge followed by the unavailability of disease infrastructure. Various global screening plans is developed to decrease the proliferation of optic disorders for the detection and treatment of DR on individual basis. With the several procedures or
precautionary solutions being already available, segmentation of eye-retina region was found to be much contributing towards the earlier diagnosis of the symptoms that the diabetic retinopathy patient faces these days. Following this, OCTA-Optical coherence tomography angiography with progression resolved attributes was proposed [2] for better identification of the retinal region vasculature in identifying hazardous symptoms. Likewise, similar method utilizing OCT-Optical Coherence Tomography [3] produced by B-scans to find and treat the ailments found in the eye-retina. They had considered low pics with lesser resolution for the sake of their study. They deployed many interesting and contributing methodologies for retina ailment identification. Certain issues are presented in existing approaches. They are as follows,
Increased time consumption
Lack of reliability
Inconsistent accuracy
In this proposed system, a DR detection technique has been developed, where the fundus image has been obtained from patient’s retina. Here, a MATLAB based system has been utilized for analyzing the fundus image that are captured via Peek retina attached on smartphone camera lens. This proposed work aims at segmenting the fundus image into Exudates, Micro aneurysm, Optical Disk and hemorrhage and examine whether the retinal condition is in Proliferative / Non-Proliferative DR stage. The primary objectives of the proposed system has been listed below,
To obtain an improved quality of input image via scaling in preprocessing stage.
To improve the accuracy of detecting MAs, exudates, hemorrhages, and optical disc through effective image segmentation approach.
The remaining paper is arranged as follows: in section 2, related works of DR is presented. In section 3, Research methodology is presented. In remaining sections, performance, statistical, comparative analysis are presented. At last, conclusion is presented.
2 RELATED WORKS
There are several methods that have been involved in W
————————————————
Hamood Ali Hamood Al shamaly is currently pursuing masters degree program in electric power engineering in University, Country, PH-01123456789. E-mail: [email protected]
Sumesh E P, Vidhyalavanya R, Jayakumari C is currently pursuing masters degree program in electric power engineering in University, Country, PH-01123456789. E-mail: [email protected]
1231 IJSTR©2019
detecting DR. However, in this research paper, few methodologies like learning-based, feature-based, classification-based, etc. approaches have been discussed. In recent days, deep learning has been gaining importance in various technical applications especially semantic based understanding and image recognition. Gargeya and Leng [4]
developed a robust automated identification approach based on deep learning had been developed for detecting the DR. This methodology utilized the fundus image and further classified them as healthy (no DR) and non-healthy. In this research work, the solutions were completely automated and processed 1000s of diversified fundus images. This had been done in order to provide accurate DR detection and effectively minimize the dependency for the resource based manual analysis over various clinical settings for further care. Morales, et al. [5] developed a digital tool that is utilized for detecting DR in retinal image using a technique called Gabor transform. As the symptoms of DR are asymptotic, it is very difficult in detecting it in early stage. Though the retinography is frequently taken, it has been in poor quality. Thus, a digital tool had been implemented which in turn facilitate the ophthalmologist to provide better diagnosis from DR. This tool used an algorithm based on Gabor transform in MATLAB and provided higher quality of retinography.[6] proposed a technique for segmenting retinal blood vessel using image processing and data mining methodologies. It stated that, the retinal diseases could be identified in retinal vasculature of those retinal images. As manual segmentation is a very tedious process and time consuming, employing computational approaches provide better solution. In this research, image cropping, transformation, filtering, etc. had been done in preprocessing. After feature extraction, k-means clustering approach had been executed in order to group the vessel clusters from non-vessels. The final segmented image is formed by joining the results from clustering and ensemble classification. [7] represented a novel automated detection system to detect DR and Diabetic Maculopathy in retinal fundus images by utilizing fuzzy based image processing techniques. This proposed system comprised of 4 parts namely acquisition, preprocessing, feature extraction, and classification. Additionally, a macular region localization technique had been implemented for detecting Maculopathy. An online novel dataset collection had been represented which has expertise diagnosing process, and its collection. Also, a comparative analysis had been presented where the proposed dataset had been compared with existing retinal fundi image databases for DR purposes.Canche, et al. [8] proposed an automation system for detecting hard exudates in DR images with the standard confidence level which in turn could help the specialists in screening and diagnosing this disease. As these hard exudates are very common in occurrence, it is very essential to detect it in very early stage. This paper also provided an extensive analysis in feature based selection methods. Ratanapakorn, et al. [9] proposed an image processing software for diagnosing the DR in fundus retinal images. Here the feature extraction and severity classification were performed by utilizing the MATLAB R2015a. Along with that, a GUI had been developed using MATLAB GUI toolbox. Here, a collection of 400 fundus images (where 379 – DR images, 21 – normal retinal images) had been used for interpretation. Thought the overall accuracy is 98%, the accuracy of classifying PDR / NPDR is 66.58%. This paper concluded that, it might be a helpful tool in distant rural area
where ophthalmologists are not available. Sisodia, et al. [10]
system where it detects both DR and cataract by using vessel extraction methods from the retinal fundus images. The detection had been done by using classifiers namely Feature based vector machine (FVM), SVM, etc. Karim, et al. [17]
proposed a MATLAB based Neural Network Pattern Recognition Tool (NPRTOOL) for detecting MAs. This identification technique utilized digital image processing of the rear end image of an eye. Initially, preprocessing had been done where color to space conversion, median filtering, zero padding, image segmentation were used. After that, feature extraction had been employed where only preprocessed MA images were sent for determining the pixel value. Once the pixel values were obtained, the NPRTOOL should be executed where it classified the image as absence / presence of MAs.Sarwinda, et al. [18] proposed a texture based feature analysis to diagnose DR. This research work also investigated about the texture based capabilities from retinal images in order to differentiate between DR, Age-related Macular Degeneration (AMD), and normal. In this research, 4 experiments namely DR-AMD, DR-Normal, Multiclass, AMD-Normal were constructed for databases 1) STARE and 2) DIARETDB0. Here, features were selected using Kernel based PCA and they were evaluated using SVM KNN, Naïve Bayes. Overall the conventional methods has some issues, related to accuracy, time consumption, reliability, remain unanswered. In this proposed research, we are presenting the preprocessed retinal images followed by image segmentation in order to provide accurate detection of exudates, hemorrhages, optic disc, and MAs.
3 SECTIONS
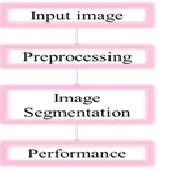
Here the primary block diagram of the research methodology has been depicted in fig. 1. It comprises of 4 modules namely 1) Fundus input image, 2) Image Preprocessing, 3) Image based Segmentation, and 4) Evaluation of Performance. At initial module, the input undergoes acquisition process where the various vision based tasks processes the image. Secondly, pre-processing has to be done in order to attain perfect resolution of the input image. This can be obtained by resizing the inputted image. Thirdly, a novel automated unsupervised blood vessel segmentation based methodology has been utilized to enhance the features of the image. Final module comprises of evaluating the proposed method by using various performance measures. Each and every modules have been explained in further sections.
Fig. 1. Block diagram for proposed system
Fig. 2. Schematic Representation of proposed system
3.1 System Description
Here, the diagrammatic representation of the proposed technique has been represented in fig. 2. The four modules are described as below,
Input Fundus Image
In this research work, two image databases have been utilized namely STARE – STructured Analysis of the Retina [19] and DRIVE – Digital Retinal Image for Vessel Extraction [20]. Here, the former database comprises the quantity of over 20 retinal fundus images, out of that 10 of the images are having pathological cases. A digital camera named TopCon TRV-50 is used for capturing the image at the field view of 350. The captured images should be with 700 x 605 pixel dimensions with 24 bits. The images in STARE are segmented manually where the pixels are named as non-vessel or vessel by two observers. The second observer has labelled the thin vessels, whereas the images labelled by first observer are considered to be the ground truth data and further taken for performance evaluation. This database doesn’t have ROI masks.
1233 IJSTR©2019
Fig. 3. Original colored Retinal image
Image Preprocessing
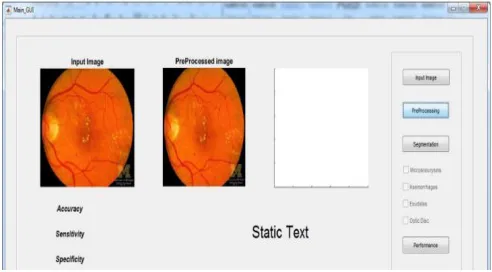
Due to the wide scalable nature of the data sets and large number of image sources, these images are often considered as the artifacts which are not diagnostically applicable. In order to maintain the difficulties of these image variations and to standardize the image, image preprocessing step has to be followed. Initially, the images’ pixel values should be scaled to the value in the range of 0 to 1. Then these scaled images are downsized to a standardized resolution of 512 x 512 pixel dimensions. This can be done by cropping the inner circle of the retina and placing it into a square. As scaling resizes the digital image, it is considered to be the remarkable process in image processing technology. Upon considering the vector based graphical images, the basic image should be resized using the geometrical alterations, without compromising the quality of the image. When considering Raster graphical image, a robust fresh image should be generated with lower or higher quantity of pixels. If the number of pixels are scaled down, then the image might lose its quality. Thus the scaling of image is important in maintaining the image quality. It will enable the image segmentation by segmenting the retinal disorders of the given set of images. The screenshot of the software implementation of captured preprocessed image is depicted in fig. 4.
Fig. 4. Screenshot of captured preprocessed image
Image SegmentationHere, the proposed methodology implements an automated-unsupervised vessel segmentation for the retinal fundi images. The multi-dimensional based feature vector has been developed by utilizing green-channel
intensity.
Fig. 5. Vessel segmentation through green channel extraction
[21]
The so called enhanced intensity features are developed by using morphological operations. In order to extract the green channel from the retinal image, several methods like erosion and dilation are utilized. Figure 5 represents the green channel extraction of blood vessels. In morphological operations dilation and erosion are used, where a collection of reference retinal images have been provided to the detection system. When considering the training phase, the system usually detects the retinal image collections in order to learn a specific image segment pattern. For example, the detection of exudates requires a collection of reference images which contains remarkable quantity of exudates. After the completion of training, the detection system then compare the sample image with neural network algorithm from the training set and it will detect the region of interest (ROI) of exudates in sample retinal images. Finally, the segmented images are detected to get whether they are MAs, Optic Discs, Exudates, and Hemorrhages. Figure 6 represents segmented retinal images. The morphological operations are explained below,
Dilation:
This process will add the pixels to the object’s boundaries in an image. The output pixel value is considered to be the highest value of all the given pixels in the neighborhood. This operation makes the objects to be more visible and can fill in small holes of the objects.
Erosion:
Fig. 6. Segmented Retinal images
4 PERFORMANCE ANALYSIS
The performance of the proposed method has been evaluated using various performance measures namely accuracy, sensitivity, specificity. These measures can be expressed mathematically as follows,
Sensitivity = TP / TP + FN (1)
Specificity = TN / TN + FP (2)
Accuracy = TP + TN / TP + TN + FP + FN (3)
The performance evaluation of the proposed methodology has been recorded and represented in table 1.
TABLE 1
PERFORMANCE MEASURES AND ESTIMATED VALUES OF PROPOSED SYSTEM
Performance Measures
Values ( % )
Accuracy 98.25%
Sensitivity 98.2456%
Specificity 99.9956%
Figure 7 depicts the final segmented detected region along with performance evaluation.
Figure 7: Performance evaluation of proposed method
5 STATISTICAL ANALYSIS
The statistical analysis has been done on approximation of detection accuracy of MAs, Exudates, Hemorrhage, and Optical Disk.
Accuracy Detection of MAs:
TABLE 2
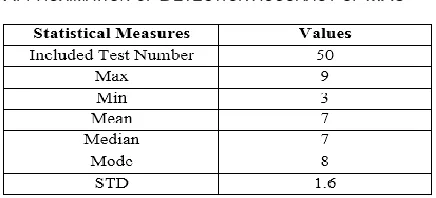
APPROXIMATION OF DETECTION ACCURACY OF MAS
From the table 2, the close approximation accuracy value of detecting MAs is 7, i.e. 71% accuracy. Here the standard deviation is high (1.6), which in turn signifies that it will have higher fluctuation depending on provided image.
Accuracy Detection of Exudates:
TABLE 3
APPROXIMATION OF DETECTION ACCURACY OF EXUDATES
From the table 3, the close approximation accuracy value of detecting Exudates is 7.9, i.e. close to 80% accuracy. Here the standard deviation is high (1.2), which in turn signifies that it will have higher fluctuation between 70-80%.
Accuracy Detection of Hemorrhages:
TABLE 4
APPROXIMATION OF DETECTION ACCURACY OF HEMORRHAGES
From the table 4, the close approximation accuracy value of detecting Hemorrhages is 7.1, i.e. 70% accuracy. Here the standard deviation is high (1.4), which in turn signifies that it will have higher fluctuation between provided image.
1235 IJSTR©2019
Table 5: Approximation of Detection accuracy of Optical Disc.
From the table 5, the close approximation accuracy value of detecting Optical Disc is 7.8, i.e. close to 80% accuracy. Here the standard deviation is low (1.3), which in turn signifies that it will have fluctuation between 70 – 80%.IJSTR style is to not citations in individual brackets, followed by a comma, e.g. ―[1], [5]‖ (as opposed to the more common ―[1, 5]‖ form.) Citation ranges should be formatted as follows: [1], [2], [3], [4] (as opposed to [1]-[4], which is not IJSTR style). When citing a section in a book, please give the relevant page numbers [2]. In sentences, refer simply to the reference number, as in [3]. Do not use ―Ref. [3]‖ or ―reference [3]‖ At the beginning of a sentence use the author names instead of ―Reference [3],‖ e.g., ―Smith and Smith [3] show ... .‖ Please note that references will be formatted by IJSTR production staff in the same order provided by the author.
6 COMPARATIVE ANALYSIS
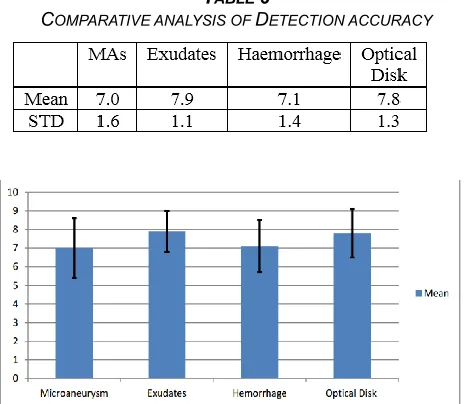
The comparative analysis of the proposed system has been evaluated using comparative measures such as accuracy between detected MAs, Exudates, Hemorrhage, and Optical Disc. The comparative analysis of those detected using mean and STD has been recorded in table 6. Figure 8 represents the comparative analysis of the detection accuracy.
TABLE 6
COMPARATIVE ANALYSIS OF DETECTION ACCURACY
Fig. 8. Comparative analysis of the detection accuracy
From the graphical representation, it has been observed that the detection of optical disc and exudates is way more accurate than the hemorrhage and MAs. On the other hand, when comparing optical disc and exudates, the latter has the minimum STD which indicates the higher accuracy.
Correlation:
Correlation analysis has been evaluated using detection accuracy of MAs, Exudates, Hemorrhages, Optical disc. Table 7 represents the correlation analysis of detection accuracy.
TABLE 7
CORRELATION ANALYSIS OF DETECTION ACCURACY
MAs Exudates Haemorrhages Optical Disc
MA 1 0.502538 0.394738 0.594011
Exudates 0.50253 8
1 0.286269 0.63674
Haemorrha ges
0.39473 8
0.286269 1 0.446716
Optical Disc
0.59401 1
0.63674 0.446716 1
From the table 7, the correlation analysis has been estimated where the detection of exudates and optical disc has remarkable association with MAs detection. When comparing the exudates with optical disc, the exudate is having higher association with optical disc with the correlation coefficient accuracy of 0.6. However, the optical disc and the hemorrhage shares very low association with the optical disc.
ANOVA:
ANOVA analysis is done for the proposed system, where the p-value has been estimated. In order to have the low probability error, the p-value should be low. The analyzed values have been recorded in table 8.
TABLE 8
ANOVA ANALYSIS
Co-eff STD error
T stat
P-value
Lowe r 95%
Uppe r 95%
Intercept -0.24
0.17 5
-1.3 7
0. 1769
-0.59
0. 11
Ophthalmol ogist
1.0 4
0.11 07
9 .39
1. 91E-12
0. 81
0. 26
From the table 8, the p-value of the so called analysis is observed to be 1.91E-12, which is < 0.05. This signifies the lowest probability error.
7 CONCLUSION
image processing to obtain the fundus image from the affected retina. A MATLAB based analysis and classification of the fundus into Exudates, Micro aneurysm, Optical Disk and hemorrhage was done. It also examine the proliferative and non-proliferative stage of DR. For the purpose, morphological operations such as erosion and dilation are implied for the learning of fundus positioning pattern and detection of four eye defects. Different performance analysis validates the proposed mechanism and observed 98% accuracy in the detection of PDR and NPDR within a period of 39 seconds. In spite of the high accuracy achievement, further enhancement promotes the detection rate of the system. In addition to performance analysis, comparative analysis has been estimated where detection accuracy of MAs, Exudates, Hemorrhages, Optical disc have been estimated. Moreover, ANOVA analysis has been done, where the p-value is 0.5 (lower probability error).
REFERENCES
[1] A. W. Stitt, T. M. Curtis, M. Chen, R. J. Medina, G. J. McKay, A. Jenkins, et al., "The progress in understanding and treatment of diabetic retinopathy," Progress in retinal and eye research, vol. 51, pp. 156-186, 2016.
[2] J. Campbell, M. Zhang, T. Hwang, S. Bailey, D. Wilson, Y. Jia, et al., "Detailed vascular anatomy of the human retina by projection-resolved optical coherence tomography angiography," Scientific reports, vol. 7, p. 42201, 2017.
[3] A. Stankiewicz, T. Marciniak, A. Dąbrowski, M. Stopa, P. Rakowicz, and E. Marciniak, "Denoising methods for improving automatic segmentation in OCT images of human eye," Bulletin of the Polish Academy of Sciences Technical Sciences, vol. 65, pp. 71-78, 2017.
[4] R. Gargeya and T. Leng, "Automated identification of diabetic retinopathy using deep learning," Ophthalmology, vol. 124, pp. 962-969, 2017.
[5] Y. Morales, R. Nuñez, J. Suarez, and C. Torres, "Digital tool for detecting diabetic retinopathy in retinography image using Gabor transform," in Journal of Physics: Conference Series, 2017, p. 012083.
[6] R. GeethaRamani and L. Balasubramanian, "Retinal blood vessel segmentation employing image processing and data mining techniques for computerized retinal image analysis," Biocybernetics and Biomedical Engineering, vol. 36, pp. 102-118, 2016.
[7] S. S. Rahim, V. Palade, J. Shuttleworth, and C. Jayne, "Automatic screening and classification of diabetic retinopathy and maculopathy using fuzzy image processing," Brain informatics, vol. 3, pp. 249-267, 2016.
[8] M. Canche, O. Dalmau, and M. García, "Automatic Detection of Hard Exudates in Retinal Images with Diabetic Retinopathy," in 2017 Sixteenth Mexican International Conference on Artificial Intelligence (MICAI), 2017, pp. 53-59.
[9] T. Ratanapakorn, A. Daengphoonphol, N. Eua-Anant, and Y. Yospaiboon, "Digital image processing software for diagnosing diabetic retinopathy from fundus photograph," Clinical Ophthalmology (Auckland, NZ), vol. 13, p. 641, 2019.
[10] D. S. Sisodia, S. Nair, and P. Khobragade, "Diabetic retinal fundus images: preprocessing and feature extraction for early detection of diabetic retinopathy," Biomedical and Pharmacology Journal, vol. 10, pp. 615-626, 2017.
[11] A. Y. Kim, Z. Chu, A. Shahidzadeh, R. K. Wang, C. A. Puliafito, and A. H. Kashani, "Quantifying microvascular density and morphology in diabetic retinopathy using spectral-domain optical coherence tomography angiography," Investigative ophthalmology & visual science, vol. 57, pp. OCT362-OCT370, 2016.
[12] Ö. Deperlıoğlu and U. Köse, "Diagnosis of Diabetic Retinopathy by Using Image Processing and Convolutional Neural Network," in 2018 2nd International Symposium on Multidisciplinary Studies and Innovative Technologies (ISMSIT), 2018, pp. 1-5. [13] ] N. Karami and H. Rabbani, "A dictionary
learning based method for detection of diabetic retinopathy in color fundus images," in 2017 10th Iranian Conference on Machine Vision and Image Processing (MVIP), 2017, pp. 119-122.
[14] S. Kumar and B. Kumar, "Diabetic Retinopathy Detection by Extracting Area and Number of Microaneurysm from Colour Fundus Image," in 2018 5th International Conference on Signal Processing and Integrated Networks (SPIN), 2018, pp. 359-364. [15] K. K. Palavalasa and B. Sambaturu, "Automatic
Diabetic Retinopathy Detection Using Digital Image Processing," in 2018 International Conference on Communication and Signal Processing (ICCSP), 2018, pp. 0072-0076.
[16] S. Chorage and S. S. Khot, "Detection of diabetic retinopathy and cataract by vessel extraction from fundus images," in 2017 International conference of Electronics, Communication and Aerospace Technology (ICECA), 2017, pp. 638-641.
[17] T. Karim, M. S. Riad, and R. Kabir, "Symptom Analysis of Diabetic Retinopathy by Micro-Aneurysm Detection Using NPRTOOL," in 2019 International Conference on Robotics, Electrical and Signal Processing Techniques (ICREST), 2019, pp. 606-610. [18] D. Sarwinda, A. Bustamam, and A. M. Arymurthy, "Fundus image texture features analysis in diabetic retinopathy diagnosis," in 2017 Eleventh International Conference on Sensing Technology (ICST), 2017, pp. 1-5.
[19] "http://cecas.clemson.edu/~ahoover/stare/."
[20] "https://www.isi.uu.nl/Research/Databases/DRIVE/." [21] S. Roychowdhury, D. D. Koozekanani, and K. K.