Performance Evaluation of Various Signal
Processing Techniques in a Tracking Radar
A.Kranthi#1, Ch.Srinivasu#2
#1
M.Tech student, Department of ECE, K L University Vijayawada, INDIA
#2
Department of ECE, K L University Vijayawada, INDIA 1 [email protected] 2 [email protected] Abstract
The resolution is the important parameter of the radar. Here waveform design plays an important role in the radar applications. These waveform designs can be achieved by using signal processing tools like auto correlation and ambiguity function. In this project signal processing techniques have been developed by using above functions. These techniques are most useful in the multi target scenario of the radar. In this project the signals like burst signal, linear frequency modulated (LFM) signals are used for the determination of radar resolution and also these waveforms are implemented in popular codes like “COSTAS”. The three dimensional plots are generated to evaluate both range and Doppler resolution by using ambiguity functions. The results are being presented for the COSTAS code by using LFM signals. The performance of these waveforms is compared with the conventional waveforms.
Keywords: LFM, COSTAS, Ambiguity function.
1. INTRODUCTION
The word radar is an abbreviation for RAdio Detection and Ranging. In general, radar systems we use modulated waveforms and directive antennas to transmit electromagnetic energy into a specific volume in space to search for targets. In this radar the target reflects back is the echo of the object [1, 2]. One fundamental issue in designing a good radar system is its capability to resolve two small targets that are located at long rangewith very small separation between them. This requires a radar system to transmit along pulse which will have enough energy to detect a small target at long range. However, a long pulse degrades range resolution. Hence, frequency or phase modulation of the signal is used to achieve a high range resolution when a long pulse is required.
A commonly used radar or sonar pulse is the linear frequency modulated (LFM) pulse (or "chirp"). It has the advantage of greater bandwidth while keeping the pulse duration short and envelope constant. A chirp is a signal in which the frequency increases ('up-chirp') or decreases ('down-chirp') with time. In some sources, the term chirp is used interchangeably with sweep signal. The linear-FM, or chirp, waveform is the easiest to generate. If a signal is Costas can be performed easily with the help of the difference matrix. The coding sequence, the order of frequencies used, is a concise way to describe the coding matrix. With regard to the difference matrix, note that the top row and the left most column are headings and not part of the matrix.
The element of the difference matrix in row i and column j, is
Di,j=ai+j αj, і+j M
autocorrelation function of the transmit waveform. In addition, the response from a second target or clutter at a slightly different range may appear at the matched-filter output when the desired target response is at its peak value. This overlap of signals occurs when the time extent of the waveform is greater than the differential time delay between the targets. As a result a special set of mathematical functions has evolved to allow interpretation of the output of a signal processor either when there is a target with a significant radial velocity or when multiple targets are present. These functions are called time-frequency autocorrelation functions or ambiguity functions and are based on the text by Woodward [3].A concise definition of the radar ambiguity function, suggested by Sinsky [666] and accepted by the IEEE [356] resolves an inconsistency in the sign convention of this function. This revised convention is used in this edition. The radar ambiguity function quantitatively describes the interference to a reference target caused by a range- and Doppler-shifted second target of equal cross section when using a matched-filter receiver.
The radar ambiguity function is defined as the response of the matched-filter radar receiver to a target displaced in range delay T and Doppler frequency u from a reference target. The response is measured at the instant in time when the reference target is at its maximum value. The ambiguity function is therefore closely related to the matched filtered output waveform. In fact it is simply the squared magnitude of the time-reversed matched-filter response.
For a given complex baseband pulse s(t), the narrowband ambiguity function is given by χ (τ,f)= ∞∞s t s t τ e π dt.
Range Resolution: Is the ability of a radar system distinguished between two or more targets on the same bearing but at different ranges. The degree of range resolution depends on the width of the transmitted pulse, the types and sizes of targets, and the efficiency of the receiver and indicator. Pulse width is the primary factor in range resolution.
The theoretical range resolution of a radar system can be calculated from the following formula:-
/2
Doppler Resolution: Is the minimum separation in targets radial velocities that can be distinguished by the radar receiver. This resolution is fundamentally related to coherent integration time of radar
2∆ /
Where Δvr is the radial velocities, λ is the radar wavelength;
3. LFM
Fig 1: Linear Frequency Modulation
The complex envelope of a linear-FM pulse is given by
1
√ exp
A complete description of a linear FM requires that at least three parameters be known: the duration and the FM’s start and end frequencies. The change in over time (“t” in ms) defines the slope of a linear FM, such that slope=f(t2)-f(t1)/(t2-t1).i.e., frequency bandwidth/duration. In speech sounds, slope of the formant transition is equivalent to slope of an FM and may be measured in Hz/ms.
In this pulse compression technique the LFM signal are one of the techniques are used in the radar signals.
Pulse compression is a signal processing technique mainly used in radar, sonar and echography to increase the range resolution as well as the signal to noise ratio. This is achieved by modulating the transmitted pulse and then correlating the received signal with the transmitted pulse.
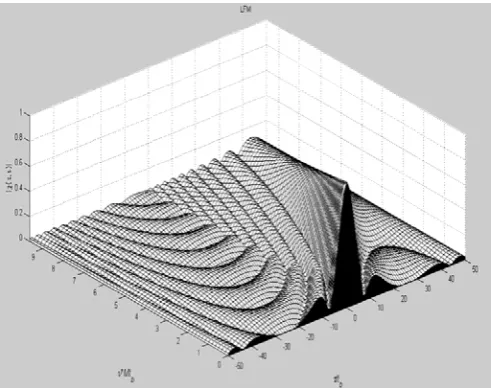
In this LFM the ambiguity plot is important because from the plot we can determine the range resolution, Doppler resolution and peak side lobe ratio.
The ambiguity plot is as shown in fig.
Fig 2: Ambiguity plot of LFM signal
4. COSTAS
Difference matrix
aj 4 7 1 6 5 2 3
i=1 3 -6 5 -1 3 1
i=2 -3 -1 4 -4 -2
i=3 2 -2 1 -3
i=4 1 -5 2
i=5 -2 -4
i=6 -1
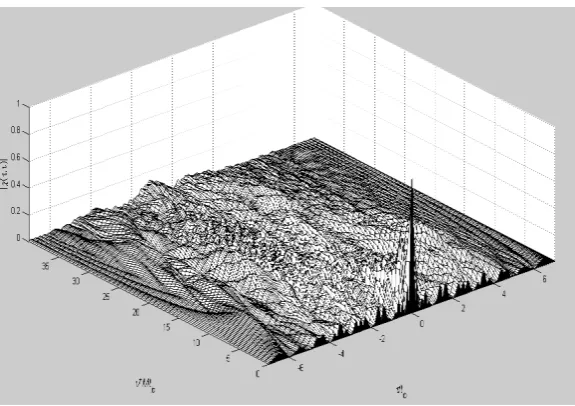
The ambiguity function of the Costas signal
Fig 3: Ambiguity plot of COSTAS signal
5. COSTAS WITH LFM
Costas sequences are optimum discrete signals with good correlation characteristic. Coding with Costas is combined with LFM signal to generate LFM-Costas radar signal. The ambiguity function is analyzed.
Fig 4: Costas with LFM signal
Fig 5: Ambiguity plot of COSTAS with LFM signal.
Costas code with LFM is having the 2 different sweep rates, their ambiguity plot are
Fig 7: Ambiguity plot of Costas with LFM signal with 2nd sweep rate
6. CONCLUSION
In this work find the waveform design of radar by using different signal processing techniques like burst signal, LFM signal, and Costas signal and Costas with LFM. Costas is a frequency coding technique multiple frequency signals are transmitted according to the code that we are using.LFM signal is a Linear Frequency Modulation signal even it has the great resolution but power is lost due to the ridges.
Presently Costas code and Costas with LFM is being implemented using un-modulated sine wave with different sweep rates.
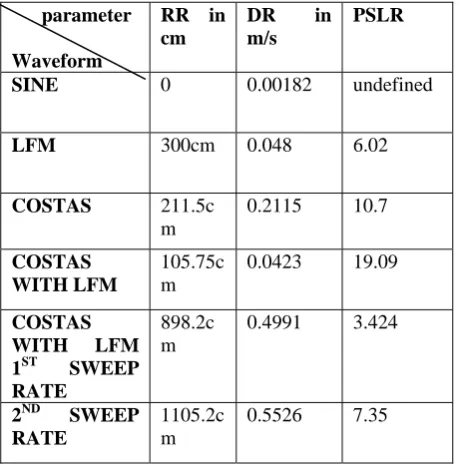
By calculating the above parameters, Costas with LFM signal is having the low range resolution, low Doppler resolution and high peak side lobe ratio. so it is the best technique that we are using for the target detection. parameter Waveform RR in cm DR in m/s PSLR
SINE 0 0.00182 undefined
LFM 300cm 0.048 6.02
COSTAS 211.5c
m 0.2115 10.7 COSTAS WITH LFM 105.75c m 0.0423 19.09 COSTAS WITH LFM 1ST SWEEP RATE
898.2c m
0.4991 3.424
2ND SWEEP RATE
1105.2c m
0.5526 7.35
Table 1: Performances of different signal in range resolution, Doppler resolution and peak side lobe ratio.
REFERENCES
[1] Bassem R. Mahafza, Ph. D., Radar Systems Analysis and Design Using MATLAB, Chapman & Hall/Crc, 2000.
[2] Skolnik, M., Introduction to Radar Systems, 3rd Edition, McGraw Hill, Boston, 2001.
[3] Woodward. P. M., ‘Radar ambiguity analysis’, Technical note 731, Royal Radar Establishment, Malvern, England, UK, 1967.
[4] Solomon W. Golomb, Herbert Taylor, “Constructions and Properties of Costas Arrays”, Proc. IEEE, Volume: 72, no.9, Page(s):
1143-1163, Sep. 1984.
[5] Fernando L Taboada, Venezuela Army, “ Detection And Classification of Low Probability of Intercept Radar Signals Using Parallel
Authors profile
1. A.Kranthi was born in Guntur (Dist.), AP.India. She received B.Tech in Electronics & Communication Engineering from Mekapati Raja Mohan Reddy Institute of Technology and Sciences (MeRITS), Nellore (Dist.,), AP, India. Pursuing M.Tech in C&R at K L University, Vijayawada, AP, India.