Open Access
Research article
Assessing newborn body composition using principal components
analysis: differences in the determinants of fat and skeletal size
Beverley M Shields*
1, Bridget A Knight
1,2, Roy J Powell
3,
Andrew T Hattersley
1and David E Wright
4Address: 1Peninsula Medical School, Barrack Road, Exeter, UK, 2Heavitree Hospital, Royal Devon and Exeter NHS Foundation Trust, Exeter, UK, 3Research and Development Support Unit, Royal Devon and Exeter NHS Foundation Trust Exeter, UK and 4School of Mathematics and Statistics, University of Plymouth, Plymouth, UK
Email: Beverley M Shields* - [email protected]; Bridget A Knight - [email protected]; Roy J Powell - [email protected]; Andrew T Hattersley - [email protected]; David E Wright - [email protected]
* Corresponding author
Abstract
Background: Birth weight is a composite of skeletal size and soft tissue. These components are
likely to have different growth patterns. The aim of this paper is to investigate the association between established determinants of birth weight and these separate components.
Methods: Weight, length, crown-rump, knee-heel, head circumference, arm circumference, and
skinfold thicknesses were measured at birth in 699 healthy, term, UK babies recruited as part of the Exeter Family Study of Childhood Health. Corresponding measurements were taken on both parents. Principal components analysis with varimax rotation was used to reduce these measurements to two independent components each for mother, father and baby: one highly correlated with measures of fat, the other with skeletal size.
Results: Gestational age was significantly related to skeletal size, in both boys and girls (r = 0.41
and 0.52), but not fat. Skeletal size at birth was also associated with parental skeletal size (maternal: r = 0.24 (boys), r = 0.39 (girls) ; paternal: r = 0.16 (boys), r = 0.25 (girls)), and maternal smoking (0.4 SD reduction in boys, 0.6 SD reduction in girls). Fat was associated with parity (first borns smaller by 0.45 SD in boys; 0.31 SD in girls), maternal glucose (r = 0.18 (boys); r = 0.27 (girls)) and maternal fat (r = 0.16 (boys); r = 0.36 (girls)).
Conclusion: Principal components analysis with varimax rotation provides a useful method for
reducing birth weight to two more meaningful components: skeletal size and fat. These components have different associations with known determinants of birth weight, suggesting fat and skeletal size may have different regulatory mechanisms, which would be important to consider when studying the associations of birth weight with later adult disease.
Background
Birth weight, conventionally used as a measure of fetal growth, is a composite of many components including,
bone, internal organs, muscle, fat and fluids. These may be determined by different regulatory mechanisms, both environmental and genetic. It has been suggested that
fat-Published: 17 August 2006
BMC Pediatrics 2006, 6:24 doi:10.1186/1471-2431-6-24
Received: 26 April 2006 Accepted: 17 August 2006
This article is available from: http://www.biomedcentral.com/1471-2431/6/24
© 2006 Shields et al; licensee BioMed Central Ltd.
mass reflects the intra-uterine environment, whereas fat-free mass is more likely to be altered by genetic factors [1,2].
A major determinant of body composition at birth is gen-der. Males tend to be longer and heavier than females, but females have more subcutaneous fat [1,3-5]. Other factors known to influence body composition include parity and maternal BMI which have stronger associations with measures of fat at birth than measures of skeletal size [1,2], and maternal [2,6] and paternal [1,7,8] height which are more associated with skeletal size. The effects of smoking are less clear with some studies reporting a reduction only in skeletal measures as a result of maternal smoking [7,9-12], whereas others find a general decrease in all aspects of growth [13-15].
Identifying factors related to fetal growth has become an important part of the study of the developmental origins of adult disease. Relationships between low birth weight and later ill health such as diabetes, cardiovascular dis-ease, stroke, and obesity, are well established [16-19]. Not only is birth weight seen to be important, but also how thin, or how short, the baby is [20-22]. Considering com-ponents of birth weight separately, and investigating their determinants, may give more insight into these associa-tions.
There are various methods of obtaining measures of body composition in utero and at birth. Studies have used DEXA scans [7,23,24], ultransonography [25-27], and total body electrical conductivity [9,28]. These methods require expensive equipment, specialist training, and the more accurate methods are likely to be difficult to do in large samples. A simpler method for assessing body com-position at birth is for midwives to take detailed anthro-pometry using standardized techniques, which can provide information on different aspects of growth. These measurements can be analysed individually [2,5,13,14,29]. However, often these measurements tend to be highly intercorrelated leading to problems of multi-collinearity in regression analysis. Careful decisions, therefore, need to be made as to which measurements are the most appropriate and convey most information describing the aspect of growth of interest. A method able to combine them to provide more general estimates of size and body composition (as DEXA and ultrasonogra-phy do) would have considerable advantages. Mathemat-ical equations to obtain estimates of body composition have been used previously, but these equations are not internally derived [1,30].
An alternative way of summarizing body size and compo-sition using anthropometric measurements could be to use principal components analysis (PCA) [31], a method
previously used to describe different aspects of birth size [10,23,32,33]. This statistical approach can be used to investigate the underlying structure of a dataset, by reduc-ing the data to meanreduc-ingful components. This method ena-bles a large number of correlated variaena-bles to be summarized in terms of a relatively small number of uncorrelated principal components. The extent to which the principal components capture the variation in the original variables can be quantified in terms of the pro-portion of variance explained. The components can aid interpretation and represent meaningful constructs that parsimoniously describe the multivariate data.
We used principal components analysis to reduce multi-variate measurements at birth to two more meaningful independent components representing different aspects of birth size: skeletal size and fat. We examined their rela-tionships with established determinants of birth weight.
Methods
a) Subjects and methods
Families were recruited as part of the Exeter Family Study of Childhood Health [34], a large prospective study inves-tigating genetic influences on fetal and early childhood growth. Parents were approached at the time of the ante-natal booking visit and invited to take part if they were Caucasian and living in central Exeter, as defined by post-code. Multiple pregnancies and women with diabetes were excluded. Both parents were required for the study. Informed written consent was obtained from the parents of the newborns and the study was approved by the North and East Devon Local Research Ethics Committee. In this paper we report the results of the first 800 families recruited between March 2000 and July 2003.
Babies were measured in detail within 24 hours of birth, in triplicate, by specially trained research midwives who underwent periodic inter-observer comparisons to ensure reliability and comparability. Birth weight was measured using a Soenhle scale and birth length was measured using the Harpenden Infantometer. Knee/heel length was meas-ured using simple vernier calipers (to nearest 1 mm), and head and arm circumference with a short fiberglass tape (to nearest 1 mm). Skinfold thicknesses of the tricep and subscapular were taken using Holtain skinfold calipers (to nearest 0.2 mm).
Detailed anthropometric measurements were taken on both parents at 28 weeks gestation by the research mid-wives. Weight was measured using Tanita electric scales (to nearest 0.1 kg). A Harpenden pocket stadiometer was used for height and sitting-height measurements, and simple vernier calipers (to nearest 0.1 cm) were used for knee-heel length. Head and arm circumference were measured using a short, non-stretchable fiberglass tape (to nearest 0.1 cm), and a strong fiberglass tape (range up to 150 cm) was used for waist and hip measurements in the father. Skinfold thicknesses of the bicep, triceps and sub-scapula, plus the suprailiac in the father only were taken on the non-dominant side of the body (to nearest 0.2 mm using Holtain skinfold calipers). Coefficient of variation (CV) between midwives was less than 1% for weight and linear measures, and less than 5% for measures of skin-fold thickness.
Fasting plasma glucose concentration was measured in the mother, also at 28 weeks gestation, using standard lab-oratory methods carried out by the pathology laboratories at the Royal Devon & Exeter Hospital, Exeter, UK.
b) Statistics
Distributions of individual variables were assessed for normality and in the case of skinfold thicknesses and weight, log transformations were applied. For these varia-bles, geometric means are presented.
Principal components analysis was carried out on the anthropometric measurements from both parents and their babies at birth. The components analysis was based on correlation matrices rather than covariance matrices as the variables were on different scales of measurement. Varimax rotation was applied to transform the original principal components produced, to ease interpretation. This method searches for a linear combination of the orig-inal measurements aiming to maximize the variance of the component loadings, leading to high correlations with some of the original variables, and low correlations with others. As the associations between the rotated com-ponents and the original variables are on scales of 0 to 1, it becomes easier to define them.
Interpretable principal components scores were produced summarizing the multivariate data in terms of standard-ized variables with zero mean and standard deviation of one. Recognising the differences in anthropometry between the sexes, boys and girls were analysed sepa-rately. Components were also produced for both parents.
T tests were used to examine the effect of parity (primipa-rous or multipa(primipa-rous) and smoking. Pearson correlation coefficients were used to assess relationships of birth com-ponents with gestation, maternal fasting glucose, and
parental size components. Multiple linear regression anal-ysis was applied to determine independent predictors of the birth components.
Results
a) Study cohort (Fig 1)
Disposition of the 800 families initially recruited into the EFSOCH study is presented in Figure 1. The analysis pre-sented in this paper focuses on the 752 healthy full term babies. Full anthropometric data were unavailable for 53 (7%) of these babies. There was no evidence of any differ-ences in birth weight and gestation between those with measures available and those without (birth weight: 3521 g v 3511 g, p = 0.893, respectively; gestation: 40.2 wks v 39.9 wks, p = 0.101, respectively).
The babies' birth anthropometry is summarized in Table 1. Boys were heavier and longer than girls, but girls had greater skinfold thicknesses and ponderal index.
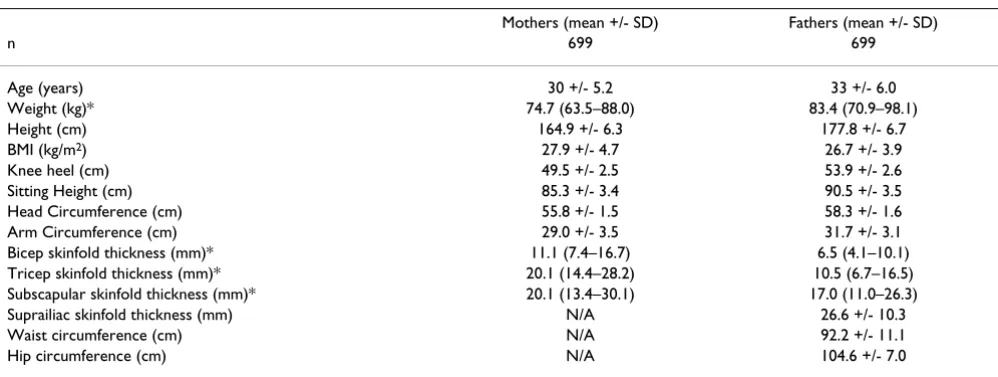
Table 2 shows the characteristics of the parents. Mothers had a mean age of 30 years and a mean reported pre-preg-nant BMI of 24 kg/m2. 88 (12.6%) of mothers smoked.
299 (42.8%) were primiparous. Fathers had a mean age of 33 years with a mean BMI of 27 kg/m2.
b) Principal components analysis
All birth measures were entered into a principal compo-nents analysis. In each case the birth measurements were reduced to two components.
Flow diagram showing families selected for analysis
Figure 1
Flow diagram showing families selected for analysis.
752 healthy full term deliveries 13 families excluded prior to
birth
8 non-Caucasian fathers 1 diabetic mother 1 intra-uterine death 3 moved out of area
35 excluded post delivery 31 premature
2 postnatal growth problems 1 cerebal palsy
1 chromosomal abnormalities
53 missing birth measures 30 not informed of delivery 4 delivered outside Exeter 1 home birth
7 on neonatal unit
2 difficult to measure as breach 9 fewer measurements taken at start
699 with all anthropometric measurements 787 births
The principal components analyses, showing the unro-tated components for boys and girls, are given in Table 3. In both boys and girls, the first unrotated principal com-ponent (B1 and G1), which individually explained the largest proportion of variance possible, had the strongest correlation with birth weight and was highly correlated with all measures of birth size. This can be interpreted as a general measure of birth size and it explained 61.7% and 65.4% of the variance for boys and girls, respectively. The second unrotated principal component (B2 and G2) was also similar in boys and girls and showed negative corre-lations with measures of skeletal size and positive correla-tions with measures of fat, and we interpreted the contrast in this component as representing body composition, explaining 15.7% and 13.2% of the variance, respectively. In both boys and girls, the two components together explained almost 80% of the variation in the original 8 variables.
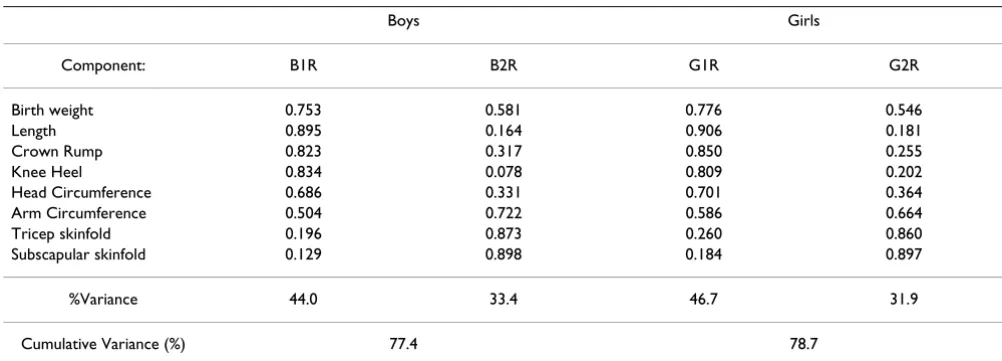
These components failed to capture clinically distinct con-structs, therefore, varimax rotation was performed (Table 4). This rotated analysis led to the identification of 2 com-ponents for both boys and girls, explaining the same cumulative variance as the components from the first analysis. Component 1 (B1R and G1R) has high correla-tions with the skeletal measurements of length, crown-rump and knee heel (r = 0.82-0.90), and low correlations with tricep and subscapular skinfold thicknesses (fat measures) (r = 0.13-0.20). Therefore, we interpreted this component as a "skeletal size" component. This is in con-trast to the second rotated component produced (B2R and G2R) which has high correlations with the skinfold thick-nesses (r = 0.85-0.90) and low correlations with measures of skeletal size (r = 0.18-0.26), which we interpreted as a "fat" component. Birth weight and arm circumference have high correlations (r > 0.5) with both components in the boys and girls analyses and this fits in with our
inter-Table 1: Characteristics of EFSOCH babies at birth.
Boys (mean +/- SD) Girls (mean +/- SD) p
n 363 336
Gestation (weeks) 40.1 +/- 1.14 40.2 +/- 1.27 0.1
Weight (g) 3559 +/- 461 3479 +/- 482 0.02
Length (cm) 50.5 +/- 2.0 49.7 +/- 2.1 <0.001
Crown rump (cm) 34.1 +/- 1.6 33.7 +/- 1.7 0.001
Knee heel (cm) 12.6 +/- 0.6 12.4 +/- 0.6 0.001
Head circ (cm) 35.5 +/- 1.2 34.9 +/- 1.3 <0.001
Arm circ (cm) 11.1 +/- 0.9 11.1 +/- 0.9 0.9
Tricep (mm)* 4.6 (3.7–5.8) 4.8 (3.8–6.1) 0.005
Subscapula (mm)* 4.7 (3.7–6.0) 4.9 (3.8–6.2) 0.005
Ponderal index (kg/m3) 27.5 +/- 2.6 28.1 +/- 2.6
*Log transformed data – geometric mean and SD range reported
Table 2: Characteristics of parents in EFSOCH.
Mothers (mean +/- SD) Fathers (mean +/- SD)
n 699 699
Age (years) 30 +/- 5.2 33 +/- 6.0
Weight (kg)* 74.7 (63.5–88.0) 83.4 (70.9–98.1)
Height (cm) 164.9 +/- 6.3 177.8 +/- 6.7
BMI (kg/m2) 27.9 +/- 4.7 26.7 +/- 3.9
Knee heel (cm) 49.5 +/- 2.5 53.9 +/- 2.6
Sitting Height (cm) 85.3 +/- 3.4 90.5 +/- 3.5
Head Circumference (cm) 55.8 +/- 1.5 58.3 +/- 1.6
Arm Circumference (cm) 29.0 +/- 3.5 31.7 +/- 3.1
Bicep skinfold thickness (mm)* 11.1 (7.4–16.7) 6.5 (4.1–10.1)
Tricep skinfold thickness (mm)* 20.1 (14.4–28.2) 10.5 (6.7–16.5)
Subscapular skinfold thickness (mm)* 20.1 (13.4–30.1) 17.0 (11.0–26.3)
Suprailiac skinfold thickness (mm) N/A 26.6 +/- 10.3
Waist circumference (cm) N/A 92.2 +/- 11.1
Hip circumference (cm) N/A 104.6 +/- 7.0
pretation of the components as they are measurements of both skeletal size and fat. More of the variation in the skel-etal size component could be explained by the variables entered into the principal components analysis compared with the fat component (44% and 46.7% v 33.4% and 31.9%).
To further explain the method of varimax rotation, figure 2 shows plots of the unrotated and rotated component loadings for the child's birth measurements. It can clearly be seen that the relative location of the points on the
rotated solution remains the same, but the axes have been rotated so that the variance of the coefficients is maxim-ised. The "fat" measures are closest to the y axis, whereas the "skeletal" measures are closest to the x axis.
Principal Components Analysis was also used to reduce the anthropometric measurements in the parents (Rotated components matrix shown in Table 5). Compo-nents similar to the babies' were produced, but this time the fat component in both mothers and fathers (M2 and F2) explained more of the variance in the measurements
Table 3: Unrotated components matrix for principal components analysis of boys' and girls' birth anthropometry.
Boys Girls
Component: B1 B2 G1 G2
Birth weight 0.951 -0.012 0.949 -0.027
Length 0.803 -0.426 0.834 -0.398
Crown Rump 0.842 -0.262 0.834 -0.305
Knee Heel 0.702 -0.456 0.769 -0.322
Head Circumference 0.743 -0.166 0.780 -0.129
Arm Circumference 0.843 0.254 0.867 0.181
Tricep skinfold 0.696 0.564 0.723 0.533
Subscapular skinfold 0.658 0.625 0.684 0.608
Variance (%) 61.7 15.7 65.4 13.2
Cumulative Variance (%) 77.4 78.7
Values shown are component loadings (correlation coefficients of the relationship between the components produced (B1, B2, G1 and G2) and the individual measurements). B1 represents the first unrotated component produced for the boys, B2 represents the second unrotated component produced for the boys. G1 represents the first unrotated component produced for the girls, G2 represents the second unrotated component produced for the girls. Variance is the percentage variance explained by each component. Cumulative Variance indicates the variance explained by both components together.
Table 4: Varimax rotated components matrix for principal components analysis of boys' and girls' birth anthropometry.
Boys Girls
Component: B1R B2R G1R G2R
Birth weight 0.753 0.581 0.776 0.546
Length 0.895 0.164 0.906 0.181
Crown Rump 0.823 0.317 0.850 0.255
Knee Heel 0.834 0.078 0.809 0.202
Head Circumference 0.686 0.331 0.701 0.364
Arm Circumference 0.504 0.722 0.586 0.664
Tricep skinfold 0.196 0.873 0.260 0.860
Subscapular skinfold 0.129 0.898 0.184 0.897
%Variance 44.0 33.4 46.7 31.9
Cumulative Variance (%) 77.4 78.7
than the skeletal size component (M1 and F1) (43.4 and 48.1% v 30.8 and 25.9%). The parents' components were more distinct with the lowest correlation coefficients being negative and close to zero, and the highest being greater than 0.9.
c) Associations with skeletal size and fat at birth
The rotated components at birth were examined for asso-ciations with characteristics known to be associated with birth weight.
i) Categorical variables: birth order and smoking
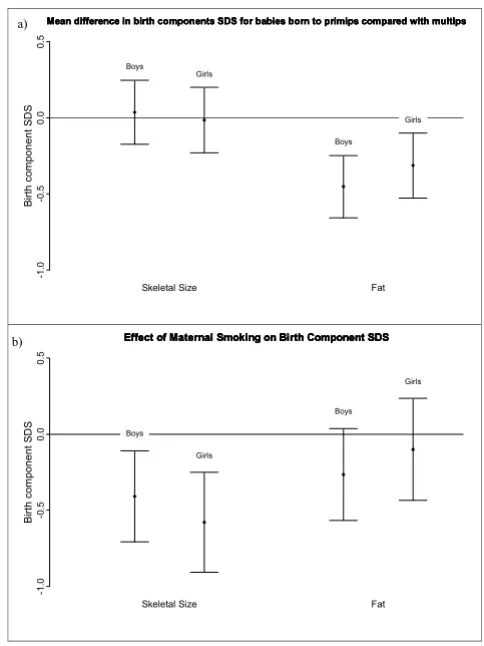
Parity was associated with the fat component but not the skeletal size component in both boys and girls (Fig. 3a),
with babies born to primips having less fat than babies born to multips (first born babies: 0.45 SD (95%CI: 0.24– 0.66) lower in boys, p < 0.001; 0.31 SD (95%CI: 0.10– 0.53) lower in girls, p = 0.004). Maternal smoking during pregnancy resulted in a reduction in the skeletal size com-ponent (0.41 SD (95% CI: 0.10–0.72) decrease for boys (p = 0.008) and 0.58 SD (95%CI: 0.24–0.91) decrease for girls (p < 0.001)) but there was no significant effect on fat for both boys and girls (Fig. 3b).
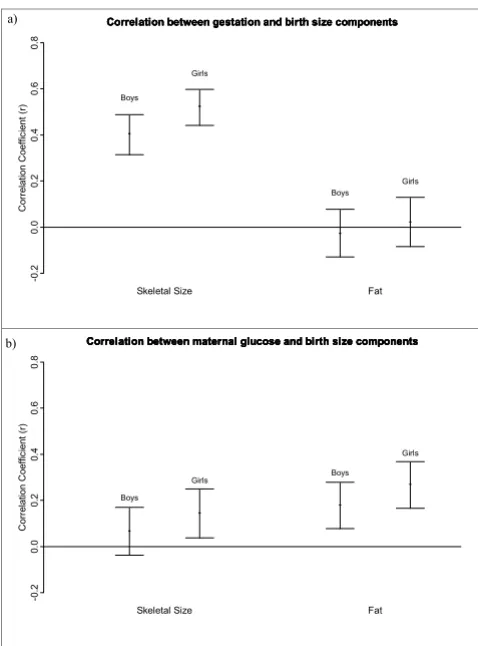
ii) Continuous variables: gestation, maternal glucose and parental size
Gestation was associated with only the skeletal size com-ponent in both boys and girls (r = 0.41 and r = 0.52, Figure 3a shows the mean difference and 95% confidence intervals for birth skeletal size and birth fat components, expressed as standard deviations, for babies born to primips compared with babies born to multips, boys and girls shown separately
Figure 3
Figure 3a shows the mean difference and 95% confidence intervals for birth skeletal size and birth fat components, expressed as standard deviations, for babies born to primips compared with babies born to multips, boys and girls shown separately. Fig. 3b shows the mean difference and 95% confi-dence intervals for birth skeletal size and birth fat compo-nents, expressed as standard deviations, for babies born to smoking mothers, compared with non-smoking mothers, boys and girls shown separately. Birth component score is an internally derived standard deviation score from the principal components analysis. B irt h c o mp one nt S D S
Skeletal Size Fat
-1 .0 -0 .5 0 .0 0 .5
Mean difference in birth components SDS for babies born to primips compared with multips Mean difference in birth components SDS for babies born to primips compared with multips Mean difference in birth components SDS for babies born to primips compared with multips Mean difference in birth components SDS for babies born to primips compared with multips
Boys Girls Boys Girls B irt h c o mp one nt S D S
Skeletal Size Fat
-1 .0 -0 .5 0 .0 0 .5
Effect of Maternal Smoking on Birth Component SDS Effect of Maternal Smoking on Birth Component SDS Effect of Maternal Smoking on Birth Component SDS Effect of Maternal Smoking on Birth Component SDS
Boys Girls Boys Girls a) b)
Scatterplots of the component loadings for the a) unrotated and b) rotated principal components analysis of the child's birth measurements
Figure 2
Scatterplots of the component loadings for the a) unrotated and b) rotated principal components analysis of the child's birth measurements. -1 -0.8 -0.6 -0.4 -0.2 0 0.2 0.4 0.6 0.8 1
-1 -0.5 0 0.5 1
subscapula tricep arm circ weight head circ crown rump knee heel length -1 -0.8 -0.6 -0.4 -0.2 0 0.2 0.4 0.6 0.8 1
-1 -0.5 0 0.5 1
subscapula tricep arm circ weight head circ crown rump knee heel length -1 -0.8 -0.6 -0.4 -0.2 0 0.2 0.4 0.6 0.8 1
-1 -0.8 -0.6 -0.4 -0.2 0 0.2 0.4 0.6 0.8 1 subscapula tricep arm circ weight head circ crown rump knee heel length -1 -0.8 -0.6 -0.4 -0.2 0 0.2 0.4 0.6 0.8 1
respectively), but not the fat component (r = -0.03 and 0.02) (Fig. 4a). Maternal glucose was significantly corre-lated with both components in girls (r = 0.15 for fat and r = 0.27 for skeletal size), but only fat (r = 0.18) in boys (Fig 4b).
Table 6 shows the relationship between the birth size components and parents' size components. The skeletal size component in both parents was associated with the birth skeletal size component in both boys and girls (r = 0.16-0.39), although the association between paternal and boys' skeletal size did not quite reach significance when Bonferroni adjustments were made for multiple testing (p = 0.06). Maternal fat component was correlated with fat at birth (r = 0.16 and 0.36), but not skeletal size (r = 0.07 and 0.05) in both boys and girls. Paternal fat was not correlated with fat or skeletal size in either sex (r = 0.05-0.10).
iii) Multiple linear regression analysis
Multiple linear regression was used to identify independ-ent predictors of skeletal size and fat componindepend-ents in the boys and girls (Table 7). Four analyses were performed, with skeletal size and fat components as the dependent variables for boys and girls separately.
The strongest independent associations found with skele-tal size components in both sexes were gestation, and maternal and paternal skeletal size. Other significant independent predictors of the skeletal size component were maternal glucose in the girls only, parity in the boys (which did not quite reach significance in the girls) and maternal smoking which showed a negative association in both.
Parity and maternal glucose showed independent associa-tions with the fat component in both boys and girls. The strongest independent predictor of the girls' fat compo-nent was maternal fat, which did not reach significance in the boys' analysis. Maternal smoking and maternal skele-tal size both showed negative independent associations with the boys' fat component, but there was no associa-tion with the girls'.
Figure 4a shows the correlation coefficient and 95% confi-dence intervals for the relationship between gestation and birth size components, boys and girls shown separately
Figure 4
Figure 4a shows the correlation coefficient and 95% confi-dence intervals for the relationship between gestation and birth size components, boys and girls shown separately. Fig-ure 4b shows the correlation coefficient and 95% confidence intervals for the relationship between maternal 28 week fast-ing glucose and birth size components, boys and girls shown separately.
C
o
rr
el
at
ion C
oef
fi
c
ient
(
r)
Skeletal Size Fat
-0
.2
0.
0
0
.2
0.
4
0
.6
0
.8
Correlation between gestation and birth size components Correlation between gestation and birth size components Correlation between gestation and birth size components Correlation between gestation and birth size components
Boys
Girls
Boys
Girls
C
o
rr
el
at
ion C
oef
fi
c
ient
(
r)
Skeletal Size Fat
-0
.2
0.
0
0
.2
0.
4
0
.6
0
.8
Correlation between maternal glucose and birth size components Correlation between maternal glucose and birth size components Correlation between maternal glucose and birth size components Correlation between maternal glucose and birth size components
Boys
Girls Boys
Girls a)
b)
Table 5: Rotated components matrix for principal components analysis of mothers' and fathers' anthropometry.
Mothers Fathers
Component: M1 M2 F1 F2
Weight 0.413 0.844 0.514 0.810
Height 0.936 -0.100 0.953 -0.018
Knee-Heel 0.834 -0.012 0.873 0.065
Sitting height 0.816 0.032 0.807 0.133
Head circumference 0.595 0.190 0.489 0.334 Arm circumference 0.098 0.928 0.241 0.786 Bicep skinfold -0.020 0.878 0.044 0.844 Tricep skinfold -0.060 0.871 0.021 0.768 Subscapular skinfold -0.040 0.867 0.002 0.912
Suprailiac skinfold - - 0.034 0.864
Waist circumference - - 0.228 0.895
Hip circumference - - 0.405 0.823
% Variance 30.8 43.4 25.9 48.1
Cumulative %Variance 74.2 73.9
Data were assessed for model fit, and apart from one out-lying observation in the skeletal data for boys and for girls, there was no evidence of any departure from the model assumptions. The removal of these outliers did not sub-stantially alter the conclusions.
Discussion
Principal components analysis produced two clear com-ponents allowing recognition of discrete aspects of birth size when using the rotated analysis. The rotated compo-nents, which can be considered to represent "skeletal size" and "fat", had different associations with factors known to alter birth weight.
There are various methods of obtaining measures of fat and skeletal size in utero and at birth. Direct measures of body composition can be obtained using DEXA scans [7], ultransonography [25-27], and total body electrical con-ductivity [9,28]. Although DEXA and ultrasonography would be the gold standard for measuring body composi-tion, these methods are likely to be expensive and imprac-tical in a large epidemiological study. Anthropometric measurements provide an alternative method where measures such as head circumference, length, and limb length can represent skeletal size, and measures of skin-fold thicknesses can represent fat. Mathematical equa-tions for combining these measurements to obtain estimates of body composition have previously been defined and can be applied retrospectively to the data [35,36]. Principal components analysis is another way of summarizing body size and composition using these anthropometric measurements and enables easier analy-sis of the data by reducing the problem of multicollinear-ity. It is a well established statistical method that can easily be implemented and allows the components to be internally derived from the data.
It has been suggested that genetic factors are more likely to alter skeletal size whereas the intrauterine environment has more of an effect on fat mass[1]. We were able to gain some insight into potential genetic determinants by also
producing components for the mother and father, which had not been carried out in other studies looking at PCA on birth size. Maternal and paternal skeletal size compo-nents were found to have significant associations with the skeletal size components in boys and girls (Tables 6 and 7), in keeping with the notion that genetic factors are more likely to affect skeletal growth. This finding is con-sistent with associations found between parental height and birth length seen in other studies [2,6-8,10].
Table 7: Multiple regression analysis of predictors of boys and girls skeletal size and fat components. Only factors with p < 0.1 are shown.
Covariate B SE t p R2
Boys skeletal size 0.278
Gestation 0.372 0.044 8.5 <0.001 Maternal Skeletal Size 0.215 0.053 4.1 <0.001 Paternal Skeletal Size 0.148 0.053 2.8 0.005 Maternal Smoking -0.406 0.151 -2.7 0.008 Parity (primip) -0.211 0.102 -2.1 0.04
Girls' Skeletal Size 0.428
Gestation 0.354 0.036 9.7 <0.001 Maternal Skeletal Size 0.266 0.044 6.0 <0.001 Paternal Skeletal Size 0.169 0.045 3.7 <0.001 Maternal Glucose 0.414 0.137 3.0 0.003 Maternal Smoking -0.301 0.139 -2.2 0.03 Parity (Primip) -0.170 0.090 -1.9 0.06
Boys Fat 0.158
Parity (Primip) -0.461 0.110 -4.2 <0.001 Maternal Smoking -0.646 0.164 -3.9 <0.001 Maternal Skeletal Size -0.141 0.057 -2.4 0.02 Maternal Glucose 0.322 0.158 2.0 0.04
Maternal Fat 0.107 0.059 1.8 0.07
Girls' Fat 0.189
Maternal Fat 0.302 0.057 5.3 <0.001 Maternal Glucose 0.476 0.171 2.78 0.006
Parity -0.283 0.113 -2.5 0.01
Data sorted according to t value to show strongest associations first. B is the regression coefficient. SE is the standard deviation for the regression coefficient.
Table 6: Determinants of birth skeletal size and fat in boys and girls:
Boys skeletal size Girls skeletal size Boys fat Girls fat
Maternal skeletal component
0.235*** (0.055) 0.390*** (0.152) -0.150 (0.023) 0.050 (0.003)
Maternal fat component 0.071 (0.005) 0.053 (0.003) 0.163* (0.027) 0.357*** (0.127) Paternal skeletal
component
0.164 (0.027) 0.250*** (0.063) -0.048 (0.002) -0.033 (0.001)
Paternal fat component 0.095 (0.009) 0.045 (0.002) 0.095 (0.009) 0.056 (0.003)
Correlation coefficients (r) of relationships between birth components and parents' components. R2 is given in brackets. ***p < 0.001, *p <
Factors associated with the fat component were largely those related to the intrauterine environment (Table 7) with parity and maternal glucose associated with fat in both boys and girls, and the strongest predictor of fat in the girls being maternal fat component (Table 7). Similar relationships of parity with fat measures have recently been reported [1,2] and it has been suggested this is due to the mothers' vascular system becoming better adapted to the transfer of energy to the fetus after the first preg-nancy [2]. Our findings are also in agreement with other studies that have found maternal glucose [27,28] and maternal BMI [2,37] to be good predictors of measures of fat and soft tissue in babies at birth.
Maternal smoking appeared to alter only the skeletal size component (Fig 3b), suggesting the intra-uterine environ-ment does play a role in determining skeletal size. This is consistent with previous research [7,9,10], particularly the studies by Lindley et al[11,12] who found reduced birth length, and head circumference, but increased ponderal index in babies born to smoking mothers, suggesting fat deposition is maintained despite deficits in other aspects of fetal growth. Other studies have found maternal smok-ing to be associated with a reduction in all measures of size, including fat and skinfold thicknesses [11,13,14], although the relationship with fat reported by Zaren et al[13] was weak, and in the study by Cliver et al[14], skin-folds were only affected in babies born to heavy smokers. In multiple regression analysis (Table 7) smoking did show an independent association with the fat component in the boys, but not the girls, which may account for some of the differences in the literature. This sexual dimor-phism has been seen before [15] and it was suggested that it may be due to hormonal differences.
These findings are all consistent with previous research. The disparity between the associations of gestation and the components of birth size, however, has not been described previously. In our data the strongest independ-ent predictor of the skeletal size componindepend-ent in both boys and girls was gestation, but it showed no association with the fat component. It is important to note these results are only based on term babies, so gestation in this study refers to the limited period of 37–42 weeks. Our data suggest that after 37 weeks gestation the increase in birth weight is as a result of further skeletal growth, rather than fat dep-osition (Fig 4a and Table 7). In contrast, other studies have found increases in skinfold thickness [3,5,38] and fat mass [25] with gestational age at term. In our data, the subscapular skinfold thickness had a weak but significant correlation with gestation (r = 0.096, p = 0.011), but the tricep skinfold thickness did not (r = 0.067, p = 0.076). These differences may be partly due to what the compo-nents represent. A recent study by Guihard-Costa et al. [29] found that although skinfold thicknesses increased
with gestation, their ratio with body weight between 33 and 42 weeks gestation significantly decreased, and this may reflect what is seen with our data. This finding war-rants further investigation as our cross-sectional data are not conclusive.
Other studies have used principal components analysis to produce components describing birth size [10,32,33], although they differ slightly from the components pro-duced from our data. Denham et al[32] used principal components analysis to describe differences in neonatal size between black and white babies of low socioeco-nomic status. The components they obtained were similar to the unrotated components produced in our data (Table 3), representing general body size, and contrasts between skeletal and fat measures (referred to as "body composi-tion"). Hindmarsh et al[10] examined size and shape at birth and reported 4 components in total, although the third and fourth components together explained only an additional 15% of the variation in birth measures. The first two components again were similar to our unrotated components. A key difference in our analysis, was the use of varimax rotation on the components (Table 4). The advantage of this method over the unrotated analysis, is that we obtained a clear distinction between measures of skeletal size and fat which are more meaningful in terms of explaining body size. Components representing skele-tal size and fat were produced in the study by Evans et al[33] investigating the effect of frequent prenatal ultra-sound examinations on birthweight. However, their com-ponents were obtained by a slightly different method: two separate analyses were carried out, one entering in only skeletal measures, and one entering in only fat measures, rather than all measures being entered into one analysis. Similarly, Koo et al[23] derived two components repre-senting fat: one from PCA on neonatal body circumfer-ences, and one from PCA on skinfold thickness measurements. The advantage of our method is that no clinical assumptions need to be made about the data prior to analysis. The components are derived purely from the data.
Conclusion
In conclusion, we have provided further evidence demon-strating principal components analysis is a useful method for analysing anthropometric data in babies at birth. The addition of varimax rotation enabled more distinct, clini-cally relevant, components to be produced than those seen in previous studies. We have clearly shown differ-ences in the determinants of skeletal size and fat compo-nents at birth, which support findings from previous research, as well as highlighting possible new areas for fur-ther study. This approach may be a useful tool in future investigations into the developmental origins of adult dis-ease.
Competing interests
The author(s) declare that they have no competing inter-ests.
Authors' contributions
BS carried out the statistical analysis and drafted the man-uscript. BK recruited subjects, carried out measurements and also assisted in the writing of the manuscript. RP advised on statistics and helped to draft the manuscript. AH conceived of the Exeter Family Study of Childhood Health and helped to plan and write the manuscript. DW conceived of the idea of using Principal Components Analysis to analyse the birth measurements, provided sta-tistical support in the analyzing of the data, and helped to draft the manuscript. All authors read and approved the final manuscript.
Acknowledgements
This study was funded by South West NHS Research and Development, Exeter NHS Research and Development and the Darlington Trust. ATH is a Wellcome Trust Research Leave fellow. BK holds a NHS Research and Development studentship. We gratefully acknowledge the hard work of the research midwives Martina Turner, Beverley Wilkins-Wall and Faye Sutton for their help in the collection of data.
References
1. Catalano PM, Drago NM, Amini SB: Factors affecting fetal growth and body composition. Am J Obstet Gynecol 1995,
172(5):1459-1463.
2. Guihard-Costa AM, Papiernik E, Kolb S: Maternal predictors of subcutaneous fat in the term newborn. Acta Paediatr 2004,
93(3):346-349.
3. Guihard-Costa AM, Grange G, Larroche JC, Papiernik E: Sexual dif-ferences in anthropometric measurements in French new-borns. Biol Neonate 1997, 72(3):156-164.
4. Copper RL, Goldenberg RL, Cliver SP, DuBard MB, Hoffman HJ, Davis RO: Anthropometric assessment of body size differ-ences of full-term male and female infants. Obstet Gynecol 1993,
81(2):161-164.
5. Rodriguez G, Samper MP, Ventura P, Moreno LA, Olivares JL, Perez-Gonzalez JM: Gender differences in newborn subcutaneous fat distribution. Eur J Pediatr 2004, 163(8):457-461.
6. Kirchengast S, Hartmann B, Schweppe KW, Husslein P: Impact of maternal body build characteristics on newborn size in two different European populations. Hum Biol 1998, 70(4):761-774. 7. Godfrey K, Walker-Bone K, Robinson S, Taylor P, Shore S, Wheeler T, Cooper C: Neonatal bone mass: influence of parental
birth-weight, maternal smoking, body composition, and activity during pregnancy. J Bone Miner Res 2001, 16(9):1694-1703. 8. Knight B, Shields BM, Turner M, Powell RJ, Yajnik CS, Hattersley AT:
Evidence of genetic regulation of fetal longitudinal growth.
Early Hum Dev 2005, 81(10):823-831.
9. Lindsay CA, Thomas AJ, Catalano PM: The effect of smoking tobacco on neonatal body composition. Am J Obstet Gynecol
1997, 177(5):1124-1128.
10. Hindmarsh PC, Geary MP, Rodeck CH, Kingdom JC, Cole TJ: Intra-uterine growth and its relationship to size and shape at birth.
Pediatr Res 2002, 52(2):263-268.
11. Lindley AA, Gray RH, Herman AA, Becker S: Maternal cigarette smoking during pregnancy and infant ponderal index at birth in the Swedish Medical Birth Register, 1991-1992. Am J Public Health 2000, 90(3):420-423.
12. Lindley AA, Becker S, Gray RH, Herman AA: Effect of continuing or stopping smoking during pregnancy on infant birth weight, crown-heel length, head circumference, ponderal index, and brain:body weight ratio. Am J Epidemiol 2000,
152(3):219-225.
13. Zaren B, Lindmark G, Gebre-Medhin M: Maternal smoking and body composition of the newborn. Acta Paediatr 1996,
85(2):213-219.
14. Cliver SP, Goldenberg RL, Cutter GR, Hoffman HJ, Davis RO, Nelson KG: The effect of cigarette smoking on neonatal anthropo-metric measurements. Obstet Gynecol 1995, 85(4):625-630. 15. Zaren B, Lindmark G, Bakketeig L: Maternal smoking affects fetal
growth more in the male fetus. Paediatr Perinat Epidemiol 2000,
14(2):118-126.
16. Godfrey KM, Barker DJ: Fetal programming and adult health.
Public Health Nutr 2001, 4(2B):611-624.
17. Barker DJ: Fetal nutrition and cardiovascular disease in later life. Br Med Bull 1997, 53(1):96-108.
18. Barker DJ: Fetal origins of coronary heart disease. BMJ 1995,
311(6998):171-174.
19. Barker DJ, Hales CN, Fall CH, Osmond C, Phipps K, Clark PM: Type 2 (non insulin-dependent) diabetes mellitus, hyerpertension, and hyperlipidaemia (syndrome x): relation to reduced fetal growth. Diabetologia 1993, 36:62-67.
20. Barker DJ, Osmond C, Simmonds SJ, Wield GA: The relation of small head circumference and thinness at birth to death from cardiovascular disease in adult life. BMJ 1993,
306(6875):422-426.
21. Barker DJ, Godfrey KM, Osmond C, Bull A: The relation of fetal length, ponderal index and head circumference to blood pressure and the risk of hypertension in adult life. Paediatr Peri-nat Epidemiol 1992, 6:35-44.
22. Phillips DIW, Barker DJP, Hales CN, Hirst S, Osmond C: Thinness at birth and insulin resistance in adult life. Diabetologia 1994,
37:150-154.
23. Koo WW, Walters JC, Hockman EM: Body composition in neonates: relationship between measured and derived anthropometry with dual-energy X-ray absorptiometry measurements. Pediatr Res 2004, 56(5):694-700.
24. Hammami M, Koo WW, Hockman EM: Body composition of neonates from fan beam dual energy X-ray absorptiometry measurement. JPEN J Parenter Enteral Nutr 2003, 27(6):423-426. 25. Bernstein IM, Goran MI, Amini SB, Catalano PM: Differential
growth of fetal tissues during the second half of pregnancy.
Am J Obstet Gynecol 1997, 176(1 Pt 1):28-32.
26. Bernstein IM, Plociennik K, Stahle S, Badger GJ, Secker-Walker R:
Impact of maternal cigarette smoking on fetal growth and body composition. Am J Obstet Gynecol 2000, 183(4):883-886. 27. Parretti E, Carignani L, Cioni R, Bartoli E, Borri P, La Torre P, Mecacci
F, Martini E, Scarselli G, Mello G: Sonographic evaluation of fetal growth and body composition in women with different degrees of normal glucose metabolism. Diabetes Care 2003,
26(10):2741-2748.
28. Catalano PM, Thomas A, Huston-Presley L, Amini SB: Increased fetal adiposity: a very sensitive marker of abnormal in utero development. Am J Obstet Gynecol 2003, 189(6):1698-1704. 29. Guihard-Costa AM, Papiernik E, Grange G, Richard A: Gender
dif-ferences in neonatal subcutaneous fat store in late gestation in relation to maternal weight gain. Ann Hum Biol 2002,
Publish with BioMed Central and every scientist can read your work free of charge "BioMed Central will be the most significant development for disseminating the results of biomedical researc h in our lifetime."
Sir Paul Nurse, Cancer Research UK
Your research papers will be:
available free of charge to the entire biomedical community
peer reviewed and published immediately upon acceptance
cited in PubMed and archived on PubMed Central
yours — you keep the copyright
Submit your manuscript here:
http://www.biomedcentral.com/info/publishing_adv.asp
BioMedcentral
30. Catalano PM, Drago NM, Amini SB: Maternal carbohydrate metabolism and its relationship to fetal growth and body composition. Am J Obstet Gynecol 1995, 172(5):1464-1470. 31. Mardia KV, Kent JT, Bibby JM: Multivariate Analysis. London ,
Academic Press Inc. Ltd.; 1979.
32. Denham M, Schell LM, Gallo M, Stark A: Neonatal size of low socio-economic status Black and White term births in Albany County, NYS. Ann Hum Biol 2001, 28(2):172-183. 33. Evans S, Newnham J, MacDonald W, Hall C: Characterisation of
the possible effect on birthweight following frequent prena-tal ultrasound examinations. Early Hum Dev 1996,
45(3):203-214.
34. Knight B, Shields BM, Hattersley AT: The Exeter Family Study of Childhood Health (EFSOCH): study protocol and methodol-ogy. Paediatr Perinat Epidemiol 2006, 20(2):172-179.
35. Dauncey MJ, Gandy G, Gairdner D: Assessment of total body fat in infancy from skinfold thickness measurements. Arch Dis Child 1977, 52(3):223-227.
36. Durnin JV, Womersley J: Body fat assessed from total body den-sity and its estimation from skinfold thickness: measure-ments on 481 men and women aged from 16 to 72 years. Br J Nutr 1974, 32(1):77-97.
37. Neggers Y, Goldenberg RL, Cliver SP, Hoffman HJ, Cutter GR: The relationship between maternal and neonatal anthropomet-ric measurements in term newborns. Obstet Gynecol 1995,
85(2):192-196.
38. Gampel B: The Relation of Skinfold Thickness in the Neonate to Sex, Length of Gestation, Size at Birth and Maternal Skin-fold. Hum Biol 1965, 37:29-37.
Pre-publication history
The pre-publication history for this paper can be accessed here: