Iranian Journal of Electrical and Electronic Engineering, Vol. 15, No. 1, March 2019 87
Optimal Estimation of Harmonic Components Using ISFLA
R. Shariatinasab*
(C.A.), M. Rasuli* and J. Gholinezhad*
Abstract: In this paper a novel method based on evolutionary algorithms is presented to estimate the harmonic components. In general, the optimization of the harmonic estimation process is a multi-component problem, in which evaluation of the phase and harmonic frequency is the nonlinear part of the problem and is solved based on the mathematical and evolutionary methods; while estimation of amplitude of the harmonic component is a linear issue that is performed by combining the least squares method with the aforementioned approaches. In this paper, firstly, the optimal estimation of integer harmonic components has been introduced based on the improved shuffled frog leaping algorithm (ISFLA) in the presence of two types of noise. The obtained results present the lower error of the proposed method than to IGHS, FBF PSO, GA and FFT methods. Thereafter, the effectiveness of the presented algorithm in optimal estimation of frequency, phase, and amplitude of the integer and non-integer harmonics are investigated. The optimization of the estimation of various harmonic components under different conditions using ISFLA leads to an improvement in the assessment of power quality in power systems especially in the distribution networks, considering a lot of the nonlinear loads and harmonic resources connected to the network.
Keywords: Harmonic Estimation, Sub-Harmonics, ISFLA, Power Quality.
1 Introduction1
HE harmonic pollution is one of the most important issues related to the power quality in power systems. Nonlinear loads in power systems, especially in distribution and sub-transmission networks, are the main source of harmonics. Usually, active and passive filters have been used to mitigate the harmonics in power systems. However, harmonic components of voltage and/or current signals must be measured prior to design a proper filter for power network. As a consequence, harmonic detection is of the great importance in power quality improvement.
The Fast Fourier Transform (FFT) is a common approach for obtaining harmonic components of the measured signal. The main disadvantage of FFT is the notable error in the case of frequency deviation or
Iranian Journal of Electrical and Electronic Engineering, 2019. Paper first received 23 March 2018 and accepted 29 October 2018. * The authors are with the Department of Electrical and Computer Engineering, University of Birjand, Birjand, Iran.
E-mails: [email protected],
[email protected]. Corresponding Author: R. Shariatinasab.
voltage fluctuation. However, it should be mentioned that in the harmonic estimation problems, in addition to minimizing the error, the required time for analyzing the waveform is also important.
An approach based on FFT and using a sampling window with variable width has been presented in [1], in which both integer and non-integer harmonics have been studied. In [2], the spectral analysis of the waveform has been used for determining the intermediate harmonics and sub-harmonics. Also, by estimating the spectral density function of the waveform, the integer harmonic components have been detected.
Reference [3] makes a comparison between some existed methods for estimating the frequency of harmonic components and performed the sensitivity analysis to investigate the noisy condition.
In [4], a fast approach based on Adaline algorithm and the least squares method has been presented for detection the harmonic components in presence of DC component. Some methods based on analytical approach [5], PSOPC algorithm [6], genetic algorithm (GA) [7] and FBF algorithm [8] to prediction the amplitude of harmonic components have been illustrated. In order to surpass the limitations of FFT, a method based on Kalman filter is presented in [9].
T
Iranian Journal of Electrical and Electronic Engineering, Vol. 15, No. 1, March 2019 88 In [10], an algorithm inspired by the performance of
musicians in achieving the best state of harmony between notes, has been used. In [11] and [12], by applying some changes in the implementation of the HS algorithm during optimization, estimation of harmonic components have been carried out.
In this paper, a hybrid approach is used for estimating the amplitude, phase, and angular frequency of the different harmonic component. In the presented method, the least squares method is used for estimating the linear part of each harmonic component, i.e. amplitude and the ISFLA is utilized for determining the nonlinear parts of each harmonic component that are the resultant phase and angular frequency of each harmonic component. In other words, the phase, frequency, and amplitude of different harmonic components can be estimated, simultaneously. The effects of the noise on the harmonic detection, the presence of damping dc component and frequency deviation on the efficiency of the proposed algorithm are also investigated. The obtained results obtained by the proposed method are compared with those calculated by other approaches presented so far, from the error and the runtime points of view that verify the superiority of the proposed approach.
2 General Approach to Harmonic Estimation
It is assumed that the sampled signal S(t) can be defined in the form of
1 sin H
h h h
h
S t D t N t
(1)where h is the harmonic order, and Dh, ωh , and φh are the amplitude, angular frequency and the phase of the harmonic order of h, respectively. N(t) is the existing noise in the sampled signal.
In order to estimate the amplitude, frequency, and the phase of harmonics, the obtained signal S(t)' would be in the form of
' '
' '
1 sin H
h h h
h
S t D t N t
(2)where Dh´, ωh´ and φh´ are the estimated amplitude, frequency, and phase of the harmonic order of h, respectively.
The main goal of solving the problem is to determine Dh´, ωh´ and φh´ in such a way that the corresponding error between the sampled signal S(t)and the estimated signal S(t)' is minimized.
Assuming a sampling time of t for each sample of signal S(t), the set of sampling times of B samples is
t t1, 2, , ,ti ,tB
(3)Now for the ith sample, we have
, 1, 2,...,S i Hr i D N i i B (4)
where S(i) is the ith sample of S(t) and the Hr matrix can be introduced as follows
1 1 1 1
1 2 1 2
1 1 sin sin sin sin . sin sin h h h h
B h B h
t t t t Hr t t (5)
Also, the D in (4) is a matrix that could be expressed as follows 1 H D D D (6)
Now, for the estimated harmonic components we have
'
', 1, 2,..., .
S i Hr i D i B (7)
With the same manner, Hr´can be calculated once ωh´ and φh´ have been estimated. Assuming Hr´ as a full rank matrix, and using the least squares method, the amplitude can be estimated as follows
1
' 'T ' 'T .
D Hr Hr Hr S (8)
From the above equations, it can be seen that determining the phase and angular frequency is a non-linear, and calculation of the amplitude is a linear problem.
In each iteration, at first, ωh´ and φh´ are determined and then, knowing the sampling time, Hr´ is calculated by (5). Finally, the amplitudes D´ can be calculated by (8). Using (8) guarantees that the best amplitude is selected in accordance with the estimated phase and angular frequency so that the difference between S(t) and S(t)´ is minimized. Therefore, the general objective function could be defined as follows
2 '1
. B
i
f S i S i
(9)In each iteration, the objective function is calculated for the amplitude, phase, and the frequency of harmonic components, separately, and their relevant optimal values are obtained by minimizing (9).
3 SFLA Algorithm
The SFLA is an optimization approach which is inspired by the social behavior of the frogs to find the place of the greatest food. This algorithm generally initially produces primary populations that contain p frog in the range of the solution space. Each of these
Iranian Journal of Electrical and Electronic Engineering, Vol. 15, No. 1, March 2019 89 frogs, which in fact represents a solution for the
estimation of harmonic components, is stored in the matrix THE so that the size of this matrix indicates the number of primary populations.
For each of the arrays of the matrix THE, the objective function is computed and the results are stored in a matrix called ATHE. The mentioned matrices are arranged according to the level of frog fitness. Then, the whole population is divided into m groups, so that each group includes n frog. Finally, the local search is run. In the local search, the position of the worst frog of each group, according to the position of the best answer of that group, or even the best answer of the all groups, is improved and hence the average fitness of the frog increases. In order to go through this, for a specified number of iterations, the following steps are repeated for each group:
Step 1: The best frog Xb and the worst frog Xw of each group are determined based on their fitness.
Step 2: The position of the worst frog in each group is updated using the following equations
b w
Mu rand X X (10)
new old
w w
X X Mu (11)
For the new frog, the objective function is calculated, and if the solution is improved, the new frog is replaced and the program moves to the fifth step. Otherwise, the next step is executed.
Step 3: In this stage instead of Xb, the best solution of all groups which is the first array of matrix THE is used. The best solution of all groups is called Xg. If the solution is improved, the frog is replaced and the process goes to step 5; otherwise it goes to the step 4. Step 4: In this step, a new frog is generated randomly and replaced the worst frog.
Step 5: The steps 1 to 4 are repeated to the specified number to meet the stopping criteria.
3.1 The ISFLA Algorithm
The SFLA benefits of its high speed, but it can be caught up in local optimums in solving complex and nonlinear mathematical problems. For this reason, in this paper, an ISFLA is introduced in which the search speed is improved than to its conventional version and the worst frog movement in each group in the local search is changed.
In order to do that, firstly, the following mutation vector is generated for the worst case in each iteration:
r1 r2
Mun F X X (12)
w g
PX X Mun (13)
where Xr1 and Xr2 are two different frogs that are randomly selected among the frogs in the group. F is known as mutation coefficient and determines the difference between the amplitude of the Xr1 and Xr2, and
Xg is the best solution generated until the current iteration. However, the value of the jth vector parameter in the next iteration is determined using the following equation
, if or
, otherwise
w g
new
wj old
wj
PX rand CR j rm
X
X
(14)
where rand is a random number uniformly distributed within the interval [0, 1], CRg is the global crossover constant that has a value within [0, 1]. rm is a random number which is selected from the interval of THE parameters and implies that at least one of the parameters of Xwjnew must be selected from PXw values. If the fitness value of the new solution is better than the previous one, the previous frog will be replaced; otherwise, the best solution of each group will be replaced by Xg and local crossover rate (CRb) will be replaced by CRg and (12)-(14) are repeated. If a better solution is not obtained at this stage, a frog is generated randomly.
4 Simulation Results
In order to analyze the performance of the proposed method, a test signal which is the waveform of a three-phase full rectifier is used [6-8], [12]. The harmonic characteristic of the test signal with the fundamental frequency of 60 Hz is shown in Table 1.
The test signal is studied in three different conditions: 1) without the noise, 2) with uniform noise, and 3) with Gaussian noise. In the noisy states, the signal-to-noise ratio (SNR), 0, 10, and 20 dB is added to make the estimate closer to reality. According to references [6-8] and [12], the number of samples in each period of the signal is 64. The resultant error in all cases is calculated by (15) in which S(i) and S(i)´ represent the ith sample of
the real and the estimated signal, respectively.
2 1
1
( ( ( )) ) 100 B
i
Error f S i
(15)where S(i) is the ith sample of the signal and f is the
main frequency.
4.1 Estimation of Integer Harmonics
In this section, the optimal estimation of integer harmonics is performed and consequently, the harmonic
Table 1 Harmonic characteristics of the test signal.
Order of Harmonic
Amplitude [p.u.] Phase [degrees]
0.33 (20 Hz) 0.505 75.6
1 (60 Hz) 0.950 -2.02
2.4 (144 Hz) 0.505 75.6
5 (300 Hz) 0.090 82.1
7 (420 Hz) 0.043 7.9
11 (660 Hz) 0.030 -147.1
13 (780 Hz) 0.033 162.2
Iranian Journal of Electrical and Electronic Engineering, Vol. 15, No. 1, March 2019 90 order is defined. Once the value of ω has been obtained,
the amplitude and the phase of each harmonic component must be determined. In order to go through this, the objective function in the Hr matrix is minimized once the phase component of each harmonic is estimated and the relevant amplitude is calculated by means of the least squares method.
Firstly, the fundamental component is estimated by the proposed algorithm and compared with the other methods, Table 2. The results are obtained by averaging the output of 10 runs of the program in each level. As it is clear from Table 2, the proposed ISFLA based approach has the lowest error compared to those obtained by the approaches presented so far. However, the duration time needed for calculation is about several tenths of a second slower than in [8], and [12], while is much faster than that presented in [6]. It should be
mentioned that the computer used in this research suffers from its weaker performance than those used by other references.
The main goal in harmonic estimation is the accuracy of the method, but the time needed for detection is also a concern for harmonic elimination by active filters. However, the needed time for harmonic detection by ISFLA is acceptable.
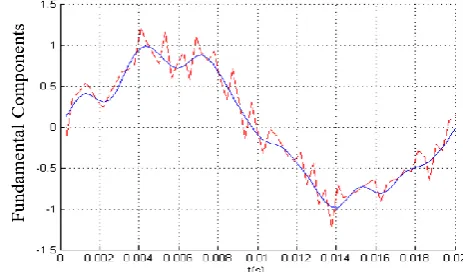
Fig. 1 shows the fundamental components of the real and estimated signals in the presence of uniform and Gaussian noise with an SNR of 0 dB, respectively. In the next step, all the harmonic components including fundamental, 5th, 7th, 11th and 13th harmonic
order were estimated by the proposed ISFLA method and the previous approaches under three different noisy conditions, in which the results are presented in Table 3.
Table 2 Estimation of the fundamental component.
Algorithm
Noise
SNR [dB]
GA [8] GA [6] FBF [8] PSOPC [6] IGHS [12] Proposed
ISFLA Time
[sec]
Error [%]
Time [sec]
Error [%]
Time [sec]
Error [%]
Time [sec]
Error [%]
Time [sec]
Error [%]
Time [sec]
Error [%]
Without Noise - 0.234 0.018 t>4 0.057 0.093
3×10⁻⁴ t>3 0 0.109 0 0.476 0
Uniform Noise
0 0.234 6.610 t>4 0.521 0.109 6.66 t>3 0.455 0.109 0.161 0.499 0.087 10 0.234 0.954 t>4 0.207 0.094 0.87 t>3 0.026 0.109 0.111 0.498 0.016 20 0.234 0.125 t>4 0.171 0.094 0.20 t>3 0.004 0.109 0.010 0.498 4×10⁻⁴
Gaussian Noise
0 0.218 0.146 t>4 2.891 0.109 1.14 t>3 2.632 0.109 0.129 0.501 0.263 10 0.235 0.115 t>4 2.396 0.109 0.29 t>3 1.132 0.109 0.274 0.499 0.0351 20 0.235 0.028 t>4 0.399 0.109 0.070 t>3 0.050 0.109 0.051 0.496 2×10⁻⁴
(a) (b)
Fig. 1 Fundamental component of the waveform; a) In case of the presence of the uniform noise, and b) In the case of the presence of
Gaussian noise. Dashed-line: real waveform, solid line: estimated waveform.
Table 3 Results of estimation of all harmonic components (percentage error and needed time).
Algorithm
Noise
SNR [dB]
GA [8] GA[6] DFT [8] FBF [8] PSOPC [6] IGHS [12] Proposed ISFLA Time
[sec] Error
[%]
Error [%]
Error [%]
Time [sec]
Error [%]
Error [%]
Time [sec]
Error [%]
Time [sec]
Error [%] Without
Noise - 0.63 0.32 0.039 0 0.375 0.121 9.6×10
-6 0.39 7.7×10⁻⁶ 0.725 0
Uniform Noise
0 0.66 29.3 49.03 101.0 0.375 13.14 48.99 0.39 30.559 0.869 0.1315 10 0.64 2.03 5.811 10.10 0.375 2.552 5.798 0.39 6.3353 0.845 1.4×10⁻⁴
20 - - 0.688 - - - 0.632 0.39 0.6069 0.843 4.3×10⁻⁶
Gaussian Noise
0 0.61 7.57 54.95 45.11 0.375 9.519 54.85 0.39 32.117 0.876 0.692 10 0.63 1.05 12.14 4.511 0.375 0.580 11.89 0.39 8.2357 0.866 0.086
20 - 0 1.737 - - - 1.665 0.39 0.6275 0.864 0.002
Iranian Journal of Electrical and Electronic Engineering, Vol. 15, No. 1, March 2019 91 Owing to the results, the proposed method has a
considerably smaller error in comparison with the existed methods within an acceptable duration time needed for the calculation.
Fig. 2 presents the real and estimated signals with a SNR of 0 dB in the presence of all harmonic components. Due to the results, one can conclude the high accuracy of the proposed method, even in the noisy condition.
4.2 Estimation of Sub-Harmonics and Inter-Harmonics
The sub and inter-harmonics are those harmonic orders that are non-integer multiples of the fundamental frequency. Due to their physiological effects on human beings, analyzing and estimating the sub-harmonics is of the great importance in power system especially in distribution networks.
In the case of the sub and/or inter-harmonics estimation, in addition to the phase of the different harmonic components, the harmonic frequencies are also added to the arrays of the Hr matrix.
The results of the estimating of the 20 and 144 Hz harmonic frequency by the proposed method are presented in Table 4. The results are obtained in the case of presence of the 0.5% Gaussian noise.
The above results show that the resultant error of the presented method is the lowest value for both of the 20 and 144 Hz frequency. Fig. 3 shows the real and estimated signals in presence of 20 Hz and 120 Hz components. As it can be seen in Fig. 3, the real and estimated signals by the proposed ISFLA method overlap to a great extent.
4.3 Analyzing the Effect of Frequency Deviation of Fundamental Frequency
To investigate the effect of frequency deviation of fundamental component on the harmonic estimation, similar to [6] and [12], firstly, a signal of the fundamental frequency of 60 Hz and harmonic orders of 2, 3, 5, 7, 23, 25, 47, 49, 59, 61 and 69 were considered. Thereafter, by changing the fundamental frequency into 59.5 Hz and considering a sampling rate of 128 samples per cycle and a sampling frequency of 7680 Hz, the fundamental frequency and the relevant error was estimated in the presence of a 0.5% Gaussian noise, Table 5. The results in Table 5 show that of the lowest error of the proposed ISFLA approach in the estimation of the fundamental frequency than to the other methods. Therefore, the better performance of the proposed ISFLA than to the previous approaches can be is concluded.
(a) (b)
Fig. 1 Fundamental component of the waveform; a) In the case of the presence of the uniform noise, and b) In the case of the
presence of Gaussian noise. Dashed-line: real waveform, solid line: estimated waveform.
Table 4 Estimated frequency.
Method 20 HZ 120 Hz
GA [6]
Estimated
Frequency 25.5581 -
Estimation Error 0.0140 -
PSOPC [6]
Estimated
Frequency 19.8791 -
Estimation Error 0.000149 -
IGHS [12]
Estimated
Frequency 19.8019 119.9846 Estimation Error 0.0045 0.0015
Proposed ISFLA
Estimated
Frequency 19.934 119.934
Estimation Error 0.000367 0.0000185 Fig. 3 Real waveform (dashed) and the estimated one (solid) in presence of Gaussian noise 0.5%.
Iranian Journal of Electrical and Electronic Engineering, Vol. 15, No. 1, March 2019 92
Table 5 Estimated frequency
(fundamental component is 59.5 Hz).
Ref. [6] Ref. [12] Proposed ISFLA Estimated
Frequency 59.5032 59.5010 59.5006 Estimation
Error 3.815×10
-4 6.96×10⁻⁴ 2.83×10⁻⁴
4.4 The Effect of Presence of DC Component
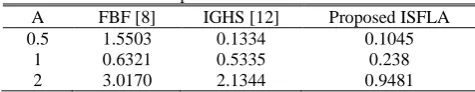
In order to investigate the efficiency of the proposed algorithm in estimating the harmonic components in the presence of a damped DC component on the waveform, a component in the form of Ae-t/τ is added to test signal
of Table 1 [8, 12]. The value of A is assumed equal to 0.5, 1, and 2 per unit and the time constant is 0.2 s. The resultant errors of harmonic detection process under this condition are shown in Table 6, in which the error by the ISFLA is the lowest in compared with the previous approaches.
5 Conclusion
In this paper, a new method based on ISFLA is presented for estimation of the harmonic components under different conditions. The ISFLA is able to determine integer harmonics in the noisy conditions with a good accuracy. The obtained results show that the proposed algorithm benefits of its accurate estimation of harmonic components in a very short time together with the smallest error in compared to other approaches presented so far.
Also, considering the effect of inter and/or sub- harmonics on power systems and human being, i.e. power quality issues the proposed algorithm is used for estimating the phase, frequency and the amplitude of this kind of harmonics. The estimated harmonics and the error obtained during the detection process show the better performance of the proposed ISFLA than to the previously algorithms presented for this purpose. Finally, in order to confirm the accuracy of the proposed method, the effect of a deviation in fundamental frequency and presence of a DC component on harmonic detection was also investigated. Owing to the results, the ISFLA can be assumed as the best method presented so far in optimizing the estimation of harmonic components under different conditions.
However, the presented optimization method results in improvement of evaluation of power quality indices and compensation of them in power systems, especially in distribution and sub-transmission network, where a large number of harmonic sources are connected to the network.
Appendix
The codes in current paper were developed in MATLAB environment and executed on an Intel Core 2
Duo 2.2-GHz CPU, 2.00-GB RAM; while the
Table 6 Resultant error of harmonic detection in presence of
DC component on the waveform.
A FBF [8] IGHS [12] Proposed ISFLA
0.5 1.5503 0.1334 0.1045
1 0.6321 0.5335 0.238
2 3.0170 2.1344 0.9481
simulation work in [6] is carried out by a PC with a 2.66-GHz Intel Core 2 Duo CPU, 2.00-GB RAM. Also, Ref. [8] run the algorithm by a Pentium-IV, 2.6 GHz machine.
References
[1] T. X. Zhu, “Exact harmonics and inter-harmonics calculation using adaptive window width,” IEEE Transactions on Power Delivery, Vol. 22, No. 4, pp. 2279–2288, 2007.
[2] A. S. Yilmaz, A. Alkan, and M. H. Asyali, “Applications of parametric spectral estimation methods on detection of power system Harmonics,” Electric Power Systems Research, Vol. 78, No. 4, pp. 683–693, 2008.
[3] M. Sedlacek, and J. Blaska, “Low uncertainty power-line frequency estimation for distorted and noisy harmonic signals,” Measurement, Vol. 35, No. 1, pp. 97–107, 2004.
[4] M. Joorabian, S. S. Mortazavi, and A. A. Khayyami, “Harmonic estimation in a power system using a novel hybrid Least Squares-Adaline algorithm,” Electric Power Systems Research, Vol. 79, No. 1, pp. 107–116, 2007.
[5] J. Z. Yang, C. S. Yu, and C. W. Lui, “A new method for power signal harmonic analysis,” IEEE Transactions on Power Delivery, Vol. 20, No. 2, pp. 1235–1239, 2005.
[6] Z. Lu, T. Y. Ji, W. H. Tang, and A. H. Wu, “Optimal harmonic estimation using a particle swarm optimizer,” IEEE Transactions on Power Delivery, Vol. 23, No. 2, pp. 1166–1174, 2008.
[7] M. Bettayeb and U. Qidwai, “A hybrid least squares-GA-based algorithm for harmonic estimation,” IEEE Transactions on Power Delivery, Vol. 18, No. 2, pp. 377–382, 2003.
[8] S. Mishra, “A hybrid least square-fuzzy bacterial foraging strategy for harmonic estimation,” IEEE Transactions on Evolutionary Computation, Vol. 9, No. 1, pp. 61–73, 2005.
[9] S. H. Hosseini and K. Mohammadi, “Design and implementation of a Kalman filter-based time-varying harmonics analyzer,” Journal of Iranian Association of Electrical and Electronics Engineers, Vol. 3, No. 2, pp. 35–42, 2006.
Iranian Journal of Electrical and Electronic Engineering, Vol. 15, No. 1, March 2019 93 [10]K. S. Lee and Z. W. Geem, “A new structural
optimization method based on the harmony search algorithm,” Computers and Structures, Vol. 82, No. 9, pp. 781–798, 2004.
[11]M. G. H. Omran and M. Mahdavi, “Global-best harmony search,” Applied Mathematics and Computation, Vol. 198, No. 2, pp. 643–656, 2008.
[12]A. M. Haddadi, “Optimum harmonic estimation by using IGHS algorithm,” Journal of Iranian Association of Electrical and Electronics Engineers, Vol. 9, No. 2, pp. 49–57, 2011.
R. Shariatinasab received the B.Sc.
degree in Electrical Engineering from Ferdowsi University, Mashhad, Iran, in 2000, and the M.Sc. and Ph.D. degrees in Electrical Engineering from Amirkabir University of Technology (Tehran Polytechnique), Tehran, Iran, in 2003 and 2009, respectively. In September 2007, he was a Visiting Scientist with Doshisha University, Kyoto, Japan.
In 2009, he joined the Electrical and Computer Engineering Department, University of Birjand, Birjand, Iran, where he is currently an Associate Professor of Electrical Engineering. He
is the author or coauthor of 2 books, one book chapter, and more than 110 scientific papers published in reviewed journals and presented at international conferences. His current research interests include high voltage engineering, lightning and switching transients, and electromagnetic compatibility.
M. Rasouli was born in Iran in 1990. He
received the B.Sc. degree in Electrical Engineering from Islamic Azad University of Yazd, in 2012 and the M.Sc. degree in Electrical Engineering, from University of Birjand, in 2014. He has authored more than 10 scientific journal and conference papers. His research interests include power system transients and modeling.
J. Gholinezhad was born in Iran, in
1989. He received the B.Sc. degree in Electrical Engineering from Shahid Abbaspor University, Tehran, Iran in 2011 and the M.Sc. degree in Electrical Engineering from University of Birjand, Birjand, Iran, in 2013. He is currently a Ph.D. student in University of Birjand. His research interests include power system transients and operations, electromagnetic compatibility, and grounding systems.
© 2019 by the authors. Licensee IUST, Tehran, Iran. This article is an open access article distributed under the terms and conditions of the Creative Commons Attribution-NonCommercial 4.0 International (CC BY-NC 4.0) license (https://creativecommons.org/licenses/by-nc/4.0/).
![Table 1 Harmonic characteristics of the test signal. Order of Amplitude [p.u.] Phase [degrees]](https://thumb-us.123doks.com/thumbv2/123dok_us/22853.2002488/3.595.311.542.659.754/table-harmonic-characteristics-signal-order-amplitude-phase-degrees.webp)
![Table 3 Results of estimation of all harmonic components (percentage error and needed time).GA [8] GA[6] DFT [8] FBF [8] PSOPC [6] IGHS [12]](https://thumb-us.123doks.com/thumbv2/123dok_us/22853.2002488/4.595.52.544.294.577/table-results-estimation-harmonic-components-percentage-needed-psopc.webp)