International Journal of Finance and Managerial Accounting, Vol.2, No.7, Autumn 2017
71
With Cooperation of Islamic Azad University – UAE BranchUsing the Imperialistic Competitive Algorithm Model in
Bankruptcy Prediction and Comparison with Genetic
Algorithm Model in Listed Companies
of Tehran Stock Exchange
Mahdi Moradi
Professor, Faculty of Economics and Business Administration, Ferdowsi University of Mashhad, Iran
Mohsen Maftounian
MSc, Faculty of the Accounting and Management, Islamic Azad University, Mashhad Branch, Iran (Correspondent author)
Maedeh Babaei Kelarijani
MSc, Faculty of the Accounting and Management, Islamic Azad University, Babol Branch, Iran
Morteza Fadaei
MSc, Faculty of the Accounting and Management, Islamic Azad University, Mashhad Branch, Iran
ABSTRACT
Bankruptcy prediction is a major issue in classification of companies. Since bankruptcy is extremely costly, investors, owners, managers, creditors, and government agencies are interested in evaluating the financial status of companies. This study tried to predict bankruptcy among companies registered in Tehran Stock Exchange (Iran) by designing imperialist competitive algorithm and genetic algorithm models. It then compared the accuracy of the two models in financial conditions of Iran and sought the best model to predict company bankruptcy one, two, and three years before its incidence. Also uses a model to surveying the financial position and also the subject of continuing operations about them to improve the quality of decision taken by shareholders and stakeholders. The study sample consisted of 38 bankrupt and 38 non-bankrupts companies during 2007-2016. The final variables used in both algorithms were five financial ratios. The results showed that the imperialist competitive algorithm had better accuracy than the genetic algorithm in bankruptcy prediction at the mentioned intervals.
Keywords:
1. Introduction
In recent decades, globalization, emergence of new markets, higher competition between companies, institutions, and organizations, and rapid economic, social, and technological changes have increased uncertainty and volatility in financial environment and complicated the financial decision-making process. In such conditions, untimely and inefficient investments will cause significant macroeconomic challenges for a country, i.e. economic development will widely depend on appropriate decision-making and effective resource allocation. The absolute support provided by all developed and developing economies for investments and investors has turned investments and taking advantage of investment opportunities into a critical issue in financial management. Decision-making (choosing one way among different solutions) is an indispensable part of management. On the other hand, making any decision requires the acquisition, processing, analysis, and appropriate inference from available data. Therefore, models to predict financial status of a corporate will be of great help to investors who are often forced to make quick decisions about their investments while they may lack an analytical understanding of corporates (Aziz & et al, 2006).
Financial distress and the consequent bankruptcy experienced by numerous companies in different countries has forced capital market participants and researchers to strive for ways to predict such situations and protect the investors’ investments. Several Iranian companies, even those registered in Tehran Stock Market, are suffering from financial distress, e.g. some companies are facing difficulty in repaying their debts, some lack enough incoming cash flow to pay their operating costs, and some are subject to article 141i of the Iranian commercial law.
These corporates have in fact wasted their resources instead of investing them in profitable opportunities and value-added economic activities and are hence at risk of bankruptcy or liquidation. Consequently, they can be easily identified through assessments of financial statements and reports provided by statutory auditors. As corporate bankruptcy or liquidation will generally affect different groups of stakeholders (e.g. shareholders, managers, employees, and creditors), great efforts have been made by researchers and capital market participants to design and develop models to predict corporate financial distress. Such models aim to
identify indices facilitating the prediction of a company’s future status and can be useful in making appropriate investments and prohibiting waste of resources.
Faster detection of financial distress indicators can warn companies about the possibility of financial distress and pressurize them to take necessary preventive measures. It can also help investors discriminate between favorable and poor investment opportunities and stay away from the latter (Permacahndra, 2009). Bankruptcy prediction and intrusion detection models are techniques and tools which can predict the future status of the companies and estimate the probability of financial distress through combining a group of financial ratios. These models can be classified into three groups Statistical (multiple discriminant analysis models, linear probability, logit, probit, cumulative totals, and partial adjustment process), Artificial intelligence (artificial neural networks, recursive neural networks, genetic algorithms, support vector machines, rough sets, induction, deduction, and fuzzy logic) and theoretical models (balance sheet analysis/entropy, bankruptcy speculator theory, cash management theory, and credit risk theory).Statistics-based and artificial intelligence approaches focus on signs and symptoms of bankruptcy, while theoretical models solely concentrate on reasons and causes of bankruptcy (Aziz & et al, 2006). Data mining techniques have been applied as a new approach for intrusion detection. Bankruptcy prediction is one of the most special economic grounds of data mining which have been much investigated in recent years. In order to compare the accuracy of imperialist competitive algorithm and genetic algorithm in corporate bankruptcy prediction, the current research presents the literature review, introduces the genetic algorithm and the proposed algorithm, develops hypotheses, describes the research design, and finally makes conclusions.
2. Literature Review
research in 1942, Charles Merwin introduced a model with three variables of working capital to total assets ratio, equity to total debt ratio, and current ratio. In 1996, William Beaver used univariate analysis and could successfully predict financial stress five years before its occurrence in 78% of cases.
Later studies evaluated multivariate models. For instance, Edward Altman selected 22 financial ratios and analyzed them by using z-scores of five ratios. The accuracy of his model was about 95% and 83% in predicting bankruptcy one and two years prior to the event, respectively (Altman E.L, 1968). In 1993, Altman used four financial ratios instead of five to increase the predictive power of his model for non-manufacturing companies and provided more accurate prediction. Ohleson (1980) developed a model by applying the logit function on nine financial ratios as independent variables. Five of these ratios had been used in previous studies. Based on comparisons between 46 bankrupt companies and a number of successful companies during 1969-76, Taflerr presented a model to predict bankruptcy (Taflerr J, 1984). King Don et al. (1995) were the first to use a genetic algorithm in bankruptcy prediction. Studying a sample of 236 bankrupt and 264 non-bankrupt companies through genetic algorithm, Varetto et al. (1998) reported an accuracy of 93.0% and 91.6% in predicting bankruptcy one and two years before the event, respectively. McKee et al. (2000) criticized previous studies in the field of bankruptcy prediction and used the recursive partitioning algorithm (decision tree) with six ratios as independent variables for this purpose. Shah and Murtaza (2002) predicted bankruptcy with a model based on an artificial neural network. After assessing data from 60 bankrupt and 54 non-bankrupt firms between 1992 and 1994, they calculated the accuracy of their model as 73%. Shin and Lee (2002) suggested genetic models as suitable, easy to use models to predict financial distress. Kawakami et al (2004) compared the pre-selection algorithm, genetic algorithm, and multi-discriminant analysis and introduced the first and last methods as the most and least favorable, respectively. Min and Lee (2005) concluded that support vector machines had better performance in bankruptcy prediction than traditional statistical models. Lensberg et al (2006) used genetic programming for 28 potential bankruptcy variables previously identified as significant and found six variables to be important. Min et al. (2006) applied
Mousavi Shiri et al. (2012) studied DEA on a sample of 60 companies listed on Tehran Stock Exchange over a period from 2000 to 2010 and examined the efficiency of financial distress prediction. Findings of this study indicated that efficiency plays a significant role in financial distress prediction so that it demonstrates necessary signs for bankruptcy from two years before. Moradi et al. (2013) applied FCM and support vector data description (SVDD) to the financial distress prediction problem in an attempt to suggest a new model with better explanatory power and stability. To evaluate the prediction accuracy of SVDD, they compared its performance with fuzzy c-means (FCM). According to the data obtained from 24 financial ratios between 2000 and 2009, 70 pairs of companies listed on Tehran Stock Exchange were selected as initial data set. Results from algorithm test based on support vector data description show that model accuracy in classifying financial distress samples in the financial distress occurrence year, One and two years before it, is 91.9%, 85% and 78% respectively. While results from algorithm test based fuzzy c-means indicated that model accuracy in classifying financial distress samples in the financial distress occurrence year, One and two years before it, is %96.67, %83.44and %77.34 respectively. Rostami et al. (2013) compared Support Vector Machine and Particle Swarm Optimization algorithm models and investigated a sample of 79 healthy and 79 bankrupt companies from 2005 to 2010. Based on related and previous articles 56 financial ratios on classifying profitability, liquidity, operating and financial leverage were chosen as the independent variables. The results indicate that the Support Vector Machine algorithm had better ability for predicting bankruptcy in comparison with particle swarm optimization algorithm. Kim et al. (2014) used decision tree and AdaBoost-decision tree algorithms in order to predict financial distress for a sample of 722 restaurants from 1988 to 2010. Their findings proved the superiority of AdaBoost-decision tree algorithm and its lower error. In addition, the most significant ratio in this study was liability to shareholders’ equity. Golet (2014) examined binary regression to predict bankruptcy. He conducted this study in Romania from 2008 to 2012 and found that fixed assets ratio, fixed assets turnover, working capital and ownership ratio have negative effect on bankruptcy risk, while collection period has a positive effect.
Bredart (2014) applied artificial neural networks and three variables of shareholders’ equity (property from financial status classification, current ratio from equity classification, the ratio of net income to property from profitability classification) studied bankruptcy prediction in Belgium from 2002 to 2012. His findings indicated %80 success of neural network in bankruptcy prediction. In this study, a model of imperialistic competitive algorithm which considered as one of the first time bankruptcy prediction models in Iran and also considered as one of the artificial intelligence models that have been studied and finally, the results of this model are compared with the genetic algorithm. Gang et al. (2015) in a research attempt to predict the financial distress of 107 Chinese companies listed on the stock market between 2001 and 2008 using data mining techniques. Accordingly, using this technique, financial distress alert models were designed and built. The results of the research with a comparative approach showed that neural networks have more predictive accuracy than Support Vector Machine and decision tree. Salehi et al. (2016) used a sample of 159 companies during the years 2011-2014 on Tehran Stock Exchange to predict the financial distress using data mining techniques. Their research results show that the Artificial Neural Networks (ANN) better serves the k-Nearest Neighbor (KNN) and Naïve Bayesian Classifier (NBC) bankruptcy prediction. Wagle et al. (2017) in their research, used neural network data mining techniques, backup machines, Bayesian networks and logistic regression, and 120 companies with 30 financial ratios to predict corporate bankruptcy. Their research results showed that the artificial neural network has better predictive power than other models.
3. Methodology
3.1 Overview of Imperialist Competitive
Algorithm
some of the best initial countries (the countries with the least cost function value), become Imperialists and start taking control of other countries (called colonies) and form the initial Empires. The absorption policy makes the main core of this algorithm and causes the countries move towards to their minimum optima. The imperialists absorb these colonies towards themselves with respect to their power. The total power of each imperialist is determined by the power of its both parts, the empire power plus percents of its average colonies power.
T.C.n = Cost (imperialist) + ξ mean {Cost (colonies of
empiren)} (1)
Imperialist competitive algorithm process can be summarized as follows:
1. Select some random points on the function and initialize the empires.
2. Move the colonies toward their relevant imperialist (assimilation).
Fig.2 shows the movement of a colony towards the imperialist. In this movement, θ and x are random numbers with uniform distribution as illustrated in formula (2) and d is the distance between colony and the imperialist.
(2)
x ∼U (0, β × d ), θ∼U (−γ, γ)
Where β and γ are parameters that modify the area that colonies randomly search around the imperialist. In our implementation β and γ are considered as 2 and 0.5 (Radian) respectively.
3. During assimilation and revolution a colony might reach a better position and has the chance to take the control of the entire empire and replace the current imperialist state of the empire.
Figure 1. Initial imperialist formation
3. Replacement of imperialist and colony
Figure 4. Total empire (after replacement) Figure
4. Compute the total cost of all empires (considering the cost of both imperialist and its colonies).
5. Pick the weakest colony (colonies) from the weakest empire and give it (them) to the empire that has the most likelihood to possess it (Imperialistic competition).
Figure5. Imperialistic competition
6. Eliminate the powerless empires.
7. If there is just one empire, then stop else continue and go to stage 2. Algorithm continues with the mentioned steps until a stop condition is satisfied and there is only one empire (Atashpaz-Gargari and et al,2007).
3.2. Introduction to Genetic Algorithms
Fundamental principles of the genetic algorithm were introduced by John Holland (from the University of Michigan) in 1975. Later in 1989, Golberg developed the concepts of the genetic algorithm (Goldberg, D.E, 1989). Genetic algorithm is a probabilistic search method which mimics natural evolution. This algorithm utilizes the survival of the fittest to produce better estimates of the response from a population of potential solutions. In each generation, a set of solutions is created through selecting individuals with the highest fitness in the problem domain and breeding those using genetic operators. This process evolves the first population toward a new one with better fitness compared to its parents. The overall structure of the genetic algorithm is as follows:
1)Genes and chromosomes: Genes, the smallest building blocks of the genetic algorithm, are used to encode the parameters. Each string of genes (called a chromosome) is a proposed solution to the problem which may or may not be appropriate (Sinriech. D, Samakh .E, 1999). 2)Population: A set of chromosomes is called a
population. A main characteristic of the genetic algorithm is focusing on a population of chromosomes rather than one point of the solution domain (Fogarty. T.C, 1989).
3)Fitness function: It determines how well individuals can solve the problem. In this study, the fittest individuals had the value of the fitness function (Van larhoven. P.J.M, Aarts. E.H.L, 1987).
4)Genetic operators: A new generation of solutions (children) can be obtained by applying genetic operators on the previous generation. Genetic operators include:
a) Crossover: It combines two randomly selected chromosomes (parents) to produce two new chromosomes (children). A significant concept associated with this operator is the crossover rate which is obtained by dividing the number of created children in each generation to the population size (Van larhoven. P.J.M, Aarts. E.H.L, 1987).
gene to produce a new genetic structure. In the genetic algorithm, mutation reassures that all strings will be searched (the probability of search will not be zero in any string) (Van larhoven. P.J.M, Aarts. E.H.L, 1987).
c) Generation: Each iteration of the algorithm that leads to creation of a new population is called a generation (Powell, D and Skolnick, M, 1993).
Iterations continue until a pre-defined termination condition, e.g. obtaining the maximum number of generations or an acceptable level of competence, is reached.
3.3. Research Hypotheses
Based on the research objectives, the following hypotheses were considered:
3.3.1. The First Group of Hypotheses
The first two hypotheses related to the capability of the models in predicting corporate financial distress prediction:
1) The first hypothesis: Financial distress of companies registered in Tehran stock market can be predicted with imperialist competitive algorithm.
2) The second hypothesis:Financial distress of companies registered in Tehran stock market can be predicted with genetic algorithm.
3.3.2. The Second Group of Hypotheses
The third hypothesis tried to find probable significant differences between the two models in the current financial environment of Iran environmental conditions.3) Third hypothesis: The overall accuracy of the predictions made by imperialist competitive algorithm and genetic algorithm is different.
3.3.3. The Research Sample
Companies registered in Tehran stock market constituted the research population. Therefore, two statistical samples were included in this study, i.e. 38 companies experiencing financial distress (according to the article 141 of the Iranian commercial law) and
38 successful companies were selected from their relevant populations. Also in this study, used paired samples.
3.4. Sampling
3.4.1.
Selecting Distressed Companies
A list of companies subject to the article 141 of the Iranian commercial law during 2010-16 was prepared. Due to the inaccessibility of data, this seven-year period was considered as the research time span. Since the models designed in this study were tested one, two, and three years prior to the incidence of financial distress, the analyzed data actually belonged to 2007-16. Although the initial list included 452 companies, the financial data of only 140 companies was fully accessible. After selecting 70 companies as the sample, 38 companies were finally recruited to increase accuracy. All models in this study have been implemented through the application of Toolbox NNTool coding in Matlab Software (2011).
3.4.2 Selecting Successful Companies
As mentioned, paired samples were used in this study. Hence, a uniquely matched successful company was selected for each previously selected distressed company. Successful companies were only included if they matched their distressed counterparts in terms of financial data availability during a three-year period and size or industry. A successful company with the closest total assets to that of a distressed company at the time of financial distress (year t) and accessible financial data during the three earlier years (year’s t-1, t-2, and t-3) was selected as the counterpart of the distressed company. For bankrupt companies, the based year (t) is the year when the company becomes subject to the article 141 of Iranian commercial law. For successful companies, however, it is defined as the year when the company gains the highest retained earnings.
successful companies matching distressed samples in the range of logarithm of total assets were selected.
3.5. Research Variables
Determining and defining variables is dispensable to every research. This study included independent and dependent variables.
3.5.1. Independent Variables
Financial ratios constituted independent variables in the analysis of the genetic algorithm model section.
3.5.2. Dependent Variables
Belonging a company to either distressed or successful groups was considered as the dependent variable in all the developed models in this study.
3.6. Analysis of the Genetic Algorithm
Model
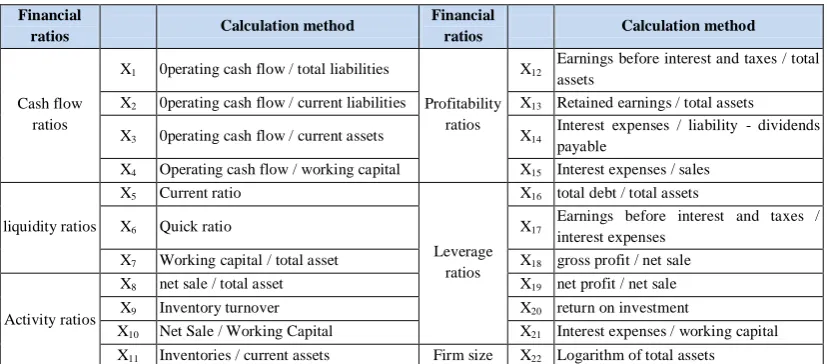
Variables of the genetic algorithm model were selected through three stages. First, the available literature on bankruptcy prediction was reviewed and the most fitting variables (n= 40) were selected from the 60 previously identified predictive variables (financial ratios). In the second stage, 22 variables were selected from the 40 mentioned variables based on the accessibility of essential data (Table 1).
Table 1: Financial Ratios
Financial
ratios Calculation method
Financial
ratios Calculation method
Cash flow ratios
X1 0perating cash flow / total liabilities
Profitability ratios
X12 Earnings before interest and taxes / total assets
X2 0perating cash flow / current liabilities X13 Retained earnings / total assets
X3 0perating cash flow / current assets X14 Interest expenses / liability - dividends payable
X4 Operating cash flow / working capital X15 Interest expenses / sales
liquidity ratios
X5 Current ratio
Leverage ratios
X16 total debt / total assets
X6 Quick ratio X17 Earnings before interest and taxes / interest expenses
X7 Working capital / total asset X18 gross profit / net sale
Activity ratios
X8 net sale / total asset X19 net profit / net sale
X9 Inventory turnover X20 return on investment
X10 Net Sale / Working Capital X21 Interest expenses / working capital X11 Inventories / current assets Firm size X22 Logarithm of total assets
In the third stage, five variables (X1, X5, X12, X16, and X19) were selected using the genetic algorithm. A company is bankrupt only if X1 < 0.082, X5
< 5.43, X12 < 1.146, X16 > 0.726, and X19 < -0.62 Otherwise, it is non-bankrupt.
4. Results
4.1. Application of the Genetic Algorithm
in Bankruptcy Prediction Modeling
The sample size and the number of variables, chromosomes, and rules of each string were determined at the beginning of the modeling process. The model included 22 financial ratios as variables, five rules in each string, and an initial population of 200 chromosomes. Encoding and possible solutions of the developed algorithm were expressed as non-binary strings. Each rule includes three genes (bit): variable, variable’s sign (less or more), and variable’s amount.
In this model, the regarded field is designed as follows:
String {Var1, Op1, X1, Var2, Op2, X2, … Varn, Opn, Xn}
produced more strings and hence omitted less fitting chromosomes. After creating the initial population, the fitness function of the total population was computed. Then, the median of all values was calculated and chromosomes with fitness function values lower than the median were regarded as unsuitable solutions and hence removed from the population. In the next stage, new solutions were created by genetic operators and previous steps were repeated. At this stage, the roulette wheel selection technique was used to select chromosomes for breeding a new generation. A random number between one and five (number of rules) was then selected as the crossover point (single point crossover). The final assimilation rate was 0.7 in this model.
Mutation was the next stage through which chromosomes were moved in the search space and the probable lost information of the population was recovered. The mutation rate was set 0.07 in this model. In the last step before the implementation of the algorithm, we determined the termination conditions as the following:
1) the most fitting chromosomes do not change after 22 times implementation of the algorithm.
2) The algorithm has been repeated 500 times; Mention must be made that in Generation, 1000 is the best model.
4.1.1. Results of the Genetic Algorithm Model:
The designed genetic algorithm model could successfully predict %92 of the bankrupt companies and %95 of non-bankrupt companies at year t-1 (one year before the base year). Its median prediction accuracy was hence %93.5 at the mentioned year (Table 3).At year t-2 (two years before the base year), the model had an accuracy of %82 in predicting bankruptcy and %90 in predicting non-bankruptcy. The overall accuracy of the model was %86 at this year (Table 4).
Finally, three year before baseline, the model predicted bankrupt and non-bankrupt companies with accuracy of %85 and %95 respectively. The overall accuracy of the model was calculated as %90 at this year (Table 5).
Table 2. The best fitting chromosomes after the termination of the algorithm
-0.62 ˂ X19 0.726 < X16 1.146 ˂ X12 5.43 ˂ X5 0.082 ˂ X1
Table 3. Classification of the studied companies by the genetic algorithm model one year before the base year (t-1)
Type of company Total
(n) Bankrupt (n) Non-bankrupt (n)
Bankrupt (%)
Non-bankrupt
(%)
Total (%)
Overall accuracy
(%)
Bankrupt 38 35 3 92 8 100
93.5
Non-bankrupt 38 2 36 5 95 100
Table 4. Classification of the studied companies by the genetic algorithm model two years before the base year (t-2)
Type of company Total
(n) Bankrupt (n)
Non-bankrupt (n)
Bankrupt (%)
Non-bankrupt
(%)
Total (%)
Overall accuracy
(%)
Bankrupt 38 31 7 82 18 100
86
Table 5. Classification of the studied companies by the genetic algorithm model three years before the base year (t-3)
Type of company Total
(n) Bankrupt (n)
Non-bankrupt (n)
Bankrupt (%)
Non-bankrupt
(%)
Total (%)
Overall accuracy
(%)
Bankrupt 38 32 6 85 15 100
90
Non-bankrupt 38 2 36 5 95 100
4.2. Implementation of the Imperialist
Competitive Algorithm
Similar to the genetic algorithm model, this model was also implemented using MATLAB software. At the beginning of the modeling, the initial population, number of empires, assimilation coefficient (β) and deviation angle (θ), revolution rate, and the number of occurrences of evolution were determined.
To start the algorithm, 500 initial countries (all colonies) were created. Ten countries were then selected as imperialists and the remaining countries constituted the colonies. As mentioned earlier, empires with greater numbers of colonies have higher power and larger territory. Revolution rate equals 0.2, Deviation angle and revolution rate were set 45° and 0.01, respectively. The coefficient of the effect of colonies power to total empire power equals 0.02 in imperialism competitive algorithm. Algorithm termination consists of a limited number of generations, latency and change in objective function to two decimal places. The stop condition was considered 500 repetitions of the algorithm since this
number of repetitions would leave only one empire and terminate the imperialistic competition.
It should be noticed that the number of countries, initial imperialists, revolution rate and time period in imperialist competitive algorithm are determined through trial and error method.
4.2.1. Results of the Imperialist Competitive
Algorithm Model:
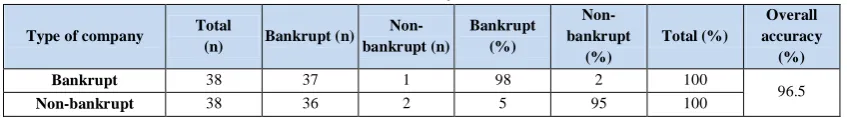
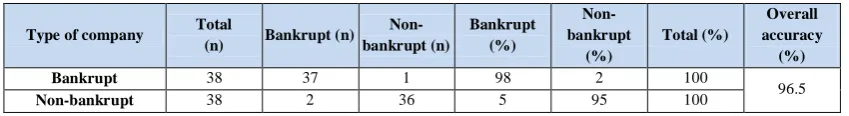
At year t-1, the designed imperialist competitive algorithm model predicted bankruptcy and non-bankruptcy with an accuracy of %98 and %95 respectively. The median prediction accuracy of the model was %96.5 at this point (Table 6).
The prediction accuracy of the model at year t-2 was %95 for both bankrupt and non-bankrupt companies. The overall accuracy of the model was hence %95 as well (Table 7).
Finally, at year t-3, the imperialist competitive algorithm model could successfully predict bankruptcy and non-bankruptcy in %98 and %95 of the cases, respectively. The overall accuracy of the model was %96.5 at this year (Table 8).
Table 6. Classification of the studied companies by the imperialist competitive algorithm model one year before the base year (t-1)
Type of company Total
(n) Bankrupt (n)
Non-bankrupt (n)
Bankrupt (%)
Non-bankrupt
(%)
Total (%)
Overall accuracy
(%)
Bankrupt 38 37 1 98 2 100
96.5
Non-bankrupt 38 36 2 5 95 100
Table 7. Classification of the studied companies by the imperialist competitive algorithm model two year before the base year (t-2)
Type of company Total
(n) Bankrupt (n)
Non-bankrupt (n)
Bankrupt (%)
Non-bankrupt
(%)
Total (%)
Overall accuracy
(%)
Bankrupt 38 36 2 95 5 100
95
Table 8. Classification of the studied companies by the imperialist competitive algorithm model three year before the base year (t-3)
Type of company Total
(n) Bankrupt (n)
Non-bankrupt (n)
Bankrupt (%)
Non-bankrupt
(%)
Total (%)
Overall accuracy
(%)
Bankrupt 38 37 1 98 2 100
96.5
Non-bankrupt 38 2 36 5 95 100
Considering the results of the designed model in three years before bankruptcy, first errorii is less than second erroriii; so that the model classifies bankrupt firms more accurately than healthy firms. Low amount of the first error in proportion to the second error is necessary.
4.3. Testing the Hypotheses
The first group of hypotheses (regarding the appropriateness of the imperialist competitive algorithm and genetic algorithm models) was redefined as follows:
1. The first hypothesis: The imperialist competitive algorithm models can predict financial distress of companies registered in Tehran Stock Exchange with accuracy of more than %80. The mean accuracy of the designed model had a 16 percent difference with the assumed value (%96 vs. %80). According to Student’s t-test, this difference was statistically significant (P=0.002). Therefore, it can be said with %99.8 certainty that the imperialist competitive algorithm is an appropriate method to predict bankruptcy.
2. The second hypothesis: The genetic algorithm models can predict financial distress of companies registered in Tehran Stock Exchange with accuracy of more than %.80. Student’s t-test suggested a significant difference between the model’s accuracy (%89.84) and the assumed level (P=0.07). Thus, there is %93 certainty about the appropriateness of the genetic algorithm in bankruptcy prediction.
The second group of hypotheses involved the comparison between the two models. The mean accuracy of the imperialist competitive algorithm model (%96) was %6.16 higher than that of the genetic algorithm model (%89.84) (P=0.01). Hence, the imperialist competitive algorithm can predict
bankruptcy with significantly higher accuracy compared to the genetic algorithm.
5. Discussion and Conclusions
Corporate bankruptcy prediction is an attractive and important issue in the field of financial research. Considering the effects of this phenomenon on micro- and macro-levels of the society, a variety of tools and models have been presented to predict bankruptcy. This study compared the imperialist competitive algorithm and genetic algorithm models and found the first to have significantly higher accuracy than the latter (%96.5, %95 and %96.5 at one, two, and three years before bankruptcy vs. %93.5, %86 and %90 at the same intervals). Considering the high predictive power of the studied models, they can be used by managers to predict bankruptcy and prevent its high costs by adopting appropriate measures, by investors and financiers to make profitable financial decisions and to invest in profitable financial services, and also by auditors to comment about the ongoing activities of corporates. Regarding the type of independent variable in this study, distinguishing bankrupt firms from healthy ones is of great importance. In other words, low amount of the first error should be put higher priority. Nevertheless, none of the mentioned models can declared a company as bankrupt. Such predictions may just be warnings about a future bankruptcy (sine one model might predict a company to be bankrupt while another predicts in non-bankruptcy in the future). Overall, the results of the current research can be beneficial in preventing financial distress and bankruptcy and their consequences, but after the prediction, also must be discussed tracing the root causes of problem.
References
2) Ahn H, Kim K. j. (2009). Bankruptcy Prediction modeling with hybrid case –based reasoning genetic algorithms approach. Applied soft computing, 9(2), 599-607.
3) Alforo, E, Garcia, N, Gámez, M, Elizondo, D. (2008). Bankruptcy forecassting: An empirical camparison of adaboost and neural networks. Decision Support Systems, 45(1), 110-122. 4) Altman, E. L. (1968). Financials Ratios,
Disarmament Analysis and the prediction of corporate Bankruptcy. The Journal of finance, 23(4), 598- 609.
5) Altman, E .L. (1993). 'Corporate Financial Distress and Bankruptcy: A Complete Guide to Predicting & Avoiding Distress and Profiting from Bankruptcy'. John Wiley & Sons Inc, Canada.
6) Atashpaz-Gargari, E and C. Lucas. (2007). 'Imperialist competitive algorithm: for optimization Inspired by imperialist competition'. In IEEE congress on evolutionary computition. 7) Beaver W.H. (1966). Financial ratios as predictors
of failure. Journal of accounting research,4 ,71-111.
8) Brédart, X. (2014). Bankruptcy Prediction Model Using Neural Networks. Accounting and Finance Research, 3(2), 124-128.
9) Cheng CH. LE. (2012). the use of financial ratios to predict bankruptcy: A study of the board of directors on corporate performance. PhD thesis, Capella University.
10) Fogarty. T.C. (1989). Varying the probability of mutation in the genetic algorithm. Morgan Kaufmann publishers, CA.
11) Geng, R., Bose, I & Chen,X. (2015). Prediction of financial distress: An empirical study of listed Chinese companies using data mining. European Journal of Operational Research, 241(1), 236-247. 12) Gepp, A., Kumar, K., Bhattacharya, S. (2010). Business failure prediction using decision trees. J. Forecast. 2(6), 536–555.
13) Goldberg, D.E. (1989). Genetic Algorithm in Search, Optimization and Machine Learning. Addisson-Wesley Longman Publishing CO. 14) Golet, J. (2014). Symmetric and asymmetric
binary choice models for corporate bankruptcy. Procedia - Social and Behavioral Sciences, 124, 282–291.
15) Holland, J. H. (1975). Adaptation in Natural and Artificial Systems. The University of Michigan. 16) Kawakami, Becerra, seada. (2004). Ratio
Selection for Classification Models. Data Mining and Knowledge Discovery, 8(2), 151-170. 17) King Don J. Feldman K. (1995). Genetic
Algorithms and application to finance. Applied mathematical finance, 2(2), 89-116.
18) Lee Y. A., Shin, K. (2002). Genetic Algorithm Application in Bankruptcy prediction modeling. Expert systems with application, 23(3), 321-328. 19) Lensberg T., Eilifsen A., McKee T.E. (2006).
Bankruptcy theory development and classification via genetic program. European Journal of operational research, 169(2), 169-697.
20) Li, H., Sun, j. (2009). Predicting business failure using multiple case-based reasoning combined with support vector machine. Expert Syst, 36(6), 10085-10096.
21) McKee, T.E., Greenstein, M. (2000). Predicting bankruptcy using recursive partitioning and realistically proportioned data set. Journal of forecasting, 19(3), 219-230.
22) Merwin, C. (1942). Financing Small in Five Manufb. Cturing Industries, New York: National Bureau of Economic Research, 1926–1936. 23) Min H. Jee., Lee. C, Young. (2005). Bankruptcy
prediction using support vector machine with optimal choice of kernel function parameters. Expert systems with application, 28(4), 603-614. 24) Min S.H., Lee J., Han I. (2006). Hybrid genetic
algorithms and support vector machines for bankruptcy prediction. Expert systems with applications, 31(3), 652-660.
25) Moradi, M., Salehi, M., Ghorgani, M.E., Sadoghi Yazdi, H. (2013). Financial Distress Prediction of Iranian Companies Using Data Mining Techniques. Research papers, 46(1), 20-27.
26) Mosavi Shiri, M., Salehi, M. (2012). Prediction of
Financial Distress in Tehran Stock Exchange Using DEA Approach. Indian Journal of Science and Technology, 5(10), 3461-3473.
27) Ohleson J. (1980). Financial ratios and the probabilistic prediction of bankruptcy. Journal of Accounting Research, 18(1), 109-131.
Fifth ternational, Conference on Genetic Algorithms, 424-430.
29) Premachandra I. M., Bhabra, G. S., Sueyoshi, T. (2009). DEA as a Tool for Bankruptcy Assessment. European journal of Operational Research, 193(2), 412-424.
30) Rostami, Neda., Salehi, Mahdi., Shoorvarzy, Mohammad Reza., Davoodi, Alireza. (2013). Comparison Models of Corporate Bankruptcy Prediction in Companies Listed in Tehran Stock Exchange by Particle Swarm Optimization Algorithm and Support Vector Machine Algorithm. Journal of American Science, 9(5s), 24-29.
31) Shah, J.R., Murtaza M.B. (2002). A neural network based clustering in bankruptcy prediction modeling. Expert Systems with Application, 23(3), 321-328.
32) Sinriech. D., Samakh .E. (1999). A Genetic Approach to the pick up/delivery station location problem in segmented flow based material handling systems. Journal of manufacturing system, 18(2), 81-99.
33) Smith A.H., Winakor A.H. (1935). Changes in the Financial Structure of Unsuccessful Corporations. University of Illinois: Bureau of Business Research.
34) Soo Y. Kim., Arun Upneja. (2014). Predicting restaurant financial distress using decision tree and AdaBoosted decision tree models. Economic Modelling, 36, 354-362.
35) Taflerr J. (1984). Emprical Model for the monitoring of UK Corporation. Journal of banking and finance, 8(2), 199-227.
36) Salehi, M., Mousavi Shiri, M & Bolandraftar Pasikhani, M. (2016). Predicting corporate financial distress using data mining techniques: an application in Tehran Stock Exchange. International Journal of Law and Management, 58(2), 216-230.
37) Van larhoven. P.J.M., Aarts. E.H.L. (1987). Simulated annealing: theory and application dordecht, kluwer.
38) Varetto, F. (1998). Genetic Algorithms application in the analysis of insolvency risk. Journal of banking and finance, 22(10-11), 1421-1439.
39) Wu, C.H., Tzeng. G.H., Yeong -Jia G., Fang W.C. (2007). A Real-Valued Genetic Algorithm, To
Optimize the Parameters of Support Vector Machine for Prediction Bankruptcy. Journal of Expert Systems with Application, 32(2), 397-408. 40) Xie Chi, Changqing Luo., Xiang Yu. (2011). Financial distress prediction based on SVM and MDA methods: the case of Chinese listed companies. Springer Science, 45(10), 671-686. 41) Wagle, M., Yang, Z & Benslimane, Y. (2017).
Bankruptcy Prediction using Data Mining Techniques. 2017 8th International Conference of Information and Communication Technology for Embedded Systems (IC-ICTES).