SYSTEMATIC REVIEW
The effectiveness of spawning
habitat creation or enhancement
for substrate-spawning temperate fish:
a systematic review
Jessica J. Taylor
1,2,3*†, Trina Rytwinski
1,2,3†, Joseph R. Bennett
1,3, Karen E. Smokorowski
4, Nicolas W. R. Lapointe
5,
Richard Janusz
6, Keith Clarke
7, Bill Tonn
8, Jessica C. Walsh
9and Steven J. Cooke
1,2,3Abstract
Background: Habitat is the foundation for healthy and productive fisheries. For fish that require substrate for spawn-ing, lack of appropriate spawning substrate is inherently limiting and a lack of access to suitable spawning habitat will lead to population collapse. To ensure management resources are being allocated wisely and conservation targets are being achieved, there is an increased need to consider the effectiveness of techniques to enhance or create habitat that has been lost. The aim of this systematic review was to assess the effectiveness of techniques currently used to create or enhance spawning habitat for substrate-spawning (including vegetation-spawning) fish in temperate regions, and to investigate the factors that influence the effectiveness of habitat creation or enhancement. Methods: Searches for primary research studies on the effect of spawning habitat creation or enhancement for substrate-spawning fish were conducted in bibliographic databases, on websites and an online search engine, through evidence call-outs, social media, and Advisory Team contacts, and in the bibliographies of relevant reviews. All articles were screened at two stages (title and abstract, and full-text), with consistency checks being performed at each stage. Relevant articles were critically appraised and meta-data and quantitative data were extracted into a data-base. All included studies were described narratively and studies that met the criteria for meta-analysis were analyzed quantitatively.
Review findings: A total of 75 studies from 64 articles were included in this systematic review and underwent data extraction and critical appraisal. The majority of these studies were from North America (78.1%) and a large percent-age (63.7%) targeted salmonids. We conducted a meta-analysis using data from 22 studies with 53 data sets. Avail-able evidence suggests that the addition or alteration of rock material (e.g., gravel, cobble) was effective in increasing the abundance of substrate-spawning fish compared to controls, with a taxonomic bias towards salmonids (5/6 data sets). The addition of plant material (e.g., large woody debris) with or without physical alterations to the water-body (e.g., excavation) was also effective in increasing substrate-spawning fish abundance on average compared to controls. Egg life stages (i.e., nests, redds, zygotes or developing embryos) were associated with larger increases in abundance with habitat creation or enhancement than age-0 life stages (i.e., alevin, fry, young-of-the-year). We found
© The Author(s) 2019. This article is distributed under the terms of the Creative Commons Attribution 4.0 International License (http://creat iveco mmons .org/licen ses/by/4.0/), which permits unrestricted use, distribution, and reproduction in any medium, provided you give appropriate credit to the original author(s) and the source, provide a link to the Creative Commons license, and indicate if changes were made. The Creative Commons Public Domain Dedication waiver (http://creat iveco mmons .org/ publi cdoma in/zero/1.0/) applies to the data made available in this article, unless otherwise stated.
Open Access
*Correspondence: [email protected]
†Jessica J. Taylor and Trina Rytwinski contributed equally to this manuscript
1 Canadian Centre for Evidence-Based Conservation, Institute of Environmental Sciences and Interdisciplinary Sciences, Carleton University, 1125 Colonel By Drive, Ottawa, ON, Canada
Background
Habitat is the foundation for healthy and productive fisheries [1]. When critical habitats for fish are lost, degraded or altered, their ability to support life pro-cesses of fish may be compromised [2]. To ensure that fish habitats are appropriately managed, many jurisdic-tions require some form of offsetting (or compensation) for habitats that will be lost or degraded due to human developments. Several methods of habitat creation or enhancement have the potential to increase fish pro-ductivity, i.e. production rates of fish species of interest, biomass [3].
Access to and quality of spawning habitats are critical to the success and productivity of a fish population [2], especially for substrate-spawning fish [4, 5]. For these species, degradation or loss of appropriate spawning substrate, often caused by human activity, is inherently limiting and may lead to population collapse [6]. Crea-tion or enhancement of spawning habitat is often used to mitigate or offset the destruction/degradation of spawn-ing substrate, though may also be used to simply enhance habitat. However, to be suitable for a target species, spawning habitat must have specific properties matched to the species’ ecological niche, not all of which may be known to practitioners. Thus, there is much interest in identifying the extent to which spawning habitat creation or enhancement interventions are effective at increasing population size or productivity of substrate-spawning fish. Identifying the extent to which spawning habitat creation or enhancement interventions are effective is of particular interest in temperate regions where substrate-spawning species such as salmonids (e.g., Atlantic salmon, brook trout, lake trout), centrarchids (e.g., black bass), percids (e.g., walleye), and ictalurids (e.g., brown bullhead) are common, and in jurisdictions, such as Can-ada, that have well-developed regulatory frameworks for habitat protection and restoration.
Some of the most common restoration or enhance-ment measures for spawning habitat include additions of instream structures, such as large woody debris, boul-ders/cobbles, logs jams, and brush bundles [7]. For exam-ple, enhanced gravel beds provide suitable spawning habitat for salmonids [8, 9] and have resulted in higher survival rates to the swim-up stage (at which point alevin swim to the surface for the first time to fill their swim bladder with air) [10]. These structures not only pro-vide favourable habitat for juveniles [3, 11], but can also recruit and store gravel [12] which is of particular benefit to many substrate spawners.
To effectively create or enhance spawning habitat, it is important to identify habitat and environmental charac-teristics that influence productivity for specific species. The spawning habitats used by fishes are quite varied and factors such as temperature, depth, wave exposure, water quality, water velocity, vegetation composition, and adja-cency to nursery habitat, must all be considered when attempting to design a successful habitat restoration or offset project [13, 14]. Species often have specific sub-strate requirements and preferences [4], and spawning behavior including nest building and guarding [4, 15]. For instance, Curry and Noakes [16] examined selection of spawning sites in brook trout (Salvelinus fontinalis) and demonstrated important relationships between ground-water and spawning success that varied substantially among populations across geologic regions. For example, in the Canadian Shield waters, spawning in brook trout was associated with areas of distinct discharging ground-water, whereas in southwestern Ontario, discharging groundwater was observed throughout spawning areas and nonspawning areas. Other species, such as Chinook salmon (Oncorhynchus tshawytscha), spawn in sites with downwelling or upwelling depending on the population. These behaviours prompted further investigation into the importance of water quality characteristics such as no detectable effect of ecosystem type (lotic vs. lentic waterbodies) or time since habitat creation or enhancement on intervention effectiveness for fish abundance.
Conclusions: The synthesis of available evidence suggests that the addition or alteration of rock material (e.g., addi-tion of gravel, substrate washing) was an effective means of enhancing spawning habitat, but results may only be applicable for salmonids. Furthermore, the synthesis suggests that on average, the addition of plant material with or without waterbody modifications was also effective at increasing fish abundance. Overall, we were limited in our abil-ity to address many of the questions that stakeholders have regarding the circumstances under which spawning habi-tat creation or enhancement is effective for substrate-spawning fish. Before we can provide recommendations with a higher level of certainty, we need to improve research and reporting, and expand research focus to include a broader range of species and intervention types. We provide several recommendations aimed at researchers and practitioners to improve the quality of evidence being generated.
dissolved oxygen and temperature [13]. However, even for species for which information on the necessary physi-cal and chemiphysi-cal spawning habitat attributes exists [17], it remains difficult to re-create these attributes in the wild [18].
With accelerating habitat degradation and loss of biodi-versity in aquatic systems resulting from human activity [19, 20], it is becoming ever more important to consider the effectiveness of methods to enhance degraded habi-tat or create new habihabi-tat. Meta-analyses and systematic reviews are valuable tools to evaluate the effectiveness of conservation interventions to inform environmental policy decisions [21]. Systematic review guidelines pro-vided by the Collaboration for Environmental Evidence ensure that evidence syntheses are rigorous, transparent, and repeatable [22]. Here, this systematic review assesses the effectiveness of techniques currently used to create or enhance spawning habitat for substrate-spawning fish.
Topic identification and stakeholder input
In 2012, Canada’s Fisheries Act was amended to put responsibility on proponents (e.g., persons involved with commercial developments, mineral extraction, mem-bers of the public not engaged in commercial activity, or government municipalities or ministries) to avoid and mitigate any serious harm to fish that are part of a commercial, recreational or Aboriginal fishery, or to fish that support such a fishery resulting from projects affecting aquatic habitat. Fisheries and Oceans Canada (DFO) updated the way they managed threats to fisher-ies from development projects such that if projects could not avoid or mitigate serious harm, proponents were required to develop a plan to counterbalance the residual harm using offsetting measures [23–25]. Offsetting meas-ures will differ on a case-by-case basis; however, all must support fisheries management, balance project impacts, and generate long-term, self-sustaining benefits for the fishery [23]. Resources could be more efficiently used by critically reviewing the effectiveness of past spawning habitat creation or enhancement projects.
During the formulation of the question for this review, an Advisory Team made up of stakeholders and experts was established and consulted. For the purpose of this review, we define stakeholders as “any person or organi-zation who can affect or may be affected by the planning, conduct, results and communication of a systematic review” (see Haddaway et al. [26] for full framework). This team included academics, staff from the Canadian Wildlife Federation (CWF), and staff from DFO, spe-cifically the Fisheries Protection Program (FPP) and Sci-ence Branch. The Advisory Team guided the focus of this review to ensure that primary and secondary questions were both answerable and relevant, and suggested search
terms to capture the relevant literature. Our systematic review is complementary to a systematic review [27] that synthesized evidence on the impact of anthropogenic structural modifications to habitats in shallow water nurseries and/or spawning grounds on fish recruitment, but is broader in scope. Though methods of habitat crea-tion or enhancement have been studied, to our knowl-edge no comprehensive synthesis of evidence has been undertaken to compare the effectiveness of all relevant habitat creation or enhancements for substrate-spawning fish. Some reviews have focused on broader topics such as the effect of a physical structure and cover on fish and fish habitat [17], others focused on a specific family (e.g., salmonids; [28]), a particular habitat (e.g., streams; [29]) or only review a small number of restoration studies on a specific topic (artificial reefs in the Great Lakes [30] or for production of marine fishes [31]; instream structures for salmonids [32]). Discussions with our Advisory Team confirmed the value of systematically reviewing avail-able literature to examine how and when habitat creation or enhancement can benefit populations of substrate-spawning fish. During the course of this review, the Advi-sory Team was consulted to develop the data extraction table and critical appraisal tool and provided feedback on the final manuscript.
Objective of the review
The objective of this systematic review was to evalu-ate the existing literature to assess the effectiveness of spawning habitat creation or enhancement for substrate-spawning fish.
Primary question
What is the effectiveness of spawning habitat creation or enhancement for substrate-spawning fish?
Components of the primary question
The primary study question can be broken down into the study components:
Subject (population): substrate-spawning fish in tem-perate regions (covering a vari-ety of substrate types as per Balon [4, 5]).
Intervention: habitat creation or enhancement. Comparator: no intervention.
Secondary questions
The secondary questions are meant to help guide the overall goals of the systematic review and to ensure that areas of interest are encompassed in the methods. The secondary questions for this systematic review are:
1. Under what circumstances is spawning habitat crea-tion or enhancement effective? In particular:
a. To what extent does spawning habitat creation or enhancement effectiveness differ among inter-ventions?
b. What spawning habitat creation or enhancement measures are most effective for particular taxa? c. Is ecosystem type (lotic vs. lentic waterbodies)
associated with intervention effectiveness? d. Is species life stage associated with intervention
effectiveness?
2. Does the time since habitat creation or enhancement influence intervention effectiveness?
Methods
This review followed detailed methods described in the a priori systematic review protocol [33] and was performed according to the guidelines provided by the Collaboration for Environmental Evidence [22].
Search for articles
This systematic review was based on literature searches using five publication databases, one search engine, and 29 specialist websites (see Additional file 1). In a devia-tion from the protocol, the first 500 results from Google Scholar were used as opposed to the first 200 results and 29 websites were searched as opposed to 31 (see Additional file 1). Reference sections of accepted arti-cles and 52 relevant reviews (see Additional file 2) were hand searched for any relevant titles that were not found using the search strategy. The majority of the literature searches were performed in December 2017–February 2018 (see Additional file 1). We issued a call for evidence to target sources of grey literature through relevant mail-ing lists (Canadian Conference for Fisheries Research, American Fisheries Society), and through social media (Twitter, Facebook) in February and November 2017. The Advisory Team also distributed the call for evidence to relevant networks and colleagues.
Estimating comprehensiveness of the search
To ensure the relevant articles were captured by the search, our search results were checked against a
benchmark list of relevant papers provided by the Advi-sory Team (see Additional file 1). We also searched the reference lists of papers, as mentioned above, until the reviewer deemed that the number of relevant returns had significantly decreased. This increased the likeli-hood that relevant articles not captured by the litera-ture search were still considered.
Article screening and study eligibility criteria
The literature found in publication databases and Google Scholar was screened for eligibility in EPPI Reviewer (eppi.ioe.ac.uk/eppireviewer4). Due to restrictions in exporting search results, the Waves database results were screened in a separate Excel spreadsheet. Prior to screening, duplicates were identified using a function of EPPI Reviewer and then were manually removed by one reviewer (JJT). One reviewer (James Monaghan [JM]) manually identified and removed any duplicates in the Waves spreadsheet.
Screening process
In a deviation from the protocol, the literature was screened at two distinct stages (1) title and abstract and (2) full-text, as opposed to three distinct stages. This change was made to allow for more efficiency by screen-ing both the title and abstract at the same time. Prior to screening the full set of results, a consistency check was done at title and abstract where two reviewers (JM and Jill Brooks [JB]) screened 441/4419 articles (10% of the articles included in EPPI Reviewer; not including grey literature or other sources of literature, or the articles in the Waves spreadsheet). The reviewers agreed on 93.8% of the articles. A third reviewer (JJT) was consulted to resolve any disagreements between screeners and improve consistency before moving forward.
A consistency check was done again at full-text screen-ing with 21/205 articles (10% of the articles included in EPPI Reviewer; not including grey literature or other sources of literature, or the articles in the Waves spread-sheet). The two reviewers (JM and JB) initially agreed on only 61.9% of articles but it was determined that the discrepancies were based largely on interpretation of the inclusion criteria for population (i.e. juveniles; as described below). After discussing disagreements with JJT and clarifying inclusion criteria, JM and JB agreed on 90.48% of articles and screening was allowed to continue. The remaining articles were split between JM and JB for screening. Reviewers did not screen studies (at title and abstract or full-text) for which they were an author.
Eligibility criteria
Our eligibility criteria outlined below are based on the components of our primary question (population, inter-vention, comparator, and outcome).
Eligible populations Populations of substrate-spawning fish in north (23.5°N to 66.5°N) or south (23.5°S to 66.5°S) temperate regions were the subjects of this review. Spawn-ing strategy included lithophils and phytophils as defined by the reproductive guilds described in [4]. Herein, sub-strate-spawning will include both substrate- and vegeta-tion-spawning fish (e.g., northern pike as an example of a vegetation-spawning fish). The relevant subjects included all fish from egg (i.e., zygote or developing embryo) and larval stage (i.e., yolk sac larval stage) to age-0 (e.g., alevin, fry, young-of-the-year [YOY] that are no longer depend-ent on a yolk sac) as well as spawning adults. A decision was made by the Advisory Team to modify the criteria described in the protocol [33] to exclude articles focus-ing entirely on juvenile fish. This decision was made to ensure the focus of this review remained on effective-ness of spawning habitat and not nursery/rearing habitat. Therefore, any non-spawning fish described by authors as older than 1 year (e.g., age 1+, smolt) was excluded. One could argue that some age-0 fish may not be a using the habitat as spawning habitat, but rather using it as nursery habitat. However, we assumed because some researchers measured age-0 fish as the response to a spawning habitat creation or enhancement that this was a relevant and/or preferred age to measure the response. For instance, sal-monids do not emerge from gravel redds until the yolk sac has been fully absorbed; hanging around redds for many weeks because of the protection provided by the spawning substrate. Once the yolk sac has been absorbed, fry relo-cate to more amenable nursery habitat. Researchers often set emergence traps on the spawning substrate to confirm successful salmonid egg development, and thus the traps would capture fry during emergence before relocation to nursery habitat (e.g., [34–36]). Also, a common technique for lake sturgeon (Acipenser fulvescens) spawning habitat assessment is to set larval drift nets immediately below spawning substrate to capture drifting fry seeking more amenable habitat than the spawning shoal, and confirm successful egg development (e.g., [37–39]). Therefore, we included age-0 (e.g., alevin, fry, YOY) fish when authors used this metric for evaluating spawning habitat creation and enhancements.
Eligible intervention Any creation or enhancement of spawning habitat was considered a relevant interven-tion. This included, but was not limited to, the addition of rock or plant material, creation of bays or artificial streams, modifications to the riparian zone, or addition
of human-made structures. Based on discussions with the Advisory Team, interventions that involved flooding or altering flows were excluded, unless it was for the purpose of cleaning or altering the substrate by removing sedi-ment (e.g., [40]). Allowing fish access to pre-existing habi-tat (e.g., adding a culvert) was not considered a relevant intervention for the purpose of this review as it does not involve creating or enhancing a habitat and was excluded.
Eligible comparator A non-intervention comparator was required in every included study. Study designs could take the form of Before/After (BA), Control/Impact (CI), Before/After/Control/Impact (BACI), or Randomized Control Trial (RCT). Relevant comparators included: (1) before data at the same study site, (2) a similar section of the same waterbody with no intervention applied, (3) a nearby waterbody with comparable habitat characteristics and no intervention applied. Contrary to what was pro-posed in the protocol [33], articles where evaluation of a spawning habitat creation or enhancement intervention was compared to an alternative level of that intervention (rather than to a no intervention comparator group) were excluded. We decided these studies were of limited value because they could not be compared to studies with non-intervention comparators in a quantitative analysis. Stud-ies that reported only post-treatment monitoring data (i.e. no before or control site data) were excluded from this review. Simulation studies, review papers, and policy dis-cussions were also excluded from this review.
Eligible outcomes Only direct outcomes in the form of a quantitative or qualitative measured effect of intervention were included. Relevant outcomes included, but were not limited to, abundance/density of nests, eggs, or age-0 fish, survival/success of nests or eggs, presence of spawning adults. Relative abundance estimates based on catch-per-unit-effort (CPUE) were also included, but indirect esti-mates using survival rate calculations or changes in physi-cal habitat measures like spawning area were excluded.
Language Only English-language literature was included during the screening stage.
Study validity assessment Study validity assessment
within the Avery 1996 article”). The critical appraisal framework (see Table 1) was developed based on fea-tures recommended by Bilotta et al. [41] and was adapted to incorporate components specific to the studies that answer our primary question. The frame-work used to assess study validity was reviewed by the
Advisory Team to ensure that it accurately reflected the characteristics of an ideal study, regardless of resources or experimental/field restrictions. For exam-ple, in the case of habitat restoration, a high number of true replicates is not always feasible, due to spatial or financial constraints, and is therefore uncommon. Table 1 Critical appraisal tool for study validity assessment
Reviewers provided a rating of high, medium, or low for each of the specific data quality features. Reviewers also had the opportunity to provide comments for each study based on external validity (generalizability)
Category Bias and generic data quality features Specific data quality features Validity Design of assessed study
1 Selection bias: study design Design (i.e., well-controlled) High BACI
Medium BA or CI
Replication High Replication at level of intervention (n > 5)
Medium Replication at level of intervention (true n = 1 with pseudoreplication) or n = 2–5 Low Unreplicated (i.e. no variance, or variance
across years only)
Control matching High Control and treatment samples
well-matched or likely well-well-matched at baseline
Medium Control and treatment samples moder-ately matched
Low Control and treatment samples poorly matched
2 Assessment bias: measurement of
outcome Measured outcome HighMedium Quantitative approximations or semi-Quantitative
quantitative
Low Qualitative
3 Performance bias: baseline comparison Other confounding environmental
factors High Intervention and comparator sites homog-enous
Medium Intervention and comparator sites moderately comparable with respect to confounding factors
Low Intervention and comparator sites hardly comparable with respect to confound-ing factors or lackconfound-ing sufficient informa-tion to judge
N/A if BA design and before measurement taken immediately prior to restoration
Table 2 Terms related to study design and their definitions used throughout the systematic review
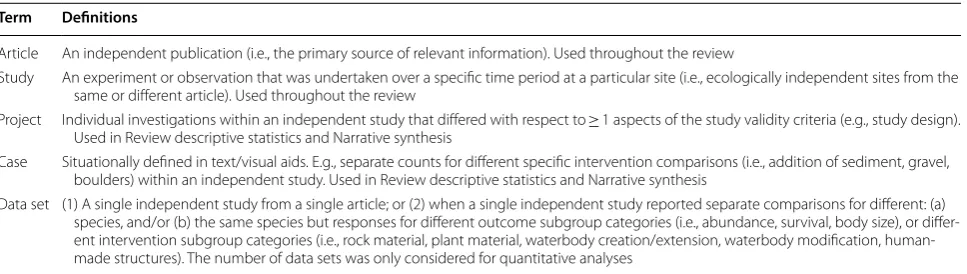
Term Definitions
Article An independent publication (i.e., the primary source of relevant information). Used throughout the review
Study An experiment or observation that was undertaken over a specific time period at a particular site (i.e., ecologically independent sites from the same or different article). Used throughout the review
Project Individual investigations within an independent study that differed with respect to ≥ 1 aspects of the study validity criteria (e.g., study design). Used in Review descriptive statistics and Narrative synthesis
Case Situationally defined in text/visual aids. E.g., separate counts for different specific intervention comparisons (i.e., addition of sediment, gravel, boulders) within an independent study. Used in Review descriptive statistics and Narrative synthesis
After input from the Advisory Team, a sample size of n > 5 true replicates was deemed ‘high’ validity, while n = 2–5 was considered ‘medium’ and more feasible in the real world, and unreplicated was considered ‘low’ validity. Studies that provided only a count/number with no variance or presented a mean and variance across years and did not have replication within a year were considered unreplicated. See “Data-extraction considerations” below for details on pseudoreplication. The criteria in our critical appraisal framework refer directly to internal validity (methodological qual-ity), whereas external validity (study generalizability) was captured during screening or otherwise noted as a comment in the critical appraisal tool. The inter-nal validity criteria included: study design (BA, CI, or BACI), replication (true or pseudoreplication), con-trol matching [how well matched the intervention and comparator sites were at site selection and/or study initiation (e.g., physical characteristics)], meas-ured outcome [quantitative, quantitative approxima-tion (e.g., catch per unit effort, populaapproxima-tion estimates), semi-quantitative (e.g., absence before intervention and abundance data after intervention), or qualitative], and confounding factors [environmental or other fac-tors that differ between intervention and comparator sites and/or times, that occur after site selection and/ or study initiation (e.g., flood, drought, unplanned human alteration)]. Each criterion was scored as ‘high’ (low risk of bias), ‘medium’ (medium risk of bias), or ‘low’ (high risk of bias) based on the predefined frame-work outlined in Table 1. A study was given an overall ‘low’ validity if it scored low for one or more of the cri-teria. If the study did not score at least one low or all high for any of the criteria, it was assigned an overall ‘medium’ validity. Studies that scored only high for all of the criteria were assigned an overall ‘high’ validity. This approach assumes that equal weight was given to each criterion, which was carefully considered during the development of the predefined framework.
In most cases, study quality assessment and data extraction were performed simultaneously and by the same reviewer (JJT). If there was any uncertainty, another reviewer (TR) was brought into discuss and a consensus decision made. Initially, however, a con-sistency check was undertaken on 6/64 articles (9.4%) by JJT and TR. Meta-data and quality assessments on these studies were extracted by both reviewers, discrepancies were discussed and, when necessary, refinements to the meta-data extraction and quality assessment sheets were made to improve clarity on coding. Reviewers did not critically appraise studies for which they were an author.
Data coding and extraction strategy General data‑extraction strategy
Following full-text assessment, all included articles underwent meta-data extraction, regardless of their study validity category. Data extraction used a review-specific data-extraction form (Additional file 3). Extracted information followed the general structure of our PICO framework (Population, Intervention, Comparator, Outcome) and included characteristics such as: publication details, study location, study sum-mary and timeline, population details, intervention and comparator details, and outcome variables. Abundance (including density, CPUE, and biomass), survival, and body size were treated as continuous outcome vari-ables. Measures of abundance were used to address questions of broad differences in abundance, whereas survival and body size allowed understanding of the success and productivity of fisheries. For further syn-theses, waterbody type was assessed as either (1) lotic (i.e., including: rivers, creeks, and sounds), or (2) len-tic (including: lakes, wetlands, and reservoirs). During data extraction, redundant articles (i.e., articles that reported data that could also be found elsewhere or contained portions of information that could be used in combination with another more complete source) were identified and combined with the most comprehensive article (i.e., primary study source) (Additional file 4). Data on potential effect modifiers and other metadata were extracted from the primary study source or their supplementary articles.
In addition, all included articles underwent quantita-tive or qualitaquantita-tive data extraction. Sample sizes, out-come means (e.g., mean abundance of a fish species for the intervention and comparator groups) and measures of variability (e.g., standard deviation, standard error, confidence intervals of outcome means) were extracted if provided; data from figures were extracted using the data-extraction software WebPlotDigitizer [42] when necessary. If raw data, rather than means, were provided we calculated and recorded summary statistics ourselves. Where data or information were missing or unclear, we attempted to contact authors via email to retrieve the missing or unclear data.
Data‑extraction considerations
and assigned each study a separate “Site ID” (refer to Table 2 for term definitions).
A single independent study could also report separate relevant comparisons for: (1) different species, and/or (2) the same species but for different responses (i.e., abun-dance, survival, body size), or different interventions (i.e., rock material, plant material, waterbody creation/exten-sion, waterbody modification, human-made structures). For quantitative synthesis, we treated these comparisons separately (i.e., separate rows in the database that share the same Site ID).
Replication within a study (i.e., group sample sizes) was considered at two levels: (1) independent interven-tion areas (i.e., separate waterbodies, or separate secinterven-tions of a waterbody receiving treatment—true replicates), and (2) partly subsampled data, hereafter referred to as pseudoreplicated samples (i.e., in the sense that reported variances did not refer to the variability of true replicate means from (1) above but to the variability of subsam-ples within/across true replicates). For the former, we recorded the number of independent intervention areas as the level of true treatment replication. For the latter, we recorded the number of pseudoreplicated samples occurring, for example, at the plot or nest levels within an area (i.e., non-independent replicates). In cases of pseudoreplicated data (or presumed pseudoreplicated
data), we made appropriate adjustments in the quantita-tive synthesis (see “Adjustment accounting for pseudor-eplication”—Additional file 5).
Data‑extraction consistency checking
As described above (see “Study validity assessment”) in most cases, data extraction took place at the same time as the study quality assessment and by the same reviewer (JJT) after a consistency check was performed on a sub-set of the articles. Reviewers did not extract data from a study on which they were an author.
Potential effect modifiers and reasons for heterogeneity
For all 70 articles included on the basis of full-text assessment, the following data describing key sources of potential heterogeneity were extracted when avail-able: waterbody type (e.g., creek, river, reservoir, or lake), fish taxa (at the family level), intervention type (i.e., rock material, plant material, waterbody creation, human-made structures, waterbody modifications, and any combination of these interventions; see Table 3 for intervention types and definitions), life stage [i.e., egg: nests, redds, or eggs (zygote or developing embryo); age-0: alevin, fry, YOY: adult spawners], and time since intervention. We consulted both the Advisory Team and similar published analyses [17] when selecting potential
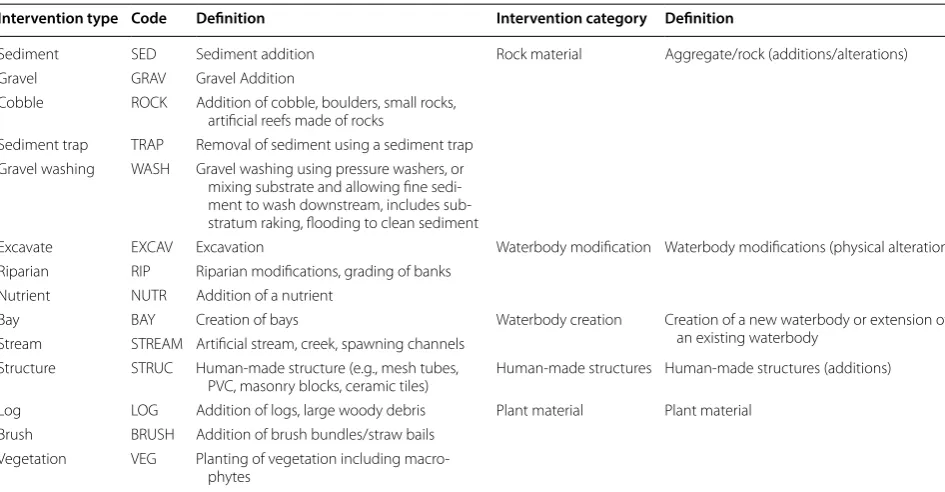
Table 3 Intervention types assessed in this review along with definitions and codes
Intervention types were assigned based on intervention details provided by authors. Intervention categories were assigned to combinations of one or more similar intervention types (i.e., Intervention type) and used in the Narrative and Quantitative Syntheses (i.e., to increase sample sizes of intervention type categories for meta-analyses). Intervention codes were used in forest plots for meta-analyses (i.e., visualize aids that plot mean effect sizes and 95% confidence intervals from individual comparisons)
Intervention type Code Definition Intervention category Definition
Sediment SED Sediment addition Rock material Aggregate/rock (additions/alterations)
Gravel GRAV Gravel Addition
Cobble ROCK Addition of cobble, boulders, small rocks,
artificial reefs made of rocks
Sediment trap TRAP Removal of sediment using a sediment trap Gravel washing WASH Gravel washing using pressure washers, or
mixing substrate and allowing fine sedi-ment to wash downstream, includes sub-stratum raking, flooding to clean sediment
Excavate EXCAV Excavation Waterbody modification Waterbody modifications (physical alterations)
Riparian RIP Riparian modifications, grading of banks
Nutrient NUTR Addition of a nutrient
Bay BAY Creation of bays Waterbody creation Creation of a new waterbody or extension of
an existing waterbody Stream STREAM Artificial stream, creek, spawning channels
Structure STRUC Human-made structure (e.g., mesh tubes,
PVC, masonry blocks, ceramic tiles) Human-made structures Human-made structures (additions)
Log LOG Addition of logs, large woody debris Plant material Plant material
Brush BRUSH Addition of brush bundles/straw bails
effect modifiers. After consultation with the Advisory Team, there were effect modifiers that were originally identified in our protocol that were removed from data extraction for this review. Due to limitations in time and resources, we did not search external to the article for geographic coordinates, climate region, substrate type, and spawning strategy as they were deemed to not be key sources of potential heterogeneity and/or were rarely reported within the primary articles. When data were sufficient and sample size allowed, these potential modi-fiers were used in meta-analyses (see “Meta-analyses” section below) to account for differences among data sets via meta-regression (see Table 2 for definitions of terms such as data set).
Data synthesis and presentation
Descriptive statistics and a narrative synthesis
Following full-text assessments, we included all relevant studies in an MS-Excel database (Additional file 3). Meta-data on each study were used to generate descriptive sta-tistics and a narrative synthesis of the evidence, including figures and tables.
Meta‑analyses
Eligibility for meta‑analysis Despite inclusion in the database, some studies were considered unsuitable for meta-analysis (and were not included in the quantita-tive synthesis). These were studies that: (1) were critically appraised as having low study validity (see Table 1); (2) did not report measures of outcome variability and/or data on sample sizes and these data could not be otherwise calcu-lated; and (3) averaged across sampling years, the most recent Before and/or After years could not be isolated (i.e., not comparable with other studies).
Initial data preparation Prior to quantitative synthe-sis, BACI outcomes were converted to CI by subtract-ing data sampled before the intervention (B) from those sampled after the intervention (A) for each C and I site [i.e., C: (A-B) and I: (A-B); then means and variances were obtained by averaging across sites within each group] (see calculations in Additional file 6). Measures of variability were converted to standard deviations, if not reported as such (e.g., standard errors or confidence intervals).
Effect size calculation Because outcomes (e.g., abun-dance, CPUE, density, survival, body size) were not always reported in comparable units, we used the standardized mean difference (Hedges’ g) as our effect size measure instead of raw mean differences. Hedges’ g was calculated using the following steps [43], as shown below. Beginning with Cohen’s d, the standardized mean difference was used to account for differences in the scale of
measure-ment across studies by dividing the mean difference in each study (i.e., the difference between the mean response to an intervention and the mean response to no interven-tion) divided by that study’s pooled standard deviation:
where X¯
G1 and X¯G2 were the means of group 1
(G1 = comparator group) and group 2 (G2 = intervention group). Spooled was the pooled standard deviation of the two groups:
where S= standard deviation, and nG1 and nG2 were the sample sizes of group 1 and group 2. The variance for d is given by:
To convert from Cohen’s d to Hedges’ g, we used a cor-rection factor that removes small sample size bias:
Then Hedges’ g and associated variance (Vg) were cal-culated as:
Thus, a positive Hedges’ g indicates that the response outcome (abundance, survival, or body size) was higher/ longer in the created or enhanced spawning habitat areas than in areas with no intervention.
Quantitative synthesis All meta-analyses were con-ducted in R 3.4.3 [44] using the rma.mv function in the metafor package [45].
To determine whether habitat creation or enhance-ment measures improve, on average, substrate spawning fish responses compared to controls, we first conducted random-effects meta-analyses using restricted maxi-mum-likelihood (REML) to compute weighted summary effect sizes for each outcome separately (i.e., abundance, survival, and body size). To further account for multi-ple study comparisons within a study site and species outcomes being reported from the same site (see “Com-bining data across outcomes or multiple comparisons within a study” in Additional file 5 for full adjustment (1)
d= ¯
XG2− ¯XG1
Spooled
(2)
Spooled=
(nG2−1)S2G2+(nG1−1)SG21
nG1+nG2−2
(3)
Vd =
nG1+nG2
nG1nG2
+ d
2
2(nG1+nG2)
(4)
J=
1− 3
4(nG1+nG2−2)−1
(5) Hedges′g =J×d
summary), Site ID was included as a random factor in each model. The summary effect size was considered to be significantly different from zero (i.e. there was a sig-nificant either positive or negative effect of intervention) when the 95% confidence intervals (CI) did not overlap zero. Heterogeneity in effects was calculated using the Q statistic, which was compared against the χ2 distribution, to test whether the total variation in observed effect sizes (QT) was significantly greater than that expected from sampling error (QE) [46]. A statistically significant Q indi-cates greater heterogeneity in effect sizes (i.e., individual effect sizes do not estimate a common population mean), suggesting there are differences among effect sizes that have some cause other than sampling error. We also produced forest plots to visualize mean effect sizes and 95% confidence intervals from individual comparisons. The purpose of these summary effect sizes was to iden-tify general trends in the evidence base. It is important to note, that a lack of significance does not indicate no significant patterns within the evidence base. Further-more, a lack of significance can only be interpreted as a lack of evidence for an effect if there is no indication of heterogeneity. Additionally, if a significant pattern is detected within the evidence base, interpretation of sum-mary effects should include some consideration for con-text. For example, if a significant positive summary effect of habitat creation or enhancement on fish abundance is detected, it should not necessarily be interpreted as evi-dence that any habitat creation or enhancement measure designed for substrate spawning fish will improve fish abundance.
Given that Hedges’ g may not be easily interpretable, we attempted to convert g to a weighted-mean percent change in intervention effectiveness by plotting the rela-tionship between g and the percent change in interven-tion effectiveness:
where X¯
G1 and X¯G2 were the means of group 1
(G1 = comparator group) and group 2 (G2 = interven-tion group). Since percent change cannot be computed when X¯
G1= 0, we added a small constant q = 0.01 to ¯
XG1 for each data set. Also, because the calculation for percent change has no upper or lower bound, it can be excessively large when the comparator mean is small; to address this, we trim these extreme values by bounding the percent change to ± 100. For all analyses, we accom-pany weighted-mean effect sizes with weighted-mean percent changes and 95% confidence intervals from individual comparisons (see Additional file 6). It should be noted that while this metric provides an indication (7)
¯ XG2−
¯
XG1+q
¯ XG1+q
∗100,
of the relative proportional change in the intervention effectiveness, it is unclear, in a broad sense, how closely related this metric is to Hedges’ g. As such, this metric should only be used to aid with interpretation of effect size estimates.
Despite our effort to reduce publication bias by includ-ing data available in grey literature, the results could still be flawed if there was a bias towards publishing only positive or statistically significant results. Therefore, we examined the robustness of our models by testing for publication biases in two ways. First, we used visual assessments of funnel plots (i.e., scatter plots of the effect sizes of the included studies versus a measure of their precision e.g., sample size, standard error, or sampling variance) [47]. If no bias is present, the funnel plot should be funnel-shaped, with a wider spread of effect sizes for less precise (smaller) studies and decreasing spread as study precision increases (larger studies). We produced funnel plots using 1/square root of sample size, since standard errors have been shown to be inappropriate for funnel plots of standardized effect sizes [48]. In these plots, as study sample size increases (1/sqrt(k) decreases) we should expect the variance in the effect size to decrease if no bias is present. Second, in an attempt to judge the robustness of results against publication bias, the fail-safe numbers were calculated using the method as described by Rosenberg [49] specified with the fsn function in the metafor R package [45]. A fail-safe num-ber estimates the numnum-ber of non-significant unpublished studies required to eliminate a significant (weighted) overall effect size [49, 50]. The fail-safe number is often considered robust if it is greater than 5k + 10, where k is the number of effect sizes in the analysis (see [51]).
in any model such that the ratio k/j, where k is the num-ber of effect sizes, was greater than 5, which is sufficient in principle to ensure reasonable model stability and suf-ficient precision of coefsuf-ficients [52]. The small number of effect sizes did not permit the construction of mod-els with multiple variables, therefore weighted simple mixed-effects models were used throughout analyses.
We only performed analyses of categorical modera-tors where there were sufficient combinable data sets (i.e., > 2 data sets from ≥ 2 independent studies) for each moderator category. Thus, in some cases, we either com-bined similar categories to increase the sample size (see Table 3 Intervention Categories and detailed in “Results” below) or deleted the categories that did not meet the sample size criteria. For example, the intervention cat-egory ‘Rock material’ included the addition or alteration of gravel, cobble, or sediment.
For all data analyses, total heterogeneity, QT, was par-titioned into heterogeneity explained by the model, QM, and heterogeneity not explained by the model, QE (i.e.
QT=QM+QE). The statistical significance of QM and QE were tested against a χ2 distribution. Due to skewness of the data, time since intervention (continuous moderator) was log-transformed before analysis.
Results
Review descriptive statistics Literature searches and screening
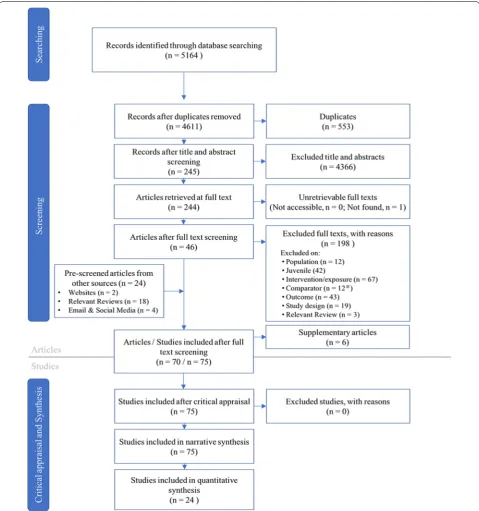
A search of 5 databases and Google Scholar returned 5164 individual records (see Additional file 1), which resulted in 4611 articles after duplicate removal. Of those remaining articles, 4363 were removed after screening at title and abstract, leaving 244 potentially relevant articles. We were able to obtain all but one full text (see Addi-tional file 3), leaving 243 articles to screen at full-text. The majority of articles were excluded at full text because of an irrelevant intervention (i.e., not creation/enhance-ment of a spawning habitat), population (i.e., study reported data for fish > age-0 or temperate or non-substrate spawning fish), or outcome (i.e., irrelevant out-comes or lack of results). All articles excluded at full text along with reasons for their exclusion can be found in Additional file 2. From the databases and Google Scholar, 46 articles were included at full-text.
Searching the bibliographies of articles identified as relevant at either title and abstract or full-text review stage resulted in an additional 17 articles included at full-text. Website searches and grey literature solici-tation provided an additional five articles included at full text. A total of 70 articles were deemed relevant at full-text, six of which were considered supplemen-tal (redundant) articles because they overlapped with other included articles providing only additional
information (e.g., extra years of data, intervention information). A total of 75 studies from 64 articles (see definitions in Table 2) were included in this system-atic review and underwent data extraction and critical appraisal (Fig. 1).
Study validity assessment
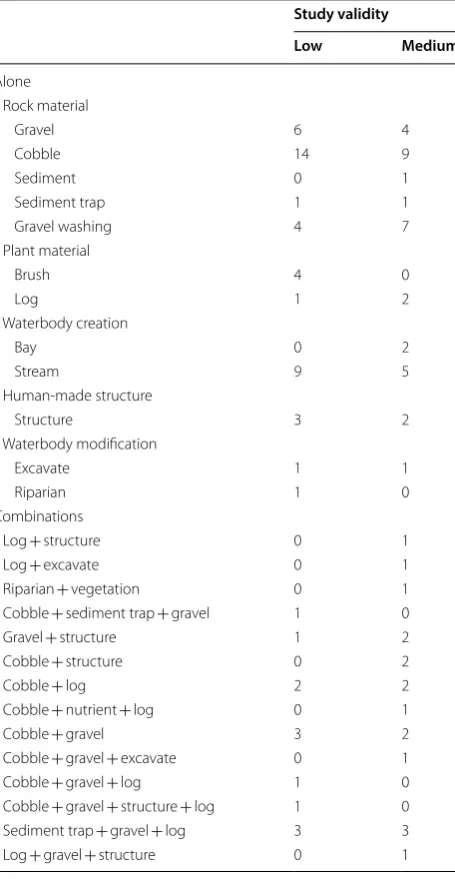
The majority of projects (60.0%) were assigned an over-all ‘low’ study validity, whereas 40.0% were assigned an overall ‘medium’ validity, and 0 studies were of overall ‘high’ validity. BA or CI study designs were used in 86.3% of projects, which resulted in a medium study validity for the study design category (see Table 4). Of the 14 projects that used a BACI study design, none had high replica-tion at the level of the intervenreplica-tion (n > 5), which led to no studies with high validity in this category. Among the projects that received an overall low study validity, most (84.2%) lacked replication. This included projects that provided: (1) only a number or count, with no mean or variance; (2) a mean and variance across years; or (3) a mean with no variance and no raw data. The majority of the BACI study designs were either pseudoreplicated or unreplicated, and only two projects had 2–4 replicates. Most projects scored high validity (low risk of bias) in the categories of control matching, measured outcome, intervention, and confounding factors.
Publication year
Included articles were published from 1962 to 2016, with the number of publications increasing over time. From 1962 to 1990, grey literature made up a larger propor-tion of the total articles than in more recent years (Fig. 2). Critical appraisal of all studies indicated that study valid-ity tended to improve over time (Fig. 3), with medium validity studies making up 56%, 49%, and 65% of stud-ies in each of the last three decades (1991–2016) com-pared to 29%, 29%, and 0% in the previous three decades (1961–1990).
Narrative synthesis
The narrative synthesis was based on all 75 studies from 64 articles, regardless of study validity. A database of these studies with descriptive meta-data, coding and quantitative data is available in Additional file 3.
Study location
in Denmark. Most interventions were applied in creeks or rivers (80% of studies), with a few in lakes/ponds (9.3%), reservoirs (9.3%) or in a sound (1.3%).
Study design
A Control/Impact (CI) design was used in 42 of the included studies (Table 4). These studies were more likely to include true replication, which often took the form of multiple control/impact streams or study sites. A Before/ After/Control/Impact (BACI) design was used in 13 of the studies (Table 4), and included a minimum of 1 year of before and after data and 1 control and 1 impact site.
The number of studies listed above exceeds the total number of studies because some studies included more than one project. A number of studies (19) were excluded from this review at full-text screening based on lack of comparator (‘post-treatment’ design). These studies often described a habitat creation or enhancement with moni-toring data, but no data from before the intervention or at a control site.
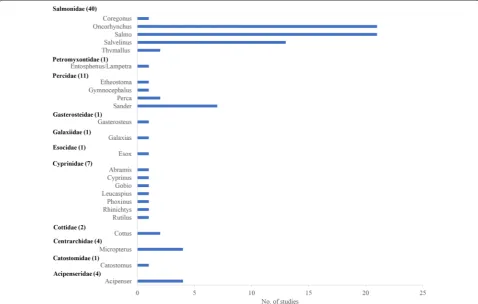
Population
Included studies investigated the effect of spawning habitat creation or enhancement on 40 species from 25 genera and 11 families (Fig. 5). Salmonidae were the most common family studied (63.7% of studies) includ-ing Coregonus (1 study), Oncorhynchus (21), Salmo (21), Salvelinus (13), and Thymallus (2). Four studies grouped several species across genera or families and were there-fore not included in Fig. 5. The most frequently stud-ied species were brown trout (Salmo trutta; 16 studies), brook trout (Salvelinus fontinalis; 9), walleye (Sander vitreum; 7), coho salmon (Oncorhynchus kisutch) and chinook salmon with 5 studies each, and chum salmon (Oncorhynchus keta), rainbow trout (Oncorhynchus mykiss), sockeye salmon (Oncorhynchus nerka), and lake trout (Salvelinus namaycush) with 4 studies each.
Interventions
The majority of studies applied only one intervention type to create or enhance spawning habitat for substrate-spawning fish (72.9% of cases, Table 5). In the remaining studies (29), an intervention was applied in combination with one or more different interventions. The number of cases exceeds the number of studies, because a study was considered to contain multiple cases if it investigated the effect of different interventions within a study, or if differ-ent critical appraisal scores were assigned to an interven-tion based on experimental design.
Table 4 Results of study validity assessment using the critical appraisal tool (see Table 1)
Numbers indicates the number of projects that received the critical appraisal score for each criterion
High Medium Low
Study design BACI 13 BA or CI 82 N/A –
Replication at level
of intervention n > 5 5 n = 1–4 42 Unreplicated 48
Control matching Well matched at site selection/study
initiation 80 Moderately matched at site selec-tion/study initiation 9 Poorly matched at site selection/study initiation 6
Measured outcome Quantitative 79 Semi-quantitative or quantitative
approximation 13 Qualitative 3
Confounding factors Intervention and comparator sites
are homogenous during study 74 Intervention and comparator sites moderately comparable with respect to confounding factors during study
10 Intervention and comparator sites hardly comparable with respect to confounding factors during study or lacking information to judge
11
Fig. 2 Year of publication of the 64 articles in relation to source
Manipulation of rock material (see Table 3 for exam-ples and definitions) was the most common intervention used across studies that involved the application of only one intervention (43.9% of cases, Table 5). Gravel (e.g.,
addition of spawning beds) and cobble (e.g., rock piles or artificial reefs) were the most common interventions applied, followed by gravel washing (e.g., pressure wash-ing). Very few studies tested the removal of sediment through the installation of a sediment trap or the addition of sediment. Waterbody creation was used alone as an intervention in 15.0% of cases, including the creation of a bay or an artificial stream. The addition of plant mate-rial was less frequently applied as an individual interven-tion (e.g., brush, logs; 6.5% of cases), as was the addiinterven-tion of human-made structures (e.g., masonry blocks, ceramic tiles; 4.7% of cases), and waterbody modifications (e.g., grading of banks; 2.8% of cases).
In 27.1% of all cases, an intervention was applied in combination with one or more different interventions (Table 5). Of those cases, a combination of 2 interven-tions (e.g., cobble and gravel, log and human-made structure) was used in 17 cases. A combination of 3 inter-ventions was used in 11 cases (e.g., cobble, gravel, and log), and only 1 case described a combination of 4 inter-ventions (e.g., cobble, gravel, human-made structure, and log). Full definitions of intervention categories can be found in Table 3.
Fig. 4 Number of included studies and articles per country
Studies involving Salmonidae, Percidae, Acipenseri-dae, and Catostomidae most often applied the manip-ulation of rock material alone as an intervention to enhance spawning habitat (24, 6, 3, 1 studies respec-tively; Fig. 6). Studies involving Petromyzontidae, Gal-axiidae, Cottidae, and Centrarchidae most often applied the addition of plant material alone (one, one, one, and two studies respectively). Studies involving Gaster-osteidae and Esocidae (one study each) used a water-body creation as an intervention, while for Cyprinidae (two studies) a combination of interventions was used to enhance spawning habitat.
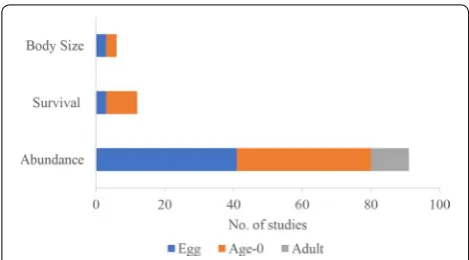
Measured outcomes
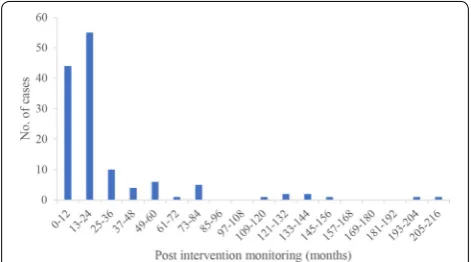
The vast majority of studies reported a metric of abun-dance (including abunabun-dance, density, CPUE, and bio-mass; 91 studies) as an outcome, whereas 12 studies reported a survival metric, and 6 studies reported body size metrics (Fig. 7). The studies focused mostly on early life-stage outcomes as opposed to spawning adults. Stud-ies reporting egg data (including nests/redds, zygote or developing embryo, and larvae) and age-0 data (including alevin, fry, YOY) were in almost equal proportion (47 and 51 studies, respectively). Spawning adults were reported in 11 studies, all of which reported abundance metrics. Most studies (63) reported outcomes as quantitative data, whereas 12 studies reported a quantitative approximation (e.g., CPUE, population estimates), 5 studies reported semi-quantitative data (e.g., presence before interven-tion and quantitative values after interveninterven-tion), and 2 studies reported only qualitative outcomes. Nearly equal numbers of studies did (38 studies) or did not (41 stud-ies) present intermediate time points of data (i.e., more than just one after year). Most often, studies reported data collected 1 or 2 years post-intervention (44 and 55 cases, respectively). Very few studies reported long-term monitoring (Fig. 8), with cases containing data from over 8 years (96 months) post-treatment stemming from only two articles [54, 55]. Studies that did not provide dates were not included in Fig. 8.
Quantitative synthesis Description of the data
Of the 75 studies (from 64 articles) included in the nar-rative synthesis, 22 studies (from 20 articles) with 53 data sets were included in the quantitative synthesis. We excluded studies for the following reasons: (1) ies were evaluated as having low study validity (43 stud-ies); (2) measures of outcome variability and/or data on sample sizes were not reported or could not be cal-culated (7 studies); (3) data were averaged across sam-pling years, not allowing the most recent before and/or after years to be isolated (1 study) (see details of these studies in Additional file 6). Additionally, we excluded 2 further studies because of differences in the compara-tors used which resulted in different interpretation of effect size estimates (i.e., they were not comparable to other effect sizes). For both BA study designs, and CI designs that compared control and impact sites from the same stream (i.e., impact sites were sites within the same stream where the intervention was applied but oth-erwise, control and impact sites were similar), based on the Hedges’ g, we would expect a positive estimate if the outcome (abundance, survival, or body size) was higher/ longer in the created or enhanced spawning habitat areas (or the after intervention time period) than in areas with Table 5 Number of cases with low or medium study
validity for each intervention type either alone or in combination
Study validity
Low Medium
Alone Rock material
Gravel 6 4
Cobble 14 9
Sediment 0 1
Sediment trap 1 1
Gravel washing 4 7
Plant material
Brush 4 0
Log 1 2
Waterbody creation
Bay 0 2
Stream 9 5
Human-made structure
Structure 3 2
Waterbody modification
Excavate 1 1
Riparian 1 0
Combinations
Log + structure 0 1
Log + excavate 0 1
Riparian + vegetation 0 1
Cobble + sediment trap + gravel 1 0
Gravel + structure 1 2
Cobble + structure 0 2
Cobble + log 2 2
Cobble + nutrient + log 0 1
Cobble + gravel 3 2
Cobble + gravel + excavate 0 1
Cobble + gravel + log 1 0
Cobble + gravel + structure + log 1 0
Sediment trap + gravel + log 3 3
no intervention (or the before intervention time period). However, for CI designs that compared impact sites that were degraded and to which an intervention was applied
with control sites that represented a more natural con-dition, based on Hedges’ g, we would expect: (1) a posi-tive effect size (i.e., g > 0) if the intervention resulted in a larger improvement than the control (natural condition), or (2) a neutral effect size (i.e., g= 0) if the outcome at the impact sites was similar to the outcome at the con-trol sites. Because comparator types were not compara-ble across all study designs, and since there were too few effect sizes to subgroup comparator types, we excluded these two studies from further analyses (i.e., [56, 57]). All 22 studies included in the quantitative synthesis were assessed as having ‘Medium’ study validity.
Data sets included in the quantitative synthesis were predominantly from North America (Canada, 13; USA, 17), followed by some from Europe (22), and single study from Asia. The majority of data sets were from studies conducted in lotic ecosystems (91% of data sets), includ-ing rivers (83%), creeks (4%), and sounds (4%), and a few data sets were from lentic systems (9%), including reservoirs (6%), and lakes (4%). Eighty-three percent Fig. 6 The number of studies per family in relation to the intervention type applied. Combination refers to any number of interventions applied simultaneously. The number of studies shown exceeds the total number of included studies because data for multiple families or intervention categories were often presented within a study
of the data sets used a CI study design, whereas 6% and 11% used a BA or BACI design, respectively (Additional file 6).
Among the 53 data sets extracted, 39 data sets in 17 studies reported species (90% of data sets) or group (i.e., species across genera or families; 10% of data sets) abundances (i.e., counts (15), CPUE (15), density (8), and biomass (1), see Additional file 6). Six data sets in 6 stud-ies reported specstud-ies survival, and 8 data sets in 4 studstud-ies reported species (88% of data sets) or group (12%) body size outcomes.
The majority of the data sets implemented a single intervention type (33/53 data sets). Of the data sets that implemented single interventions, most were evalua-tions of the effectiveness of the creation of a new water-body (i.e., stream) or extension of an existing waterwater-body (i.e., bay), and the addition or alteration of rock material
(including sediment, gravel, cobble, boulders, and/or gravel washing or substrate raking) (Table 6). The addi-tion of plant materials (i.e., logs) was used less frequently (Table 6; Additional file 6).
There were relatively fewer data sets that used a com-bination of intervention types to create or enhance spawning habitat (22/53 of data sets). The most common combination of intervention types included the addition of plant material (i.e., logs or vegetation) with: (1) physi-cal alteration to the waterbody (i.e., riparian modifica-tions or excavation), and (2) the addition of rock material (i.e., boulders/cobble) (Table 6; Additional file 6).
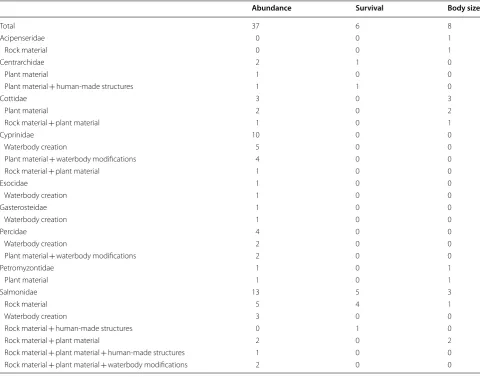
Among the 53 data sets, 26 fish species from 18 genera and 9 families were targeted for spawning habitat restora-tion (Table 7). The most commonly targeted species were from the Salmonidae family and included brown (6 data sets) and chinook salmon (3).
Data sets reporting outcomes using age-0 (fry to age-0) as the life stage made up the largest portion (68% of data sets), whereas eggs (including nests/redds, eggs and lar-vae) made up 30% of data sets. Only a single data set col-lected outcomes using adult spawners (along with redd counts) (Table 6; Additional file 6).
Information on the time since habitat creation or enhancement (time between the last intervention and the last outcome measure) was reported in 38/53 of the data sets. Most data sets were short-term evaluations of spawning habitat restoration, with 47% of the available data sets reporting restoration evaluations between 12 and 24 months after the last intervention was imple-mented, and 18% of data sets reporting evaluations less than 12 months after the most recent restoration meas-ure was applied. We found some data sets reporting Fig. 8 The number of cases in relation to the number of months
between the last intervention and the last reported sampling time. In this context, a study is made up of multiple cases if it includes more than one life stage or intervention per species
Table 6 Sample sizes (number of data sets) for the three different outcome metrics by life stage and interventions
Numbers in brackets indicate a data set that included > 1 life stage
Abundance Survival Length
Total Egg Age 0 Adult Total Egg Age 0 Adult Total Egg Age 0 Adult
Alone
Rock material 6 5 (1) 0 (1) 4 3 1 0 2 2 0 0
Plant material 4 2 2 0 0 0 0 0 3 1 2 0
Waterbody creation 14 2 12 0 0 0 0 0 0 0 0 0
Combinations
Rock material + human-made structures 0 0 0 0 1 1 0 0 0 0 0 0
Rock material + plant material 4 0 4 0 0 0 0 0 3 0 3 0
Rock material + plant material + human-made structures 1 0 1 0 0 0 0 0 0 0 0 0
Rock material + plant material + waterbody modifications 2 0 2 0 0 0 0 0 0 0 0 0
Plant material + human-made structures 1 1 0 0 1 1 0 0 0 0 0 0
Plant material + waterbody modifications 7 0 7 0 0 0 0 0 0 0 0 0
longer-term evaluations, with 26% of the available data sets reporting restoration evaluations between 33 and 74 months after the last intervention was implemented, and 8% of data sets reported data more than 74 months after the last intervention was applied (Additional file 6).
Global meta‑analyses
The overall mean weighted effect size for abundance was 0.54 (95% CI 0.32, 0.76; k = 39, p < 0.0001; Fig. 9), corre-sponding to a 60.4% (95% CI 47.51, 73.23) overall increase in substrate spawning fish abundance with spawning habitat creation or enhancement compared to controls. The majority of effect sizes were positive (i.e., g > 0; 31 Table 7 Sample sizes (number of data sets) for the three different outcomes by interventions
Abundance Survival Body size
Total 37 6 8
Acipenseridae 0 0 1
Rock material 0 0 1
Centrarchidae 2 1 0
Plant material 1 0 0
Plant material + human-made structures 1 1 0
Cottidae 3 0 3
Plant material 2 0 2
Rock material + plant material 1 0 1
Cyprinidae 10 0 0
Waterbody creation 5 0 0
Plant material + waterbody modifications 4 0 0
Rock material + plant material 1 0 0
Esocidae 1 0 0
Waterbody creation 1 0 0
Gasterosteidae 1 0 0
Waterbody creation 1 0 0
Percidae 4 0 0
Waterbody creation 2 0 0
Plant material + waterbody modifications 2 0 0
Petromyzontidae 1 0 1
Plant material 1 0 1
Salmonidae 13 5 3
Rock material 5 4 1
Waterbody creation 3 0 0
Rock material + human-made structures 0 1 0
Rock material + plant material 2 0 2
Rock material + plant material + human-made structures 1 0 0
Rock material + plant material + waterbody modifications 2 0 0
Fig. 9 Summary plot of all effect size estimates from evaluations of the effectiveness of spawning habitat creation or enhancement on fish abundance (k = 39) subgrouped by intervention categories. Intervention type code definitions can be found in Table 3. Error bars indicate 95% confidence intervals. A positive mean value (right of dashed zero line) indicates that the abundance was higher in treatment areas than in control areas (no intervention). Waterbody mods: waterbody modifications. Species Codes: BrkTrout: Salvelinus fontinalis; BrnTrout: Salmo trutta; Chinook: Oncorhynchus tshawytscha; Coho: Oncorhynchus kisutch; CmBream: Abramis brama; CmCarp: Cyprinus carpio; CmRoach: Rutilus rutilus; ERuffe: Gymnocephalus cernuu; EPerch: Perca fluviatilis; Gudgeon: Gobio gobio; LkTrout: Salvelinus namaycush; Lamprey: Entosphenus tridentatus and Lampetra spp.; LgBass: Micropterus salmoides; LnDace: Rhinichthys cataractae; Masu: Oncorhynchus masou; NPike: Esox lucius; PkSalmon: Oncorhynchus gorbuscha; RnTrout: Oncorhynchus mykiss; RtSculpin: Cottus perplexus; SlSculpin: Cottus cognatus; SmBass: Micropterus dolomieu; ShTrout: Oncorhynchus mykiss; Sunbleak: Leucaspius delinineatus; TsStick: Gasterosteus aculeatus; ToSculpin: Cottus rhotheus; various: various species; WhSturg: Acipenser transmontanus
of 39), with the remaining 20% showing neutral or nega-tive responses (i.e., g≤ 0) to spawning habitat creation or enhancement; however, most of the individual effect sizes were not statistically significant, having large confidence intervals that overlapped zero (35 out of 39 effect sizes) (Fig. 9). The Q test for heterogeneity suggested that there was no statistically significant heterogeneity between effect sizes (Q = 32.75, p =0.711). The funnel plot for the random effects model for abundance did not show an obvious pattern of publication bias; i.e., as study sam-ple size increased, the variance in effect sizes decreased (see Additional file 7: Fig. S1). Also, the fail-safe number (N = 237) was greater than 5k + 10 [(5 * 39 + 10) = 205], suggesting the results from the random effects model was robust against potential publication bias (i.e., a relatively large number of studies was suggested to be required to eliminate the significant overall effect size).
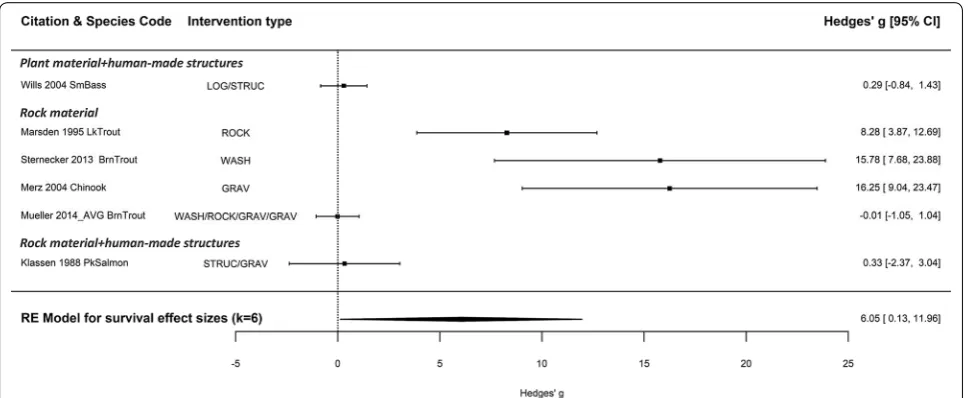
The overall mean weighted effect size suggests an overall increase in substrate spawning fish survival with spawning habitat creation or enhancement compared to controls [Hedge’s g= 6.05 (95% CI 0.13, 11.96), k = 6, p = 0.045; 26.41% (95% CI 0.84, 51.98); Fig. 10]. However, the sample size was quite small and three of the studies had very large positive effect sizes (lake trout [58], brown trout [59], and chinook salmon [10]), and as such may be having a disproportionately high impact on the mean effect size for improving survival (Fig. 10). The Q test for heterogeneity suggested that there was significant het-erogeneity between effect sizes (Q = 44.83, p < 0.0001), suggesting that there is significant heterogeneity that could be explored using mixed effects meta-analysis models; however, given the sample size, the influence of
moderators could not be assessed due to the potential of overparameterization. The funnel plot for the random effects model for survival did not show an obvious pattern of publication bias; however, with this small number of studies, it is difficult to determine asymmetry (Additional file 7: Fig. S2). Furthermore, the failsafe number (N = 0) was not greater than 5k * 10 [(5 * 6 + 10) = 40], suggest-ing the results from the random effects model may not be robust against potential publication bias.
The overall mean weighted effect size for body size was not statistically significant [Hedge’s g= 0.03 (95% CI
− 0.29, 0.36), k = 8, p = 0.84; 0.48% (95% CI − 3.27, 4.23); Fig. 11]. The result of the Q test also suggested that there was not significant heterogeneity in effect sizes between studies (Q = 4.60, p =0.709). This was also supported by visual assessment of the forest plot for this meta-analysis, in which there were no individual studies with significant effect sizes (Fig. 11). The funnel plot was non-informative for this low number of studies and the failsafe number was 0 (Additional file 7: Fig. S3).
Effects of moderators on abundance
The following section addresses our secondary research questions (Fig. 12). There were too few effect sizes within the survival and body size subsets to permit meaningful analyses for these questions; therefore, all analyses below use a subset of fish abundance responses. For all analyses, we present the main results and plots in this section and summarize all outputs in Fig. 12 and Table 8.
1(a). To what extent does spawning habitat creation or enhancement effectiveness differ among