R E S E A R C H A R T I C L E
Open Access
Performance of models for estimating
absolute risk difference in multicenter trials
with binary outcome
Claudia Pedroza
*and Van Thi Truong
Abstract
Background:Reporting of absolute risk difference (RD) is recommended for clinical and epidemiological prospective studies. In analyses of multicenter studies, adjustment for center is necessary when randomization is stratified by center or when there is large variation in patients outcomes across centers. While regression methods are used to estimate RD adjusted for baseline predictors and clustering, no formal evaluation of their performance has been previously conducted.
Methods:We performed a simulation study to evaluate 6 regression methods fitted under a generalized estimating equation framework: binomial identity, Poisson identity, Normal identity, log binomial, log Poisson, and logistic regression model. We compared the model estimates to unadjusted estimates. We varied the true response
function (identity or log), number of subjects per center, true risk difference, control outcome rate, effect of baseline predictor, and intracenter correlation. We compared the models in terms of convergence, absolute bias and coverage of 95 % confidence intervals for RD.
Results:The 6 models performed very similar to each other for the majority of scenarios. However, the log binomial model did not converge for a large portion of the scenarios including a baseline predictor. In scenarios with outcome rate close to the parameter boundary, the binomial and Poisson identity models had the best performance, but differences from other models were negligible. The unadjusted method introduced little bias to the RD estimates, but its coverage was larger than the nominal value in some scenarios with an identity response. Under the log response, coverage from the unadjusted method was well below the nominal value (<80%) for some scenarios.
Conclusions:We recommend the use of a binomial or Poisson GEE model with identity link to estimate RD for correlated binary outcome data. If these models fail to run, then either a logistic regression, log Poisson regression, or linear regression GEE model can be used.
Keywords:Clustered data, Correlated binary data, Generalized estimating equation, Multicenter trial, Risk difference, Robust standard errors
Abbreviations:CI: Confidence interval; GEE: Generalized estimating equation; ICC: Intracenter correlation coefficient; OR: Odds ratio; RCT: Randomized controlled trial; RD: Risk difference; RR: relative risk; SE: Standard error
© The Author(s) 2016Open Access This article is distributed under the terms of the Creative Commons Attribution 4.0 International License(http://creativecommons.org/licenses/by/4.0/), which permits unrestricted use, distribution, and reproduction in any medium, provided you give appropriate credit to the original author(s) and the source, provide a link to the Creative Commons license, and indicate if changes were made. The Creative Commons Public Domain Dedication waiver(http://creativecommons.org/publicdomain/zero/1.0/) applies to the data made available in this article, unless otherwise stated.
* Correspondence:[email protected]
Background
Arguments have been made for reporting meaningful treatment measures, such as absolute risk difference and relative risk (RR), in clinical and epidemiological pro-spective studies [1–4]. For clinicians considering the likely benefits of a treatment for individual patients, the most relevant measure of treatment effect is the absolute difference in benefit or harm from two treatment op-tions [5–7]. For binary outcomes, this corresponds to the absolute risk difference (RD) or its reciprocal, the number needed to treat [2, 5–7]. By combining the RR and the risk of the disease outcome, the number needed to treat tells us how much the treatment reduces or in-creases risk for an individual and hence the likelihood of benefit or harm for that individual [5, 8]. Compared to the RR, the RD is also better understood by clinicians and patients [9, 10]. For these reasons, the CONSORT statement recommends reporting of both RD and RR for all trials with binary outcomes [11].
In randomized clinical trials, estimates of RD can be obtained from analysis of a 2×2 table, but regression models are preferable when adjustment is needed for de-sign variables (e.g., stratifying variables) or for baseline covariates that are strong predictors of outcome (to gain efficiency) [12]. In multicenter trials, adjustment for ter is necessary when randomization is stratified by cen-ter or when there is large variation in patients outcomes across centers [13–15]. While the binomial model with identity link is the natural choice to obtain adjusted RD estimates, problems with convergence may limit its prac-tical application [16, 17]. For uncorrelated binary data, an average risk difference approach was proposed as a way to calculate RD from a multiple logistic regression, controlling for covariates in observational studies [18]. This approach was shown to perform better than models with identity link regarding bias, coverage and precision [19]. Yet, comprehensive model comparisons for RD computation in the context of clustered or correlated binary data (e.g., data from a multicenter or cluster trial) have not been conducted. In the present paper, we re-port results of a simulation study investigating perform-ance measures of six models for calculating RD with correlated binary data arising from a multicenter trial design. All models are fitted under a generalized estimat-ing equations (GEE) framework, since GEE models have been shown to perform well for estimating RR and odds ratios (ORs) with correlated data.
Methods
We consider a clinical trial study design involvingJ cen-ters where subjects are randomized to treatment or con-trol. We assume that outcomes from different centers are independent, but outcomes from the same center are correlated. Letting π(1) be the probability of the
outcome with treatment and π(0) the probability of the outcome with the control condition, the risk difference is defined as π(1)−π(0). We can estimate this quantity with the difference of the observed proportions, p^1−^p0, or with model-based estimates to adjust for baseline co-variates and clustering.
We examined six models that can be used to estimate the RD while accounting for intracenter correlation. To account for clustered data, we used GEE methods [20] to fit all models assuming an exchangeable correlation structure where subjects’outcomes from the same cen-ter have equal correlationρwith each other but are un-correlated with outcomes from subjects in other centers. Additionally, we used robust sandwich variance estima-tors with small sample correction to compute standard errors (SEs) for the estimated RD [20, 21]. Robust SEs are typically used with GEE methods to account for pos-sible misspecification of the covariance structure and distribution of the outcome (i.e., Poisson for binary outcomes).
Models
The models evaluated used either an identity link, a log link, or a logistic link to model the probability πijof the binary outcomeyij.
Identity link models
These models assume that
yij∼FðπijÞ
πij¼αþβxijþγzij ð1Þ
where yij is the binary outcome for subject i (i=1,2, …,nj) in centerj(j=1,2,…,J) with probabilityπij, and F (·) is either a binomial, Poisson, or Normal distribution; xij is a binary indicator for treatment and zij is a binary baseline covariate. The regression coefficient for the treatment variable, β, is the estimated RD between the treatment and control groups adjusting for the baseline covariate and accounting for intracenter correlation. The main disadvantage of these models is that the estimate ofπijmay be outside of the [0, 1] range (and may not be useful for estimating individual risks), and the binomial model may have convergence problems. However, a dir-ect estimate of the RD is obtained fromβ.
Log link models
Here we assume that
yij∼FðπijÞ
logðπijÞ ¼αþβxijþγzij; ð2Þ
typically used to estimate RRs since it tends to be more stable than the log binomial model and gives consistent estimates [16]. However, similar to the identity link models the estimate of πij resulting from the log link models may be larger than 1.
To estimate the average RD, we use Eq. 2 to estimate subject-specific probabilities of the outcome under the treatment and control conditions. We calculate the probability of the outcome if the subject is treated asπ^ijð 1Þ ¼expð^αþ^βxijþ^γzijÞ, and ^πijð0Þ ¼expð^αþγ^zijÞ if the subject does not receive treatment. We then estimate the average RD for the whole study population as
c RD¼1
n X
ij
ðπ^ijð1Þ−π^ijð0ÞÞ ð3Þ
wherenis the total sample size.
Logit link model
Here we use the logistic regression model assuming that
yij∼BernoulliðπijÞ
logitðπijÞ ¼αþβxijþγ zij: ð4Þ
The coefficient βis the log odds ratio. Similar to the log link models, we can use the logistic model4 to esti-mate the probability of the outcome for each subject under treatment or control condition. For a given sub-ject, the probability of the outcome with treatment is
^
πijð1Þ ¼ expð^αþ ^
βxijþγ^zijÞ
1þexpð^αþ^βxijþ^γzijÞ ð5Þ
and
^
πijð0Þ ¼ expð^αþ^γzijÞ
1þexpð^αþ^γzijÞ ð6Þ
with no treatment. The average RD is again estimated with Eq.3.
Standard errors of the RD
For models with identity link, the SE for the RD was ob-tained from the fitted model. For models with a log or logit link, standard errors of the RD were calculated using the delta method. A sampling correction factor of J/(J−p−1), whereJ is the number of centers andpis the number of variables in the model, was applied to robust SEs from all regression models to account for the small number of centers [21]. We used this corrected SE to compute Wald-type 95 % confidence intervals (CIs) for the RD:RDc1:96SEcorrectedðRDcÞ:
Simulation study
We assumed a multicenter randomized trial study design with 18 centers to assess performance of the models with a small number of centers (i.e., <50), which is com-mon in perinatal trials [22–24]. Randomization is strati-fied by center using blocks of size four with approximately equal number of subjects per center. We considered two sets of different simulation scenarios. The first set assumes a true identity link response func-tion as in (1), and the second set assumes a true log link function shown in (2). We include the log function to check the robustness of the models since we cannot know whether a real data set comes from an additive or multiplicative model. For both sets of scenarios, we var-ied the number of subjects per center (nj), the outcome rate in the control group (πc), intracenter correlation co-efficient (ICC), true RD, and the effect of the baseline covariate on the outcome.
Data generation with true identity link function
We simulated 1000 trial datasets for each combination of the parameters using the model with identity link function:
yij∼BernoulliðπijÞ
πij¼αþβxijþγzijþνj: ð7Þ
The treatment indicator xij was generated by randomization stratified by center, covariate zij from Bernoulli (0.3), and random center effectνjfrom Normal (0,σ2) to induce the center correlation. The number of subjects per center nj was 10, 50, or 100 (total sample sizes of 180, 900, or 1800) corresponding to small, medium, and large sample sizes. Outcome rate in the control group,α=πc, was 0.10, 0.25, or 0.50. Values ofβ= 0,0.05,0.10, and 0.15 corresponding to true RDs ranging from no effect to a large treatment effect were consid-ered. The covariate effectγwas 0.5αor 0 corresponding to a 50 % increased risk in the presence of the covariate (an effect strong enough such that it would be included in the design or analysis) or no effect (i.e., no baseline covariate). The ICCρwas set to 0.01, 0.05, or 0.10 which are values typically found in clinical cluster trials [25,
26]. We calculated the center variance as σ2¼ρ
π̄ð1−π̄Þ, where π̄¼αþ0:5βþ0:3γ is the average
probability of the outcome among the entire study popu-lation [27]. The values ofσ2ranged from 0.001 to 0.025. Whenever the simulated πij was outside the [0,1] inter-val, a new value of the random center effectνjwas sam-pled until 0<πij<1.
Data generation with true log link function
0.15) and control outcome rate πc (0.10, 0.25, 0.50) values as for the identity response simulation set. We generated 1000 datasets from the log link function model:
yij∼BernoulliðπijÞ
logðπijÞ ¼αþβxijþγzijþνj: ð8Þ
The xij’s were obtained from the randomization; zij’s, and νj’s were generated from a Bernoulli (0.3) and Nor-mal (0,σ2), respectively. ICC values of 0.01, 0.05, or 0.10 were again used forρ, andnj=10,50,100. For the log link function, we calculated the center variance based on a variance transformation approximation [27, 28] with σ2 ¼ρð1−π̄Þ=π̄ , where π̄¼expðαþ0:5βþ0:3γÞ . Values of σ2ranged from 0.006 to 0.90. To correspond with the values used in the identity response simulation set, the parameter values in model (8) wereα= log(0.1), log(0.25), log(0.5); γ= log(1.5), 0; and β=log(1+RD/ exp(α+0.3γ)). We again restricted the simulated πij to the [0,1] interval by generating a new value ofνj when-ever theπijfell outside this interval.
Using a fully factorial study design, we investigated a total of 432 simulation scenarios (2 response functions × 4 true RDs × 3 control outcome rates × 3 ICCs × 3 sam-ple sizes × 2 covariate effects). All the simulations and computations were performed in R 3.1.1 [29]. All models were implemented using the geese function in the R package geepack [30–32]. Unadjusted RD estimates (and CIs) were obtained using the epi.2by2 function from the epiR package [33]. We provide sample code in the Additional file 1 for calculating the RD and SEs from all GEE models for scenarios with covariate adjustment.
Performance measures
Under each simulation scenario, we analyzed each of the 1000 data sets with the six GEE models and the un-adjusted method (to evaluate the impact of ignoring the intracenter correlation): 1) binomial identity; 2) Poisson identity; 3) Normal identity; 4) log binomial; 5) log Pois-son; 6) logistic; 7) unadjusted 2×2 table analysis. We computed point estimates, SEs, and 95 % CIs for the RD. We evaluated and compared the different models based on convergence rate (model runs and converges), abso-lute bias, and coverage of the 95 % CI. Absoabso-lute bias was calculated as the average difference between the esti-mated RD and the true RD. The coverage of the 95 % CI is the proportion of simulations resulting in 95 % CIs for the RD that include the true RD. When computing bias and coverage for a model, we only included the datasets for which that specific model converged.
Results
Results for πc=0.10 and 0.25 with a baseline covariate are shown in Figs. 1, 2, 3, 4,5 and 6. Graphs of the re-sults for all other simulation scenarios are included in the Additional file1.
True identity link function
Scenarios without a baseline covariate
All models ran without errors. Absolute bias from all models is virtually the same with magnitude of ± 0.004 for nj=10 and even smaller for the larger sample sizes. Coverage of the 95 % CIs was within the 95 % nominal level (93.6–96.4 %) for the majority of scenarios and models. However for some scenarios with smaller values of ICC, small sample size, or large true RD, the coverage of all the GEE models was below 93.6 % (minimum coverage was 92 %). For the same scenarios the coverage of the unadjusted method tended to also be low (lowest coverage was also 92 %). Conversely, for some scenarios with the largest ICC of 0.10, the coverage of the un-adjusted RD estimates was larger than the nominal value indicating conservative CIs (maximum coverage was 97 %).
Scenarios with a baseline covariate
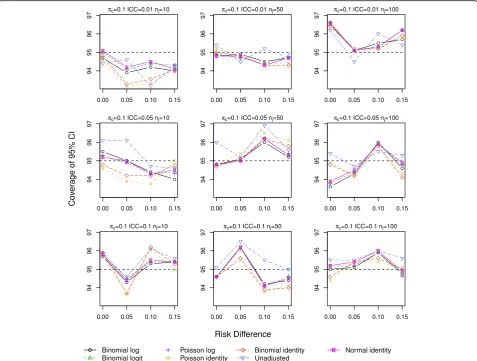
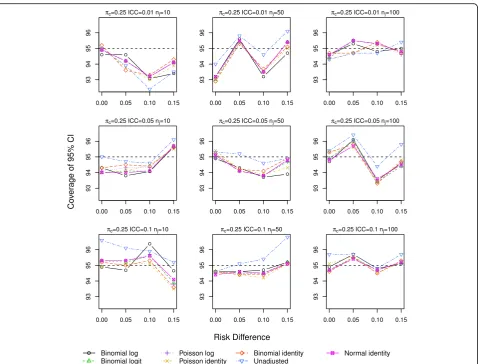
The log binomial model failed to converge for a large portion of the datasets for scenarios with πc=0.50 and hence we do not report results from this model for this control rate. Forπc=0.10,0.25, the log binomial, binomial identity, and Poisson identity models did not converge for small proportions of the datasets (<3 %,<3%,≤3%). The point estimates of RD from all the GEE models were very similar with very little bias, especially as the sample size increases (Additional file1: Figures S.7–S.9). The coverage of the 95 % CIs is very similar for all the GEE models, and all are close to the nominal level (Figs.
1 and2). Again for a few scenarios with the largest ICC (Fig.2), the coverage of the CI for the unadjusted RD es-timate is larger than the nominal value.
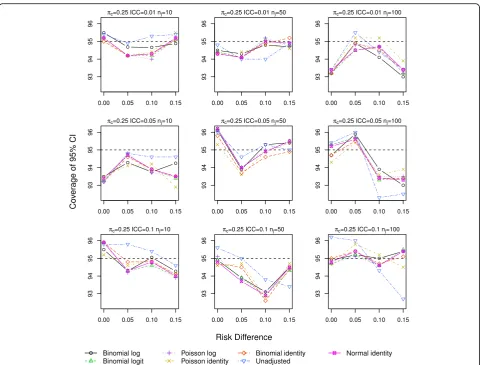
True log link function
Scenarios without a baseline covariate
of center variance (σ2>0.07) where the unadjusted model vastly underestimates the SE of the RD.
Scenarios with a baseline covariate
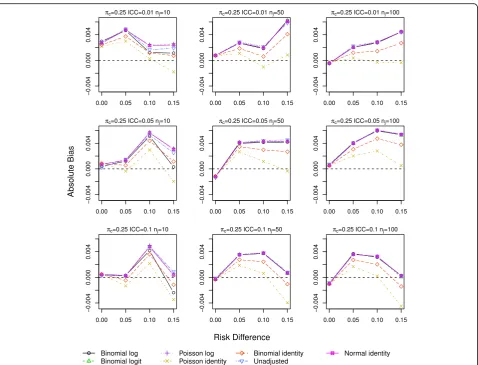
The log binomial model again failed to converge for a large portion of datasets for πc=0.50, and we again ex-clude it from the results. The identity Poisson and bino-mial models also failed to converge for scenarios with the smallest sample size (<3 and <4%, respectively). All other models ran without errors for all datasets. Bias from all models is very similar and increases as RD and ICC increase (Figs. 3 and 4). The smallest bias resulted from the Poisson identity model for scenarios with πc= 0.10,0.25 and from the binomial identity model when
πc=0.5 and ICC≥0.05, although differences between the models are small.
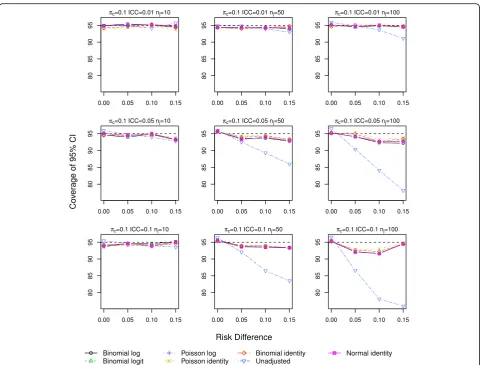
Coverage varied depending on the trueπc. For scenar-ios with πc=0.10, with the exception of the unadjusted method all other models resulted in similar coverage very close to the nominal value. The unadjusted method
had very poor coverage (≤90 %) when ICC >0.01 and nj≥50 (Fig. 5), which again correspond to scenarios with larger values ofσ2(>0.24). For scenarios withπc=0.25, all models had good coverage although the unadjusted method had lower coverage for ICC >0.01,nj=100 and RD=0.15 (σ2>0.10; Fig. 6). For πc=0.50, all models had low coverage (86–93 %) for RD = 0.15, ICC >0.05, and nj≥50(σ2>0.06; Additional file 1: Figure S.18). For these scenarios, the probability of the outcome in the treat-ment and covariate group is close to the parameter boundary of one. In these instances, the binomial iden-tity model had the coverage closest to nominal.
Applications
We present two examples to illustrate the similar per-formance of the GEE models in randomized studies with slightly different designs than those studied in the simu-lations. The first example is a cluster randomized trial, and the second is a multicenter trial with small number of centers.
Cluster trial example
The ASSIST trial assessed the effectiveness of three dif-ferent interventions for improving the secondary pre-ventive care of patients with coronary heart disease delivered at the level of general practice [34]. This study was a cluster trial where 21 general practices were ran-domized to the three interventions. The control group received audit of notes with summary feedback to pri-mary health care team. The intervention groups received assistance with setting up a disease register and system-atic recall of patients to either general practitioner or a nurse led clinic. The primary outcome was adequate as-sessment of 3 risk factors (blood pressure, cholesterol, and smoking status) at 18 months follow-up. We ana-lyzed the data presented by Thompson et al. [27] using all 6 GEE models and the unadjusted method. We grouped the 2 intervention groups together and com-pared them to control. The number of patients in each practice ranged from 25 to 222 and the observed pro-portion of the outcome ranged from 0.38−0.73 in
control practices and 0.54−0.95 in intervention ones. The point estimates and 95 % CI of the RD from all the regression models are identical (0.315, 95 % CI: 0.194, 0.436), and they are very similar to the Bayesian esti-mates reported by Thompson et al. (0.301, 95 % CI: 0.175, 0.435). The unadjusted method gives a lower esti-mate of the RD with a narrower CI (0.285, 95 % CI: 0.238, 0.331). However, the conclusions drawn from any of these estimates would most likely be the same.
Multicenter trial with small number of centers
from 273 subjects from the 8 study centers. Table 2
shows the estimated RD from the different methods. All 6 GEE models give almost identical RD estimates (0.125–0.127) and SEs as well as estimates of ICC. The 95 % CIs from the GEE models do not cross 0 and would be considered statistically significant. In compari-son, the unadjusted RD estimate is lower and not signifi-cant (0.094, 95 % CI:–0.20, 0.21) although the SE is the same as from the GEE models. This difference in RD es-timates from the GEE and unadjusted model is in part due to the large variability in the response rate across the 8 centers (and hence large ICC of 0.22), which is accounted for in the GEE models. As pointed out by a reviewer, this difference can be largely accounted for by the imbalance in the number of patients in each arm across the centers. When we exclude the center with the largest baseline difference (center 2 with 20 active vs 32 control patients), the estimated RDs are very close (0.133 from GEE models vs 0.129 from unadjusted model).
Discussion
In clinical and epidemiological studies with binary out-comes, it is preferable to report the RD or the number needed to treat since these effect measures are more eas-ily understood compared to relative risks or odds ratios [5–7]. For patients and clinicians alike, it is much easier to weigh the treatment benefits and risks using the abso-lute RD than using the RR [36]. For multicenter studies, it is important to adjust for possible center correlation when computing treatment effects, particularly when center variability is large or when randomization is stratified by center since unadjusted SEs will be too large and lead to diminished power and possibly erroneous conclusions [13–15]. While regression methods have been proposed to estimate RDs in cluster trials [27,37], no studies have been previously conducted to evaluate the performance of the most widely used methods, par-ticularly in multicenter studies with a small number of centers (<50).
In this paper, we evaluated the performance of six dif-ferent GEE models to estimate both unadjusted and covariate-adjusted RD while accounting for within-center correlation. We compared all models in terms of absolute bias and coverage under various simulation sce-narios. We also assessed the convergence rate for all the methods since non-convergence is a known issue for the binomial with log and identity links as well as for the Poisson with identity link [16, 38]. We assessed the ro-bustness of the methods to model misspecification by assuming a true log response function as well as an iden-tity response. For scenarios without a covariate under both response functions, all regression models converged and performed equally well regarding absolute bias and coverage of the 95 % CIs. The unadjusted method intro-duced little bias to the RD estimates, but its coverage was larger than the nominal value in some scenarios with an identity response. Under the log response, coverage from the unadjusted method was well below the nominal value (<80 %) for scenarios with larger
values of center variation where the unadjusted model underestimates the SE of the estimated risk difference. Even with the small sample correction factor, the CIs from the GEE models also had coverage lower than 95 % in some scenarios. Although the coverage obtained here is similar to that reported for estimating RRs [16, 39,
40], other variance adjustment methods to correct for the small number of clusters [21] or bootstrap estimates [41] may perform better. Alternatively, model-based SEs may be another option for GEE models [13].
For scenarios where a baseline predictor was included, the log binomial model did not converge for a large por-tion of the scenarios evaluated. This problem has been widely experienced and noted in both RCTs and obser-vational studies with either independent or clustered data [16,39,40]. The binomial and Poisson with identity models also failed to converge for some data sets (<4%) with small sample size.
analysts since the estimation of the RD is not straightfor-ward as it is for models with an identity link. Further-more, SEs are not directly obtained from the output and require extra steps to compute. We provide sample code in the Additional file1 using the delta method. The lin-ear regression model is not usually considered for binary data. However, for estimation of RD it appears to be a possible solution when paired with robust SEs. It has been previously evaluated for uncorrelated data with similar performance as the results shown here [38]. Given its ease of implementation in existing statistical software, consideration might be given to this method if a binomial or Poisson with identity link model fails to converge.
We focused on comparing GEE methods since they are often used for correlated or clustered data and have been shown to perform well for estimating RRs and ORs [13, 26, 37, 40, 42]. However, generalized linear mixed models or random effects models may also be used to analyze correlated data. Estimates derived from random
effects models are interpreted as center-specific as op-posed to population-averaged (or marginal) interpret-ation of GEE estimates. We note that under an identity link, the RD point estimates from GEE and random ef-fects models are the same [43,44]. However, it would be important to investigate differences in the SEs and evaluate the performance of random effect models with logit or log links for estimating RD for correlated binary outcomes.
Our results from the binomial with identity link GEE model are similar to those obtained in a study by Ukou-munne et al. [37] using the same model to analyze data from cluster trials. Given the good performance of GEE models for estimating RRs and ORs in CRTs [26,37,42,
45], we would expect the GEE models with identity link to perform well when estimating RD for cluster trial data, but it is unclear how the other links would perform in this setting.
center. However, for logit and log link GEE models others have noted similar performance when the number of centers and distribution of subjects within centers were varied [13, 39, 40, 45]. These models have also been shown to perform well with as few as 5 centers
[13]. We did not consider fixed effects models since for binary outcomes these methods require small number of centers (i.e., 2–3) otherwise the treatment effect estimate can be biased and the type I error rate inflated [13]. Treating center as a fixed effect can also lead to exclu-sion of patients in centers that do not have adequate number of patients or events [46].
Fig. 6Coverage of 95 % CIs for scenarios with true log link function including a baseline covariate for control outcome rateπc=0.25
Table 1Data from a multicenter trial comparing the efficacy of an active drug and control for curing an infection [35]
Response
Center Active No./Total (%) Control No./Total (%)
1 11/36 (31) 10/37 (27)
2 16/20 (80) 22/32 (69)
3 14/19 (74) 7/19 (37)
4 2/16 (13) 1/17 (6)
5 6/17 (35) 0/12 (0)
6 1/11 (9) 0/10 (0)
7 1/5 (20) 1/9 (11)
8 4/6 (67) 6/7 (86)
Table 2Estimates of risk difference (RD) for a multicenter trial comparing active drug and control group presented in Table1
Model RD SE 95 % Confidence interval ICC
Binomial identity 0.126 0.059 0.011, 0.241 0.218
Poisson identity 0.125 0.058 0.012, 0.238 0.219
Normal identity 0.127 0.060 0.011, 0.244 0.217
Binomial log 0.126 0.059 0.011, 0.241 0.218
Poisson log 0.125 0.058 0.012, 0.238 0.219
Binomial logit 0.126 0.059 0.011, 0.241 0.218
Our study evaluated a randomized trial design. How-ever, we would expect center variability or within-center correlation to be a larger issue for observational studies where it is not unusual for centers to differ in the inter-ventions used as well as their patient populations [13,
47]. While it is unusual for more than one baseline co-variate to be included in the primary analysis of an RCT, adjustment for more than one covariate or alternative methods such as propensity scores may be needed in an observational study setting, and the methods evaluated here may perform differently in these scenarios.
We also did not consider the presence of an action between the intervention and a covariate or inter-vention and center. These situations are important, particularly if we are trying to evaluate heterogeneity of treatment effect. We recommend that these issues be evaluated in future studies.
Conclusion
In conclusion, we recommend adjusting for center in multicenter studies. In an RCT setting with small num-ber of centers, GEE regression models perform well for the estimation of RD, even under a misspecified model. Our results support the use of a binomial or Poisson GEE model with identity link and robust variance esti-mates. In cases where these models fail to run either a logistic regression, log Poisson regression, or linear re-gression GEE model with exchangeable correlation and robust standard errors (with small sample size correction if number of centers is <50) can be used to estimate the risk difference with correlated binary data. When pre-paring statistical analysis plans, we would recommend to state an alternative method of analyses in case of non-convergence of the primary method.
Additional file
Additional file 1Additional results and sample R code. (PDF 275 kb)
Acknowledgements
We thank the reviewers for helpful comments that improved the paper.
Funding
None.
Availability of data and materials
R code for implementing all regression models is given in the supplemental material (Additional file1). The ASSIST trial data is presented in Thompson et al. [27]. The multicenter trial data from the second example is presented in Table1.
Authors’contributions
CP conceived the research question, initiated the simulation code and supervised the implementation of the simulation study. VTTT helped develop and implement the code. Both authors drafted the manuscript, critically reviewed it and approved the final manuscript.
Competing interests
The authors declare that they have no competing interests.
Consent for publication
Not applicable.
Ethics approval and consent to participate
Not applicable.
Received: 12 February 2016 Accepted: 18 August 2016
References
1 Greenland S. Interpretation and choice of effect measures in epidemiologic analyses. Am J Epidemiol. 1987; 125:761–8.
2 Cook RJ, Sackett DL. The number needed to treat: a clinically useful measure of treatment effect. BMJ. 1995; 310:452–4.
3 Sinclair JC, Bracken MB. Clinically useful measures of effect in binary analyses of randomized trials. J Clin Epidemiol. 1994; 47:881–9. 4 Schechtman E. Odds ratio, relative risk, absolute risk reduction, and the
number needed to treat–which of these should we use?Value Health. 2002; 5:431–6.
5 Laupacis A, Sackett DL, Roberts RS. An assessment of clinically useful measures of the consequences of treatment. N Engl J Med. 1988; 318:1728– 33.
6 North D. Number needed to treat. Absolute risk reduction may be easier for patients to understand. BMJ. 1995; 310:1269.
7 Ayton P. Number needed to treat. Risk measures expressed as frequencies may have a more rational response. BMJ. 1995; 310:1269.
8 Hayward RA, Kent DM, Vijan S, Hofer TP. Multivariable risk prediction can greatly enhance the statistical power of clinical trial subgroup analysis. BMC Med Res Methodol. 2006; 6:18.
9 Fagerlin A, Zikmund-Fisher BJ, Ubel PA. Helping patients decide: ten steps to better risk communication. J Natl Cancer Inst. 2011; 103:1436–43. 10 Ghosh AK, Ghosh K. Translating evidence-based information into effective
risk communication: current challenges and opportunities. J Lab Clin Med. 2005; 145:171–80.
11 Moher D, Hopewell S, Schulz KF, Montori V, Gøtzsche PC, Devereaux PJ, et al. CONSORT 2010 Explanation and Elaboration: updated guidelines for reporting parallel group randomised trials. BMJ. 2010; 340.http://www.bmj. com/content/340/bmj.c869.
12 Senn S. Testing for baseline balance in clinical trials. Stat Med. 1994; 13: 1715–26.
13 Kahan BC. Accounting for centre-effects in multicentre trials with a binary outcome–when, why, and how?BMC Med Res Methodol. 2014; 14:20. 14 Kahan BC, Morris TP. Improper analysis of trials randomised using stratified
blocks or minimisation. Stat Med. 2012; 31:328–40.
15 Parzen M, Lipsitz SR, Dear KB. Does clustering affect the usual test statistics of no treatment effect in a randomized clinical trial?Biom J. 1998; 40:385–02. 16 Zou G. A modified poisson regression approach to prospective studies with
binary data. Am J Epidemiol. 2004; 159:702–6.
17 Spiegelman D, Hertzmark E. Easy SAS calculations for risk or prevalence ratios and differences. Am J Epidemiol. 2005; 162:199–200.
18 Bender R, Kuss O, Hildebrandt M, Gehrmann U. Estimating adjusted NNT measures in logistic regression analysis. Stat Med. 2007; 26:5586–95. 19 Gehrmann U, Kuss O, Wellmann J, Bender R. Logistic regression was
preferred to estimate risk differences and numbers needed to be exposed adjusted for covariates. J Clin Epidemiol. 2010; 63:1223–31.
20 Liang KY, Zeger SL. Longitudinal data analysis using generalized linear models. Biometrika. 1986; 73:13–22.
21 Mancl LA, DeRouen TA. A covariance estimator for GEE with improved small-sample properties. Biometrics. 2001; 57:126–34.
22 Shankaran S, Laptook AR, Pappas A, McDonald SA, Das A, Tyson JE, et al. Effect of depth and duration of cooling on deaths in the NICU among neonates with hypoxic ischemic encephalopathy: a randomized clinical trial. JAMA. 2014; 312:2629–39.
24 Morris BH, Oh W, Tyson JE, Stevenson DK, Phelps DL, et al. Aggressive vs. conservative phototherapy for infants with extremely low birth weight. N Engl J Med. 2008; 359:1885–96.
25 Eldridge SM, Ashby D, Feder GS, Rudnicka AR. Ukoumunne OC. Lessons for cluster randomized trials in the twenty-first century: a systematic review of trials in primary care. Clin Trials. 2004; 1:80–90.
26 Austin PC. A comparison of the statistical power of different methods for the analysis of cluster randomization trials with binary outcomes. Stat Med. 2007; 26:3550–65.
27 Thompson SG, Warn DE, Turner RM. Bayesian methods for analysis of binary outcome data in cluster randomized trials on the absolute risk scale. Stat Med. 2004; 23:389–410.
28 Turner RM, Omar RZ, Thompson SG. Bayesian methods of analysis for cluster randomized trials with binary outcome data. Stat Med. 2001; 20:453– 72.
29 R Core Team. R: A Language and Environment for Statistical Computing. Vienna; 2014.http://www.R-project.org/.
30 Hjsgaard S, Halekoh U, Yan J. The R Package geepack for Generalized Estimating Equations. J Stat Softw. 2006; 15/2:1–11.
31 Yan J, Fine JP. Estimating Equations for Association Structures. Stat Med. 2004; 23:859–80.
32 Yan J. geepack: Yet Another Package for Generalized Estimating Equations. R-News. 2002; 2/3:12–4.
33 Stevenson M, Nunes T, Heuer C, Marshall J, Sanchez J, Thornton R, et al. epiR: An R package for the analysis of epidemiological data. 2014. R package version 0.9-59.http://CRAN.R-project.org/package=epiR. 34 Moher M, Yudkin P, Wright L, Turner R, Fuller A, Schofield T, et al. Cluster
randomised controlled trial to compare three methods of promoting secondary prevention of coronary heart disease in primary care. BMJ. 2001; 322:1338.
35 Beitler PJ, Landis JR. A mixed-effects model for categorical data. Biometrics. 1985; 41:991–1000.
36 Rothwell PM, Mehta Z, Howard SC, Gutnikov SA, Warlow CP. Treating individuals 3: from subgroups to individuals: general principles and the example of carotid endarterectomy. Lancet. 2005; 365:256–65.
37 Ukoumunne OC, Forbes AB, Carlin JB, Gulliford MC. Comparison of the risk difference, risk ratio and odds ratio scales for quantifying the unadjusted intervention effect in cluster randomized trials. Stat Med. 2008; 27:5143–55. 38 Cheung YB. A modified least-squares regression approach to the estimation
of risk difference. Am J Epidemiol. 2007; 166:1337–44.
39 Yelland LN, Salter AB, Ryan P. Performance of the modified Poisson regression approach for estimating relative risks from clustered prospective data. Am J Epidemiol. 2011; 174:984–92.
40 Zou GY, Donner A. Extension of the modified Poisson regression model to prospective studies with correlated binary data. Stat Methods Med Res. 2013; 22:661–70.
41 Cheng G, Yu Z, Huang JZ. The cluster bootstrap consistency in generalized estimating equations. J Multivar Anal. 2013; 115:33–47.
42 Yelland LN, Salter AB, Ryan P, Laurence CO. Adjusted intraclass correlation coefficients for binary data: methods and estimates from a cluster-randomized trial in primary care. Clin Trials. 2011; 8:48–58.
43 Ritz J, Spiegelman D. Equivalence of conditional and marginal regression models for clustered and longitudinal data. Stat Methods Med Res. 2004; 13: 309–23.
44 Diggle P, Heagerty P, Liang KY, Zeger S. Analysis of Longitudinal Data: Oxford: Oxford University Press; 2002.
45 Li P, Redden DT. Small sample performance of bias-corrected sandwich estimators for cluster-randomized trials with binary outcomes. Stat Med. 2015; 34:281–96.
46 Kahan BC, Harhay MO. Many multicenter trials had few events per center, requiring analysis via random-effects models or GEEs. J Clin Epidemiol. 2015; 68:1504–11.