R E S E A R C H A R T I C L E
Open Access
Process based quality improvement using a
continuous renal replacement therapy
dashboard
Theresa A. Mottes
1*, Stuart L. Goldstein
2and Rajit K. Basu
3Abstract
Background:The prevalence of continuous renal replacement therapy (CRRT) utilization in critically ill patients with acute kidney is increasing. In comparison to published and on-going trials attempting to answer questions
surrounding the optimal timing of CRRT initiation, anticoagulation, and modality, a paucity of literature describes the quality of the therapy delivered.
Methods:We conducted a single-center process improvement project to determine if a methodology to assess the quality of CRRT delivery could lead to improvement in CRRT delivery outcomes. We developed three broad
categories of objective CRRT metrics to assess longitudinally, enabling creation of a CRRT Dashboard. Following the objective categories of“filter”,“prescription”, and“fluid balance”over time allowed us to perform quarterly analyses, target provider based CRRT education, and address variation from our standard of care. From 2012 to 2017, 184 critically ill patients received CRRT.
Results:We report a mean filter life of 56 + 28.4 h, a 60-h filter life of 62%, and unplanned filter changes of 15%. Compared to a minimum target prescription of 2000 ml/1.73 m2/hour, we report the mean prescribed dose (2300 ml/1.73 m2/hour) and the rate of patients receiving at least the minimum prescription (98%). Finally, using a 10% deviation in the acceptable range of desired daily patient fluid balance, we report 83% CRRT patient days achieving an acceptable stipulated fluid goal.
Conclusion:We report the implementation of a quality dashboard and adopting quality improvement strategies provided a platform for measuring adherence to our institutional standards and the delivery of CRRT, specifically on the process of the care.
Background
Acute kidney injury (AKI) occurs commonly in critically ill patients [1]. The current recommended management of AKI consists of supportive care including optimization of hemodynamics and systemic oxygenation with limitation or removal of ongoing iatrogenic sources of renal injury (e.g., nephrotoxic medications). For patients with severe AKI associated with significant electrolyte abnormalities and/or oliguria and concomitant fluid accumulation, continuous renal replacement therapy (CRRT) is often utilized for stabilization [2]. The increasing prevalence of
CRRT utilization parallels recent epidemiologic data dem-onstrating the increase in AKI prevalence across the world in both adults and children [3].
CRRT is an invasive and technically complex form of extracorporeal support. Similar to other forms of invasive organ support such as mechanical ventilation and extra-corporeal membrane oxygenation (ECMO), the majority of existing data and ongoing research investigate the appli-cation of the therapy with patient outcomes such as length of stay, complication rates, and mortality [4]. Also, just as in mechanical ventilation and ECMO, controversy surr ounds the application of CRRT and a majority of research investigates aspects such as patient selection, timing of initiation, CRRT modality, anticoagulation method, and dose [5,6]. The processes by which CRRT is delivered and the quality of that delivery, however, lack formal * Correspondence:[email protected]
1Renal Section, Department of Pediatrics, Texas Children’s Hospital, Baylor
College of Medicine, Feigin Building ,1102 Bates Ave, Suite 245, Houston, TX 77030, USA
Full list of author information is available at the end of the article
consensus for a standard of care. Compared to the contro-versies listed above, very little published data exist describ-ing how the therapy is actually delivered and/or how well the actual delivery matches the goals set by the prescribing provider(s) [7]. The assessment of CRRT quality repre-sents a clinical gap of knowledge.
Optimal CRRT delivery requires a multidisciplinary, sim ultaneous and continuous coordination of care from mul-tiple providers and areas of expertise. The complexity can lead to significant deviation in how CRRT is delivered between providers and institutions. The deviation can sub-sequently lead to significant discrepancies in CRRT delivery which ultimately can affect the actual receipt of the therapy by the patient. Few protocols are published describing how services can be coordinated to streamline CRRT delivery. Currently, there is a lack of data and benchmarks to evalu-ate the process of CRRT delivery that would enable com-parisons between patient populations, providers, or institutions. Studying the care delivery process is crucial and can be performed by measuring and constantly surveil-ling process and outcome metrics. The study of process measures can render an index of quality by providing a quantifiable level of adherence to accepted performance standards. Incorporation of quality improvement science in critical illness is becoming more common and an increas-ing level of scrutiny is now given to level of variability from standards of care [8].
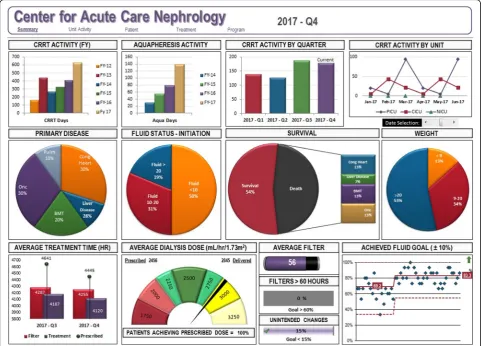
We hypothesized commonly used variables related to CRRT delivery could yield process and outcome metrics that can be tracked longitudinally. We aim to create a set of standards suitable for benchmarking, comparisons within our program as well as other programs, and for the purpose of creating a standard of care for adherence when delivering CRRT. This report describes the devel-opment of a CRRT Dashboard as a quality improvement tool (Fig.1).
Methods Patients
All data were collected from intensive care units (new-born, cardiac, and pediatric–denoted NICU, CICU, and PICU respectively) from Cincinnati Children’s Hospital Medical Center. The data are collected from a longitudinal assessment of CRRT delivery. Time windows for data col-lection are described in each section of the results per metric of interest, but the overall time of study for the dashboard reported here is from July 2012 to June 2017. This project was approved by the CCHMC Institutional Review Board with a waiver of informed patient consent as this was a non-interventional quality improvement pro-ject. In the data shown, the timeframe years is denoted as fiscal year (FY) (as opposed to calendar year). For ex-ample, FY 16 is the time frame of July 2015 through June 2016. The number of patients studied is denoted per
metric quantified. CRRT patient days are calculated as the sum total of days CRRT used for the total number of pa-tients over a given time window.
Dashboard metrics
Activity
Activity metrics are updated on a quarterly and yearly basis. The following metrics are tracked: 1)RRT Activity–a total number of RRT days accounting for continuous RRT (CRRT), 2) CRRT Activity by Unit–total number of CRRT patient days separated by unit, 3) Primary Disease of pa-tients receiving CRRT (classified by major organ system of pathology), 4) Patient ICU admission weight–patients cat-egorized into categories: < 9 kg, 9-20 kg, and > 20 kg, and 5) Survival broken down by primary organ system pathology.
Filter survival
The optimal delivery of CRRT is contingent on maintain-ing a well-functionmaintain-ing CRRT circuit, thereby minimizmaintain-ing the time the patient is not receiving therapy. The time a patient is receiving therapy can be derived from the func-tional survival of the filter on a given machine. Filter sur-vival, must be adjudicated however, as it is influenced by prescription, providers, and the characteristics of the pa-tient. Filter survival is therefore assessed in two ways:“ fil-ter life”and“unplanned filter changes”(UFCs).
Filter lifeis defined as the duration of time, measured in hours, an individual filter or circuit is delivering ther-apy to the patient. Filter life is the difference between start time of the therapy and end time. Filter life can be objectively measured in two ways. Individual filter life is the duration of time a single filter functions for a single patient. Groups of filters are measured as percentage of filters surviving to a period of time (in hours). An a priori cut-off of 60 h was used as the operating bench-mark of comparison for filter life [9].
Unplanned Filter Changesprovide an objective meas-ure of variation that evaluates the whole CRRT delivery system. Filter changes were divided into planned and un-planned (PFC and UFC, respectively). Any filter changed after 60 h or changed before 60 h because of a patient procedure (e.g. travel to the operating room, an emer-gent patient event, or patient death was denoted as a PFC [10]). Any filter change prior to 60 h exclusive of the reasons listed below is denoted as UFC. Filter changes were studied in groups of 15 consecutive filters. UFC percentage was calculated by counting the number of UFCs by the total number of filter changes (PFCs + UFCs).
Prescription
Discrepancy between prescribed and delivered was quantified by simultaneously measuring both values and calculating % delivered (i.e., the number of patients achieving delivered dose divided by total number of pa-tients in the specific period).
Minimum Prescription: Using the total number of CRRT hours delivered to the patient and the total efflu-ent measured in mL, the delivered CRRT dose in mL/kg per hour as well as mL/1.73 m2 (patient body surface area) per hour were calculated. The median delivered dose for patients over a given quarter was analyzed. A minimum baseline prescription of 2000 ml/1.73 m2/ hour was used as the “red” zone. An odometer style gauge was used to visualize this metric.
Average Treatment Time is the quantified average of time for an individual patient treatment course on
CRRT. The dashboard displays average life of filter, aver-age prescribed time, and averaver-age filter time (in hours).
Fluid balance
Fluid accumulation is objectively measured by a previ-ously developed derived formula [11] in the context of RRT utilization. Fluid accumulation is expressed as percent fluid overload (% FO). Fluid as a metric on the dashboard is separated into fluid status at initiation and achievement of daily fluid goals. The formula for calcu-lating fluid overload is:
[((Intake (liters) from ICU admission to CRRT start -Output (liters) from ICU admission to CRRT start)/ 1000))/ICU admission weight (kg)] [12].
categories were developed utilizing the literature and associated outcomes [11]. We track both the % FO at the time of nephrology consultation and the % FO at the time of RRT initiation.
Achieved Fluid Goal (Desired Total Fluid Output): The Nephrology and Critical Care team at our institution agree upon a daily fluid balance goal for all patients receiving CRRT during morning rounds. The a priori designated acceptable range of a fluid goal is ±10% of target. Calculation of the variability from the target fluid goal assumes the actual 24-h total output will be equiva-lent to the total 24-h intake minus the net 24-h fluid balance goal. The percentage of patients shown in the dashboard control chart is the percentage achieving the acceptable range of ±10% of the desired fluid output. For example, a patient with a 24 h total intake of 2200 mL and 24 h net fluid goal of a negative 250 mL, has desired total output of 2450 mL. If the actual patient total out-put for the same 24 h period is 2350 mL, the patient has reached 95% of the desired total fluid output, achieving the acceptable range of ±10% of the desired fluid balance.“Desired fluid output”was chosen as the metric to follow as “net fluid balance” results in the possibility of a failure to calculate achievement based on a denom-inator of “zero”. Statistics: Individual patient or filter data are displayed on the dashboard. Variables with nor-mal distribution were compared using the Student’s T-test and Fisher’s exact tests of comparison with ANOVA for multiple comparisons. Non-parametric data were compared using the Mann-Whitney U test. Circuit survival data were censored for Kaplan-Meier analysis for the following indications: patient death or withdrawal of support, patient procedure requiring CRRT discon-tinuation, patient regaining renal function or transition to intermittent hemodialysis and scheduled circuit change [9,13]. A p-value for < 0.05 was considered sig-nificant for these comparisons. Data analysis was per-formed using SAS software 9.4, Cary, NC, USA, (Copyright © 2002–2012 SAS Institute Inc).
Longitudinal evaluation of dashboard metrics was con-ducted using statistical process control method to iden-tify changes from baseline rates for each metric [14]. We evaluated all rates per 15 CRRT filters used. We set an a priori standard of eight consecutive metric rates above or below the baseline rate to qualify as a statistical change, (or special cause in process control vernacular), which corresponds to 99.7% likelihood that the change observed resulted from the improvement intervention [15]. This methodology has served as the primary quality improvement assessment measurement to track the ser-ious safety event rates for the past 15 years at CCHMC [16] .The control chart facilitates the monitoring of peri-odic changes using special-cause variation rules. Visualization of the trends subsequently can lead to
root-cause analyses of variability, highlight weaknesses or errors, and the effect of interventions.
Results
For the purpose of this analysis, data analyzed were from FY2012 through FY2017 (analyzed either per quarter, per annum, or longer depending on the metric of inter-est). Quarterly “CRRT Dashboards” are created by extracting data from three month blocks in that period of time (Fig.1).
RRT activity
One hundred eighty-four patients received RRT between 2012 and 2017. CRRT was delivered for a total of 2090 days (1221 PICU, 535 CICU, 63 NICU). CRRT was uti-lized in patients with a wide variety of primary patholo-gies and roughly half (53%) weighed more than 20 kg. Eighty-seven (47%) patients did not survive to ICU discharge.
Filter life and unplanned filter changes
Data assessing filter life are compiled from 2013 to 2017 and shown in Table 1. All patients received CRRT using the Prismaflex™ (Gambro Renal Products, Lund, Sweden). Per manufacturer recommendations, filters are changed every 72 h. The mean filter life was 56 ± 28.4 h. Sixty-two percent of filters were functional at 60 h. Un-planned Filter Changes steadily decreased from 40% in 2014 to below 15% in 2017.
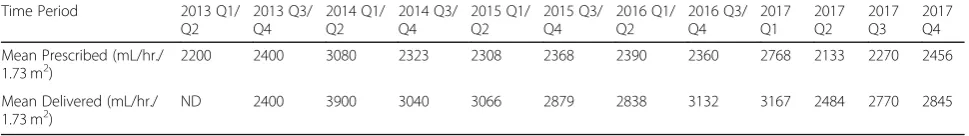
Prescribed effluent dose
The mean prescribed CRRT dose was 2421 ml + 259 /1.73m2/hour. Our data demonstrate a prescribed dose consistent with our institutional standard during this period (Table 2). Furthermore, 100% of prescriptions were above the minimal target dose of 2000 ml/1.73 m2/ hour.
Delivered vs. prescribed effluent dose
The rate of patients achieving at least 90% of the pre-scribed dose increased from 2014 to 2017 (87 to 100%) and remained at 100% for all subsequent quarters.
Fluid balance
Discussion
Since the landmark report by the Institute of Medicine To Err is Human: Building a Safer Health System, a significant amount of human and financial capital has been dedicated to improve patient safety [17]. A central conclusion from the report indicated the root of medical errors were in part secondary to a high degree of tice variability and inconsistency. Since that time, prac-tice variation within and between institutions has become a focus of study in quality improvement [18, 19]. Reducing practice variation, and creation of care standards has ultimately lead to an increase the level of quality and safety for patients. Significant practice vari-ation has already been shown in multiple patient envi-ronments to be directly associated with poor patient outcome [19]. In this report, we describe the creation of an acute RRT dashboard with numerous quantifiable outcome metrics to assess and in some cases, track improvement in the quality of care delivered.
The dashboard provides an ongoing assessment of performance and facilitates analyses of variations and deviations from standards of care. For example, filter survival is a litmus test for a well-functioning circuit and can therefore be used as a reflection of CRRT quality and real-time maintenance [20]. By a time measure, filter life varies greatly in the existing literature from 1 to 188 h [9, 20]. A pediatric multicenter prospective observa-tional study studying 138 patients reported a mean filter life of 44.7 ± 35.9 h [9]. By survival percentage, 70% of filters were functional at 60 h [9]. We therefore incorpo-rated 60 h as our accepted process standard for filter life. Although the median filter life is important to follow over time, unplanned filter changes reflect subtler RRT practice patterns and provide an objective measure of variation in the CRRT delivery system. Existing data in-dicate insufficient dose (< 20 ml/kg/hr. in adults) to be unsafe and result in poor outcomes [21]. Additionally,
existing data indicate that actual dose delivered can be significantly different from the dose prescribed [22]. In practice, the most significant factor affecting delivered dose is time off-filter; single-center study reports a me-dian downtime of 3.0 h (1.0–8.3 h) per day [23]. The most common causes of time off filter or “down-time” are filter clotting, catheter malfunction, machine alarm and procedures [24].
Visualization of the trends subsequently can lead to root-cause analyses of variability, highlight weaknesses or errors (e.g., inadequate anticoagulation or prescrip-tion, staff inexperience), and the effect of interventions (e.g., introduction of protocols, education sessions for staff ) [10,25,26].
Upon detection of a deviation, our institutional prac-tice is to investigate for the potential root cause. We term this investigation a “deep dive” (Fig. 2), which constitutes a factor analysis of patient (selection criteria, initiation, size and body habitus, special circumstances), equipment (inclusive of access catheter and machine), technical proficiency (nursing care and pharmacy), and the prescription of the therapy (modality, dose, anticoa-gulation). The example shown in Fig. 2 is a standard starting point to investigate a deviation in delivered time vs. prescribed time. A deviation was noted in Q1 FY 2017 (Tables1-3). At this time, the deep dive discovered a single patient averaged 20.2 h of therapy per day, with a filter life approximately 18 h. This resulted in signifi-cant downtime, dramatically influencing the delivered CRRT dose. Further examination revealed the circuit life was being compromised by the excessive circuit clotting which can be predicted by a high pressure drop across the filter. To ensure adherence to our institutional antic-oagulation standards, we analyzed our post-filter ionized calcium levels. We confirmed that the majority of the levels were within adequate range and the adjustments to the anticoagulation rates were according to the
Table 1Filter Life
Time Period 2013 Q1/ Q2 2013 Q3/ Q4 2014 Q1/ Q2 2014 Q3/ Q4 2015 Q1/ Q2 2015 Q3/ Q4 2016 Q1/ Q2 2016 Q3/ Q4 2017 Q1 2017 Q2 2017 Q3 2017 Q4
Mean Filter Life (hours) ND 50 47 44 44 53 54 55 43 45 53 56
Unplanned Filter Change (%)
33 40 40 34 34 34 26 16 40 26 15 15
Filter Survival > 60 h (%)
58 58 64 62 58 58 67 58 49 56 79 78
Table 2Dose of Continuous Renal Replacement Therapy
Time Period 2013 Q1/ Q2 2013 Q3/ Q4 2014 Q1/ Q2 2014 Q3/ Q4 2015 Q1/ Q2 2015 Q3/ Q4 2016 Q1/ Q2 2016 Q3/ Q4 2017 Q1 2017 Q2 2017 Q3 2017 Q4
Mean Prescribed (mL/hr./
1.73 m2) 2200 2400 3080 2323 2308 2368 2390 2360 2768 2133 2270 2456
Mean Delivered (mL/hr./ 1.73 m2)
protocol. Through the deep dive we were able to con-firm adherence to the standard practice guideline with regards to the prescription and anticoagulation protocols and no process corrective action was necessary. In Q2 FY2017, the CRRT trained nurses from the cardiac intensive care unit all came through our RRT educa-tional program for the second time. The resulting effects of these actions were apparent in the data that emerged in Q3 and Q4 FY2017.
In pediatric practice, perhaps the most common indi-cation for acute RRT initiation is excessive fluid overload and oliguric AKI [27]. The Prospective Pediatric CRRT (ppCRRT) registry introduced the concept of quantifi-able fluid overload and in retrospective study described how incremental escalation in fluid overload at the time of RRT initiation carried a direct, increasing association with patient mortality, independent of severity of illness. A recent meta-analysis of available pediatric data Fig. 2Deep Dive for Practice Deviation. On tracking data, the detection of a deviation from our institutional normative values triggers a“deep dive”factor analysis. The rationale (if present) for the deviation is determined and then individual factors are studied relating to patient, equipment, and the convergence of the two with the provider team (i.e., technical proficiency and prescription). The example shown is a standard deep dive list of questions asked for a deviation in delivered versus prescribed time
Table 3Continuous Renal Replacement Therapy Treatment Times
Time Period 2014 Q1/
Q2
2014 Q3/ Q4
2015 Q1/ Q2
2015 Q3/ Q4
2016 Q1/ Q2
2016 Q3/ Q4
2017 Q1
2017 Q2
2017 Q3
2017 Q4
Mean Prescribed Time (hours)
185 210 278 4511 4060 4916 2559 2915 4641 4445
Mean Filter Time (hours) 160 176 199 3815 3825 4408 2176 2683 4287 4255
Mean Treatment Time (hours)
150 170 190 3695 3529 4262 2024 2618 4187 4120
concludes that significant fluid overload is associated with poor patient outcomes [28]. Of note, regulation of patient fluid balance is amodifiableaspect of critical ill-ness, regardless of the presence of kidney injury. Regular and consistent adjudication of both fluid administration and fluid removal, accounting for the phase of illness and context of the patient, can be crucial to patient out-come [29]. Of note, pediatric and neonatal patients may be particularly affected by fluid dysregulation given the marked heterogeneity in total body water percentage as a function of age. In practice, the desire to mitigate fluid accumulation and to remove fluid is a common indica-tion for CRRT, therefore measuring the percentage of fluid overload at the start of CRRT is an essential meas-ure. Precise control over fluid balance is a primary bene-fit and common indication of CRRT utilization in the management of critically ill patients; tracking the efficacy of attaining a fluid “goal” as a discrete metric is both obvious and possible. While variations exist in how fluid removal rates are ordered and implemented (e.g., hourly, per shift, or per 24-h period) attention to the achieve-ment of fluid balance targets and factors influencing those targets is vital.
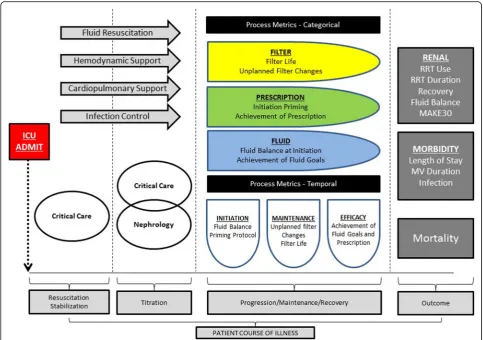
Many aspects of RRT delivery are controversial. Des-pite decades of study, the optimal dose of RRT is not known. Several recent studies investigating the optimal timing of initiation resulted in discordant findings (al-though the studies were significantly different in design [30–32]. In addition, many variables assumed to be asso-ciated with outcomes have been studied in some fashion or are currently actively being studied (Fig. 3). These
metrics, however, are reliant on high quality, highly reproducible delivery of RRT. Therefore, how RRT is delivered matters and tracking RRT delivery process metrics can improve the quality of care delivery. We demonstrate an increase over time in filter life, a decrease in unplanned filter changes, and an increase in achievement of daily fluid goals. With the increased utilization of RRT during this time, a highly complex extracorporeal support modality, our survival remained constant. We conclude from this that our tracking process performance and adhering to benchmarks of process quality ensured that our “primary outcome” of survival remained constant, even amidst the high volume and the changing landscape of the traditional variables studied in RRT (Fig.3). We believe that the process met-rics of RRT delivery are the foundation of therapy and must be tracked if studied investigating how modifiable RRT practice parameters (timing of initiation, optimal dose, method of anticoagulation) affect patient outcome can actually be trusted (Fig. 4). A consistent, objective, and longitudinal assessment of performance is a stand-ard of care.
Efforts to reduce practice variation in the intensive care unit (ICU) are underway. Individual practice varia-tions can be an indicator of poor quality of care. Atten-tion to the quality of cardiopulmonary resuscitaAtten-tion (CPR) for patients suffering cardiac arrest is an apt example. Data now indicates that survival from cardiac arrest is not simply related to the timely provision of CPR in response to an arrest, but thequalityof the CPR itself [33]. For decades, time to CPR and time to
defibrillation were believed to be the primary criterion associated with patient survival. The quality of CPR and the quality of defibrillation were assumed. Recent atten-tion has now underscored the importance of pace and depth of compressions as markers of CPR quality. Sub-sequently, adherence to American Heart Association (AHA) guidelines dictating the depth and pace of com-pressions, and enhancing team cohesion via team train-ing, has significantly improved survival [34]. Applying these same quality improvement strategies to CRRT care, by establishing measurable criteria to gauge CRRT care delivery, may enable an objective standard for evaluating performance, quality, and safety.
In total, the process measures we describe are central to the efficacious delivery of CRRT to a patient. Each measure objectively assesses an individual aspect of CRRT and together give us an illustrative and inform-ative assessment of the state of our practice. Use of this CRRT process dashboard allows us readily to create
internal standards of care, making it possible to quickly identify our own inconsistencies and spend time attempting to understand the reasons behind variability in practice. Ultimately, these process metrics are meas-urable and valuable to study in and of themselves but are likely directly impactful to the traditional hard patient outcomes specific to the kidney, to morbidity, and to mortality.
Our study has several limitations. As this is a single cen-ter study, the metrics and benchmarks are based on our institutional protocols and standard practice guidelines. While we demonstrate improvement in specific quality improvement measures, single center data is difficult to extrapolate to other centers as it is impacted by institu-tional practices. Addiinstitu-tionally, the improvements in the delivery of CRRT care may not correlate with improving patient outcomes. Further studies are necessary to evalu-ate and better understand the impact of these quality improvement measures on the delivery of CRRT care. Fig. 4Process metrics in the Delivery of RRT. We believe that a proper analysis and objective quantification of the RRT delivery process will not only facilitate standards for centers and between institutions, but also provides the needed assurance and foundation that the afore mentioned
Conclusions
Continuous renal replacement is a highly complex and technical therapy delivered to critically ill patients. As-sumptions about how effective the therapy is cannot be made simply by whether a patient survives. The process by which the therapy delivered is important and can be measured and, in reality, needs to be assured if the results of large scale trials investigating timing, anticoagulation, modality, and dose are to be trusted. Currently, very few studies describe efforts to improve the quality of CRRT care or even measure the performance of care delivery. We believe our standard for CRRT process measurement will facilitate the creation of standards, quality of care, and best practice guidelines by which benchmarking can be enabled–both within an institution and between institu-tions. The care for patients receiving CRRT can subse-quently improve. Moving the needle of practice in an objective and measurable way towards consistency and mitigation of avoidable variability will improve safety for patients and the quality of CRRT care.
Abbreviations
% FO:Percent fluid overload; AHA: American Heart Association; AKI: Acute kidney injury; CICU: Cardiac intensive care unit; CPR: Cardiopulmonary resuscitation; CRRT: Continuous renal replacement therapy;
ECMO: Extracorporeal membrane oxygenation; FY: Fiscal year; ICU: Intensive care unit; NICU: Neonatal intensive care unit; PFC: Planned filter changes; PICU: Pediatric intensive care unit; ppCRRT: Prospective pediatric CRRT registry; UFC: Unplanned filter changes
Acknowledgements
Not applicable
Funding
The project was completed with internal divisional funds and played no role in collecting, analyzing and interpreting the data.
Availability of data and materials
The datasets generated and/or analyzed during the current study are not publicly available because the data is used internally for quality
improvement processes currently, but are available from the corresponding author on reasonable request.
Authors’contributions
TM collected, analyzed and interpreted the data for quality improvement in CRRT; as well as a major contributor in writing the manuscript. SG provided oversight in analyzing and interpreting the data and was a major contributor in writing the manuscript. RB analyzed, interpreted the data, applied quality improvement concepts, and was a major contributor in writing the manuscript. All authors read and approved the final manuscript.
Competing interest
The author(s) declare(s) that they have no competing interests.
Ethics approval and consent to participate
This project was approved by the Cincinnati Children’s Hospital Medical Center Institutional Review Board with a waiver of informed patient consent as this was a non-interventional quality improvement project.
Consent for publication
Not applicable
Publisher’s Note
Springer Nature remains neutral with regard to jurisdictional claims in published maps and institutional affiliations.
Author details
1Renal Section, Department of Pediatrics, Texas Children’s Hospital, Baylor
College of Medicine, Feigin Building ,1102 Bates Ave, Suite 245, Houston, TX 77030, USA.2Center for Acute Care Nephrology, Cincinnati Children’s Hospital Medical Center, University of Cincinnati College of Medicine, Cincinnati, OH 45229, USA.3Division of Critical Care Medicine, Children’s
Healthcare of Atlanta, Emory University, Atlanta, GA 30322, USA.
Received: 9 July 2018 Accepted: 26 December 2018
References
1. Kaddourah A, et al. Epidemiology of acute kidney injury in critically ill children and young adults. N Engl J Med. 2017;376(1):11–20. 2. Goldstein SL. Overview of pediatric renal replacement therapy in acute
kidney injury. Semin Dial. 2009;22(2):180–4.
3. Beltramo F, et al. Renal replacement therapy modalities in critically ill children. Pediatr Crit Care Med. 2018;19(3):210–7.
4. Symons JM, et al. Demographic characteristics of pediatric continuous renal replacement therapy: a report of the prospective pediatric continuous renal replacement therapy registry. Clin J Am Soc Nephrol. 2007;2(4):732–8.
5. Bagshaw SM, et al. When to start renal replacement therapy in critically ill patients with acute kidney injury: comment on AKIKI and ELAIN. Crit Care. 2016;20(1):245.
6. Gaudry S, et al. Comparison of two strategies for initiating renal replacement therapy in the intensive care unit: study protocol for a randomized controlled trial (AKIKI). Trials. 2015;16:170.
7. Tolwani A, et al. Standard versus high-dose CVVHDF for ICU-related acute renal failure. J Am Soc Nephrol. 2008;19:1233–8.
8. Measuring and improving quality of care. A report from the american heart association/American college of cardiology first scientific forum on assessment of healthcare quality in cardiovascular disease and stroke. Stroke. 2000;31(4):1002–12.
9. Brophy PD, et al. Multi-Centre evaluation of anticoagulation in patients receiving continuous renal replacement therapy (CRRT). Nephrol Dial Transplant. 2005;20(7):1416–21.
10. Mottes T, et al. Improving delivery of continuous renal replacement therapy: impact of a simulation-based educational intervention. Pediatr Crit Care Med. 2013;14(8):747–54.
11. Sutherland SM, et al. Fluid overload and mortality in children receiving continuous renal replacement therapy: the prospective pediatric continuous renal replacement therapy registry. Am J Kidney Dis. 2010;55(2):316–25. 12. Goldstein SL, et al. Outcome in children receiving continuous venovenous
hemofiltration. Pediatrics. 2001;107(6):1309–12.
13. Hackbarth R, et al. The effect of vascular access location and size on circuit survival in pediatric continuous renal replacement therapy: a report from the PPCRRT registry. Int J Artif Organs. 2007;30(12):1116–21.
14. Langley GJ, et al. The Improvement Guide: A Practical Approach to Enhancing Organizational Performance. 2nd ed. San Francisco: Jossey-Bass; 2009.
15. Mohammed MA, Worthington P, Woodall WH. Plotting basic control charts: tutorial notes for healthcare practitioners. Qual Saf Health Care. 2008;17(2):137–45.
16. Muething SE, et al. Quality improvement initiative to reduce serious safety events and improve patient safety culture. Pediatrics. 2012;130(2):e423–31. 17. Kohn LT, Corrigan JM, Donaldson MS. To err is human: building a Safer
Health System. Vol. 6. National Academies Press (US); 2000.
18. Committee on Patient, S. and I. Quality, Committee Opinion No. 629: Clinical guidelines and standardization of practice to improve outcomes. Obstet Gynecol. 2015. 125(4):1027–9.
19. Rozich JD, Haraden CR, Resar RK. Adverse drug event trigger tool: a practical methodology for measuring medication related harm. Qual Saf Health Care. 2003;12(3):194–200.
21. Prowle JR, Schneider A, Bellomo R. Clinical review: optimal dose of continuous renal replacement therapy in acute kidney injury. Crit Care. 2011;15(2):207.
22. Ronco C, et al. Effects of different doses in continuous veno-venous haemofiltration on outcomes of acute renal failure: a prospective randomised trial. EDTNA ERCA J. 2002;28(S2):7–12.
23. Uchino S, et al. Continuous is not continuous: the incidence and impact of circuit "down-time" on uraemic control during continuous veno-venous haemofiltration. Intensive Care Med. 2003;29(4):575–8.
24. Baldwin I. Factors affecting circuit patency and filter 'life'. Contrib Nephrol. 2007;156:178–84.
25. Steele JR, et al. Guidelines for establishing a quality improvement program in interventional radiology. J Vasc Interv Radiol. 2010;21(5):617–25. 26. James B. Quality improvement opportunities in health care.Making it easy
to do it right. J Manag Care Pharm. 2002;8(5):394–9.
27. Sutherland SM, Goldstein SL, Alexander SR. The prospective pediatric continuous renal replacement therapy (ppCRRT) registry: a critical appraisal. Pediatr Nephrol. 2014;29(11):2069–76.
28. Alobaidi R, et al. Association between fluid balance and outcomes in critically ill children: a systematic review and meta-analysis. JAMA Pediatr. 2018;172(3):257–68.
29. Goldstein SL. Fluid Management in Acute Kidney Injury. J Intensive Care Med. 2012;29(4):183–9.
30. Network, T.V.N.A.R.F.T. Intensity of renal support in critically ill patients with acute kidney injury. N Engl J Med. 2008;359:7–20.
31. Investigators, R. R. T. S, et al. Intensity of continuous renal-replacement therapy in critically ill patients. N Engl J Med. 2009;361(17):1627–38. 32. Ronco C, Ricci Z, Bellomo R. Current worldwide practice of dialysis dose
prescription in acute renal failure. Curr Opin Crit Care. 2006;12(6):551–6. 33. Abella BS, et al. CPR quality improvement during in-hospital cardiac arrest
using a real-time audiovisual feedback system. Resuscitation. 2007;73(1):54–61. 34. Meaney PA, et al. Cardiopulmonary resuscitation quality: [corrected]