ISSN: 1942-9703 / CC BY-NC-ND Abstract—The recording EEG signals normally contains
physiological signals from various sources. The mixed brain signals and artifacts make interpretation and analysis of the EEG signals more difficult. In this study, a new method of drugs abuse detection based brain computer interface (BCI) which recorded with an electroencephalogram is developed. In the processing, the mixed signals need to be separated as interpretation of the drugs abuse detection is improved. In the signal processing, the EEG signal is filtered with baseline correction and band-pass filter and extracted using the Independent Component Analysis method. The brain maps of the subject before and after taking the methadone is distinguished. This study could be used to identify drug abusers and alternative tool for rehabilitation.
Index Terms—EEG, Artifact, DrugsUser, ICA, Brain Mapping, Classification, BCI, Methadone.
I. INTRODUCTION
IOMEDICAL signals (biosignal) in various forms are sources of information that come from the body and are very useful in the medical field. The main purpose of medical instrumentation is to measure or assist various medical problems, either for diagnose or for treatment [1-5]. The brain is a human organ composed of neuronal tissues that capable of generating potential electrical energy known as neuro-electric potentials. An EEG is a non-invasive measurement method that represents electrical signals from brain activity obtained by placement of multiple electrodes in the scalp of brain area, to obtain electrical brain signal information to be processed and analyzed [3-7]. Records obtained from EEG are called electroencephalograms which are the result of a typical and important measure of brain electrical activity [6]. EEG is an important tool for clinical practitioners to diagnose, monitor and treat disorders of the nerves or disease. The measured bios signal must be processed to make it easy to analyze. In the Sanei [6] and Turnip [8-10] studies, it was described that brain waves are composed of peak to peak and normally have an amplitude between 0.5 μV to 100 μV. The EEG signals carry
Manuscript received October 9, 2017. This research was supported by the Technical Implementation Unit for Instrumentation Development, Indonesian Institute of Sciences and Faculty of Medicine (Universitas Padjadjaran), Indonesia.
Shelly Iskandar was with Faculty of Medicine, Universitas Padjadjaran, Bandung, Indonesia
Arjon Turnip, Dwi Esti K., and Taufik Hidayat are with Technical Implementation Unit for Instrumentation Development Indonesian Institute of Sciences, Bandung, Indonesia (Email: [email protected])
information on rhythmic activity with different bandwidth frequencies, namely: delta, theta, alpha, beta, and gamma with the form as shown in Fig 1.
The recording EEG signals normally contain physiological signals from various sources such as: blinking of the eyes, heartbeat, environmental movement of the body resulting in concentration changes, etc. [11-13]. The signals that are recorded alongside the brain signals are known as an artifact. The mixed brain signals and artifacts make interpretation and analysis of the EEG signals more difficult. Various methods attempts to remove the artifacts have been done [3-5, 8-13]. Leor Shoker's research [14] performed the removal of artifacts from the electroencephalogram using the BSS-SVM hybrid algorithm method and the result of Chan et al [15] about the removal of Artifacts on EEG signals using an adaptive filter method. The result of this research is that the used method can remove artifacts from EEG signals. However, the research on the removal of artifacts is still carried out the development of methods as conducted in this research activity. Based on its origins, artifacts can be divided into two types: Biological artifacts: this type is usually caused by an ocular activity called electrooculogram (EOG), an activity called electromyogram (EMG), and a heart activity called an electrocardiogram (ECG); External artifacts: this type is usually caused by environmental conditions related to factors such as: line-interference, leads, and electrodes conditions.
Fig 1. Rhythm of the brain wave is normally in four dominant types of frequency ranging from high to low frequency [6].
Artifact Removal with Independent Component
Analysis for 2D Brain Mapping of Drugs User
before and after Taking Methadone
Shelly Iskandar, Dwi Esti Kusumandari, and Arjon Turnip
Napoa is an acronym of narcotics, psychotropic and other addictive substances which are the types of drugs that can affect health and psychiatric disorders. The napoa in general are chemicals that when put into the body either orally (drunk, inhaled, inhaled and aspirated) or injected, can affect one's thoughts, moods, feelings, and behaviors. This can lead to social disturbances marked by a negative indication, long usage time and excessive usage. Drug Abuse is the use of medicines for their own without medical indication, without instructions or prescription, either regularly or periodically for at least one month. The drug abuse tends to make the body's tolerance change, namely the desire and tendency to increase the dose of drugs to get the same efficacy after repeated use. Beside that causes the drug, withdrawal syndrome will appear when the use is stopped. To overcome narcotics dependence in adult patients, doctors usually give certain drugs with certain dose at the start of use.
Methadone is a type of drug belonging to the opium analgesic class. This drug is used as a substitute for narcotic drugs that cause addiction. The performance of the drug is to prevent the symptoms of drug withdrawal due to stop consuming narcotics. In addition to withdrawal symptoms, the methadone can be used as a pain reliever. However, only for severe and prolonged pain when other potent analgesic drugs do not match. The use of the methadone should only be prescribed and recommended by a physician. The dose of the methadone will be decided by the physician based on several considerations that include the type of disease, age, and health condition of the patient. If the drug withdrawal symptoms do not go away or recur, the doctor will increase the dose of the drug. When the patient's condition is stable, the dose will be gradually reduced. While to deal with severe pain, the dose of methadone will be raised with a higher frequency. Rules of dose change and frequency of methadone drugs have been done only using medical team observations of drug patients. In this study, the development of an instrument to observe the effects of psiological changes on brain signals (which are suppressed with EEG devices) is being proposed. The results of the EEG data processing on experiments on 8 subject showed that differences in characteristics of brain signals users at the time withdrawal and after administration of drugs methadone seen significant.
II. EXPERIMENTS
All subject in this experiment is untrained personal, male sex of 8 different subject with age range 20-40 years. This experiment was conducted at Hasan Sadikin Hospital Bandung for 3 days. The eleltro-cap of the EEG devices equipped with sensor electrode mounted on the head with a 'steady' and comfortable with the position follow the rules of the international system (system 10-20) [16]. Prior to installing the EEG system, the sensor surface is coated with a special electrolyte liquid to improve the conductivity of the electrode because the electrode is coated with an insulating material. In this experiment, it is designed to actively stimulate visual activity so that 19 electrode canals are installed in the frontal,
temporal, auricular and occipital areas. In the stimulus design, the EEG signal sampling and the experimental procedures include the function of timing movement, signal recording function, the appearance of the stimulus are required. The stimulus in this experiment is designed to focus on performing simple activities with the created scenario. In the experiment, the designed stimulus that is in the form of visual stimulus can be seen in Fig 2.
Fig. 2 Flashed similar stimuli with (e) as a target [12]
MATLAB with the EEGLab tool is a programming language with interactive features: numerical computation, visualization, and programming, making it easier for users to analysis data, develop algorithms, and design systems models that match the experiments. In this research, the EEG amplifier Mitsar 202 32 channel (band frequency 0-150 Hz, 2000 Hz sampling rate, input range 300 mV, Noise <1.5 μV peak-to-peak) is used for signal acquisition. The electro-cap (facilitates the placement of EEG electrodes) consists of a number of tin electrodes connected to the amplifier through the adapter. Electric-Gel serves to increase electrical contact between the electrodes and the scalp. The electric-gel is injected into each used channel on electro-cap such that between the scalp and electrodes connected and the brain signals is well recorded.
III. FEATURE EXTRACTION AND CLASSIFICATION
ISSN: 1942-9703 / CC BY-NC-ND features of EEG signal data. The ICA analysis method is used
to separate the EEG signal from the estimation of the overlapping artifact projection in the EEG electrode placed on the scalp with assumption that the statistical source signal is independent. The ICA retains brain activity more than other correction techniques (such as Principle Component Analysis), and is able to separate simultaneous EEG artifacts without the need for reference channels [18]. The ICA is based on three assumptions as follows: (i) Experimental data is a special mixture of stable activity of independent source and artifacts, (ii) Superposition of potential arising from different parts of the brain, scalp, and linear body on the electrode and propagation delay from the source to the electrode is negligible, (iii) The number of sources is not greater than the electrode [4, 19]. The EEG data is assumed to correspond to the model given in the following equation:
x(t) = As(t) v(t) (1)
where x(t) = [x1(t), x2(t), …, xm(t)]T is a linear mixture of source N s(t) = [s1(t), s2(t), …., sN(t)]T, A is a mixture of matrices with MxN size, and v(t) = [v1(t), v2(t), …., vM(t)]T is an additional noise on the EEG sensor [19]. X, s and v denote each vector of signal source, observed signal and noise at discrete time t.
Separation is done by removing the M x N matrix. The BSS can be adapted by adjusting the weight W matrix (called matrix separation), from neural networks using a particular algorithm learning using only x(t) information to construct the original signal source (or independent component) as the network output u(t) = Wx(t), consists of the source [u1(t), u2(t), …., uM(t)]T As independent. U is an estimate of s with
independent components and W is an estimate of A-1 [19]. For EEG analysis, the row of the matrix input, x(t), is the recording of the EEG signal on different electrodes and the column is the measurement record at different time points. The line from the matrix data output u(t) = Wx(t) is the time courses of ICA or source components. Invers, W-1, referred to as a mixed matrix, provides a special distribution of each component on each scalp electrode. EEG is free of artifacts by constructing EEG by selecting an ICA component of non- artifactual:
𝑥𝑥0 = 𝑊𝑊−1𝑢𝑢0 (2) Where 𝑢𝑢0is formed from replacing the artifact component of u with vector zero. The ICA focus method separates the signal artifacts. The representation of the mixing and separation process is changed x(t) = A(t)*s(t)+v(t) and u(t) = W(t)*x(t), where '*' indicates convolution operation .
IV. RESULTS AND DISCUSSION
Raw data is the result of recording of EEG signals that have been plotted from several channels used during data recording process. In the experiment there were 19 channels used, but in the raw data plot we selected 8 of the most dominant channels (F7, F3, FZ, F4, F8, P3, PZ, P8) in relation to the use of the
drugs that affected the location of the brain. Here is a picture of the Raw data Plot of EEG Signal from subject 2 with a similar_pre stimulus (the recorded signal before taking methadone) and Similar_post (the recorded signal one hour after taking methadone), can be seen in Fig. 3 below. Visually even without signal processing, the difference between before and after consuming methadone is significantly seen. In the Fig. 3(a) there is a greater amplitude with a more fluctuating baseline. This shows that the drug methadone significantly changes brain function. But to improve quality and minimize the influence of interference, especially for brain mapping, signal processing is still done.
(a) (b)
Fig 3. Raw data EEG Signals (a) Similar_Pre and (b) Similar_Post of the subject 2.
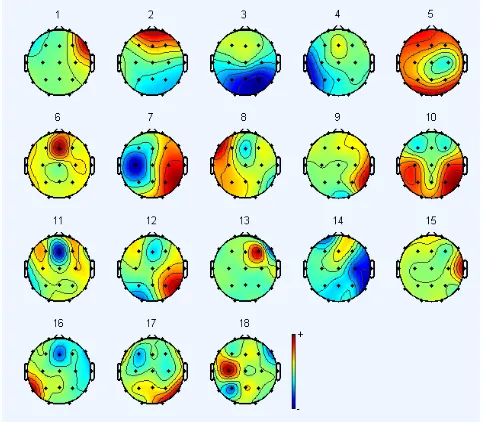
After filtering, the mixed EEG signal is extracted with ICA method. The ICA algorithm separates signals from mixed matrix information into signals with non-mixed matrix information or commonly called single components. In this study the ICA feature extraction results are presented in 2D Brain mapping form, from which the mapping will be seen in the more dominant part of the brain or the more focused part when the subject is displayed with a stimulus in a specified time. The ICA brain mapping results is shown in the Fig 4.
Fig 4. 2D brain Mapping
into 18 ICA. This is because the reference channel used is Cz, therefore the ICA result will decrease by 1 because the Cz channel is not visible. The results of 2D brain mapping are interpreted as follows: Blue, light blue, green, yellow, red, and chocolate show the effect of delta, theta, alpha, bheta1, bheta2, and gamma wave effects, respectively. If the color of the mapping is red, it means the betha2 wave activity that occurs on the channel is more dominant than the other, while if the color is getting black such as chocolate, it means gamma wave effects on the brain is more dominant. To determine the activity, use the range by using the color to make it easier to read the results of the mapping. Then from both the stimulus can be seen in the mapping result, not all channels that work or dominant, only a few channels that dominantly works.
For epoch time, the signals is used about 650 ms for viewing the mapping and it can make easier to see the most dominant brain activity during the specified epoch time. By means that the activity is differ from each other on the same channel depending on the time when the brain is more dominant. Then the mapping results show the activity of the brain with different times based on the time of the stimulus. Basically the ICA in WINEEG has the same pattern with the ICA method in EEGLAB, only different in the mapping display pattern. In the EEGLAB mapping is displayed from all channels so it can be viewed from 18 channels of which the activity is more dominant, whereas in the WINEEG only use 4 which most dominant channel, that is channel T6, FP2, F7, PZ for Stimulus Similar_Post with scale scale 15μV and channel T6, T5, FP1, F8 for Different_Post with a scale scale of 12 μV. Then from the four channels, the most dominant brain activity based on the time already specified. Furthermore, the difference of the stimulus before the subject is taking methadone or commonly called withdrawn with after taking the methadone can be seen in Fig 5(a) for Pre and Post taking the methadone. The top and bottom of Fig. 5 shows the brain mapping of subjects 3 and 4, respectively.
Fig. 5 Brain Maping from the extracted signals with ICA (a) Similar_Pre, (b) Similiar_post.
For the same stimulus, the increase in brain activity through beta waves and gamma is seen in part (b), which is after consuming methadone. This increase is thought to be due to the increased concentration ability of the related subject. The effect of methadone causes the brain function to return to normal until a certain time. when the effect of the drug on methadone disappears, brain function will return to its original state as shown in figure 5(a).
V. CONCLUSIONS
The ICA method in this study is used as a method of removing artifacts from EEG signals and also to separate EEG signals mixed with other signals. The EEGLAB mapping is done with 18 channels which will make it easier to see the activity on which part is the most dominant.
REFERENCES
[1] Carr J.J. and Brown. J.M. 2000. Introductions to Biomedical
Equipment Technology edition, Prentice Hall. USA
[2] Wolpaw JR et al. 2000b Brain-computer interface technology: A
review of the first international meeting IEEE Trans. Rehabil. Eng.
8(2) 164-173.
[3] Turnip, A,. Kusumandari, DE,. Amri, MF,. Simbolon, AI,. Suhendra, MA,. Iskandar, I,. Wirakusumah, FF., 2017 Detection of Drug Effects on Brain Activity using EEG-P300 with Similar Stimuli IOP Conference Series: Materials Science and Engineering.
[4] Turnip, A., Hong, KS,. Jeong, MY., 2011 Real-time feature extraction of P300 component using adaptive nonlinear principal component analysis BioMedical Engineering OnLine10(3). [5] Turnip, A., Hong, KS., 2012 Classifying mental activities from
EEG-P300 signals using adaptive neural network Int. J. Innov. Comp. Inf. Control8(7).
[6] Sanei, S., Chambers,.J.A., 2007. EEG Signal Processing, John
Wiley and Sons, Ltd. UK.
[7] Geetha, G., Geethalakshmi,.S.N., 2012. Artifacts Removal from EEG using Spatially Constrained Independent Component Analysis and Wavelet Denoising with Otsu's Thresholding Techniques. Procedia Engineering30: 1064-1071
[8] Turnip, A., Hutagalung, SS., Pardede, J., Soetraprawata, D., 2013 P300 detection using multilayer neural networks based adaptive feature extraction method. International Journal of Brain and
Cognitive Sciences2(5) 63-75.
[9] Turnip, A., Siahaan, M., 2014. Adaptive Principal Component Analysis based Recursive Least Squares for Artifact Removal of EEG Signals. Advanced Science Letters20 (10-12) 2034-2037(4) . [10] Turnip, A., Kusumandari, DE., 2014 Improvement of BCI
performance through nonlinear independent component analisis extraction. Journal of Computer9(3) 688-695.
[11] Turnip, A., Haryadi, Soetraprawata., D, Kusumandari, DE., 2014 A Comparison of Extraction Techniques for the rapid EEG-P300 Signals. Advanced Science Letters, 20(1) 80-85(6).
[12] Turnip, A., Simbolon,. AI., Amri, MF., Setiadi, RH., Mulyana, E., 2017 Backpropagation Neural Networks Training for EEG -SSVEP Classification of Emotion Recognition. Internetworking
Indonesian Journal9(1) 53-57.
[13] Turnip, A,. Amri, MF., Suhendra, MA., Kusumandari, DE., 2017 Lie Detection Based EEG-P300 Signal Classified by ANFIS Method. Journal of Telecommunication Electronic and Computer
Engineering9(1-5) 107-110.
[14] Liang X He X Salmeron BJ Gu H Stein EA Yang Y 2015 Interactions between the Salience and Default-Mode Networks Are Disrupted in Cocaine Addiction J Neurosci 35(21) 8081–8090. [15] Hu Y Salmeron BJ Gu H Stein AE Yang Y 2015 Impaired
ISSN: 1942-9703 / CC BY-NC-ND [16] Wisner KM Patzelt EH Lim KO MacDonald AW 2013 An
intrinsic connectivity network approach to insula-derived dysfunctions among cocaine users Am J Drug Alcohol Abuse 39(6) 403–413.
[17] Lebel C Warner Colby J et al 2013 White matter microstructure abnormalities and executive function in adolescents with prenatal cocaine exposure Psychiatry Res. 213(2) 161–168.
[18] Konova AB Moeller SJ Tomasi D Goldstein RZ 2015 Effects of chronic and acute stimulants on brain functional connectivity hubs Brain Res.
[19] Hyvärinen, Aapo; Karhunen, Juha; Oja, Erkki (2001). Independent component analysis (1st ed.). New York: John Wiley & Sons. ISBN 0-471-22131-7.
Shelly Iskandar acquired her medical degree at Medical Faculty, Universitas Padjadjaran in 2000 and her her master of science at Institute of Technology Bandung in 2006. She finished her specialization in acupuncture at Medical Faculty, Maranatha University in 2009. She worked as a lecturer in Anatomy department from 2001 to 2009 and from 2009 until now she is a staff member at Psychiatric Department, Medical Faculty, Padjadjaran University/ Hasan Sadikin Hospital, Bandung, Indonesia. She was introduced to the drug addiction field in 2003 when she was sent by National Narcotic Board and Health Research Unit Padjadjaran University to join “Drug Surveillance & Social Research” in Melbourne, Australia for 3 months. After that, as the implementation of the theory, she conducted multi center research about drug use & policy among senior high school students in 6 cities in Indonesia, supported by National Narcotics Board. Since then, she joined Health Research Unit in Medical Faculty, Universitas Padjadjaran and started her carrier in research. She also involved as co-trainer and trainer in house training in some cities in Indonesia, in collaboration with IASTP (Indonesian Australian Specialized Training Program), National Narcotics Board, Health Department, Social Department, Padjadjaran University, and Hasan Sadikin Hospital. Since 2006, when the first methadone clinic opened in Bandung, she worked there as a general practitioner until now. Start from March 2007, she joins in project named IMPACT (Integrated Management for Prevention And Care & Treatment of HIV/AIDS). In line with this project, she also proceeds to continue her PhD in combination with a resident training program in psychiatric department. In her spare time, she loves to join health social services with Tzu Chi International Medical Association (TIMA).
Dwi Esti Kusumandari received the B.Eng. and M.Eng. degrees in Engineering Physics from the Institute of Technology Bandung (ITB), Indonesia, in 1999 and 2005, respectively. He is currently work in the Technical Implementation Unit for Instrumentation Development, Indonesian Institute of Sciences, Indonesia as a research coordinator.
![Fig. 2 Flashed similar stimuli with (e) as a target [12]](https://thumb-us.123doks.com/thumbv2/123dok_us/8754463.1749556/2.612.331.541.158.355/fig-flashed-similar-stimuli-e-target.webp)