https://doi.org/10.5194/angeo-35-777-2017 © Author(s) 2017. This work is distributed under the Creative Commons Attribution 3.0 License.
Tracking patchy pulsating aurora through all-sky images
Eric Grono1, Eric Donovan1, and Kyle R. Murphy2 1University of Calgary, Calgary, Alberta, Canada
2NASA Goddard Space Flight Center, Greenbelt, Maryland, USA
Correspondence to:Eric Grono ([email protected])
Received: 20 December 2016 – Revised: 15 March 2017 – Accepted: 8 May 2017 – Published: 3 July 2017
Abstract. Pulsating aurora is frequently observed in the evening and morning sector auroral oval. While the precip-itating electrons span a wide range of energies, there is in-creasing evidence that the shape of pulsating auroral patches is controlled by structures in near-equatorial cold plasma; these patches appear to move with convection, for example. Given the tremendous and rapidly increasing amount of au-roral image data from which the velocity of these patches can be inferred, it is timely to develop and implement tech-niques for the automatic identification of pulsating auroral patch events in these data and for the automatic determina-tion of the velocity of individual patches from that data. As a first step towards this, we have implemented an automatic technique for determining patch velocities from sequences of images from the Time History of Events and Macroscale In-teractions during Substorms (THEMIS) all-sky imager (ASI) and applied it to many pulsating aurora events. Here we demonstrate the use of this technique and present the ini-tial results, including a comparison between ewograms (east– west keograms) and time series of patch position as deter-mined by the algorithm. We discuss the implications of this technique for remote sensing convection in the inner magne-tosphere.
Keywords. Magnetospheric physics (auroral phenomena)
1 Introduction
Diffuse aurora is the product of the pitch-angle scattering of magnetically bounce-trapped electrons and protons through wave–particle interactions (Davidson, 1990). While the most common and widely known aurora is the auroral arc, the dif-fuse aurora is perhaps more ubiquitous, and its most common type is pulsating aurora. Pulsating aurora is characterized by
quasi-periodic variations in intensity and precipitating elec-trons with energies on the order of a few keV to several tens of keV (Johnstone, 1978). This type of aurora is most com-monly seen in the morning sector auroral oval and persists for 1.5 h on average (Jones et al., 2011) but has been observed to last upwards of 15 h (Jones et al., 2013). Pulsating aurora of-ten, but not exclusively, has an irregular patchy structure, an example of which can be seen in Fig. 1. The lifetime and size of patches is known to vary substantially, ranging from a few seconds to tens of minutes for the former and 10–200 km across for the latter (Royrvik and Davis, 1977).
Information about the nature of certain magnetospheric processes is reflected in the structure and evolution of the aurora they produce. For this reason, the auroral oval is of-ten thought of as a screen onto which these processes project their dynamics, offering the opportunity to remotely sense activity in the magnetosphere through auroral observations, including magnetospheric convection.
Magnetospheric convection is the dominant mechanism of bulk plasma transport and circulation within the mag-netosphere; it is driven by the coupling between the solar wind and Earth’s magnetosphere (Axford, 1969; Angelopou-los et al., 1994). This bulk motion, also referred to simply as
convection, is at its most basic level the result ofE×B par-ticle drift (Northrop, 1963) in the magnetosphere and iono-sphere. It is often assumed that magnetospheric convection maps to the ionosphere due to magnetic field lines being treated as equipotentials under many circumstances. Poten-tial drops parallel to the magnetic field will violate this as-sumption and introduce uncertainty into the mapping.
778 E. Grono et al.: Tracking pulsating aurora
ionospheric electron density, the motion of which is directly related to convection in the ionosphere. Meanwhile, incoher-ent scatter radars such as the Resolute Bay Incoherincoher-ent Scatter Radar (RISR) (Doupnik et al., 1972) observe plasma motion through the detection of Thomson radiation. In situ measure-ments of ionospheric convection have been obtained from low-altitude satellites like the Defense Meteorological Satel-lite Program (DMSP) (Greenspan et al., 1986) and the Fast Auroral Snapshot Explorer (FAST) (Carlson, 1992). Higher-altitude spacecraft, including Cluster (Gustafsson et al., 1997) and the Time History of Events and Macroscale Inter-actions during Substorms (THEMIS) satellites (Angelopou-los, 2008), have measured magnetospheric convection. How-ever, there are complications with all of these techniques. Su-perDARN benefits from extensive coverage, but as with all global observing systems, this comes at the expense of spa-tial and temporal resolution. Incoherent scatter radars have the opposite issue; they offer precise measurements but with a limited field of view (FoV). Satellites provide measure-ments of convection with high spatio-temporal resolution along their trajectories, but ultimately they are limited by their inability to separate variations in space and time. Con-vection is a challenging phenomenon to observe and addi-tional techniques would be valuable.
There is increasing evidence that pulsating auroral patches are controlled by structures in the near-equatorial cold plasma (Rae, 2014). Since the motion of cold plasma is al-most entirely determined by E×B drifting, these patches appear to move with ionospheric convection and could be used to create two-dimensional maps of convection (Yang et al., 2015). To create such maps, it is necessary to track large numbers of pulsating auroral patches. Past studies have tracked aurora by hand (e.g. Yang et al., 2015; Shiokawa et al., 2010), but there have been few attempts to apply an automatic algorithm. Blixt et al. (2006) developed a method using optical flow analysis that extracts object motion from sequences of images by assuming that variations in bright-ness are solely related to object motion. For pulsating aurora, this is a significant limitation due to their prominent pulsa-tions and constantly evolving shape (Shiokawa et al., 2010). This study details a new method of routinely and quantita-tively tracking auroral forms, focusing particularly on pul-sating auroral patches. The technique provides information about persistent structures, including their geographic loca-tion and lifespan, located in sequences of all-sky images.
2 Dataset
The images of pulsating aurora processed for this paper were captured by the THEMIS all-sky imager (ASI) array (Dono-van et al., 2006; Mende et al., 2008), the ground-based com-ponent of the NASA mission (Angelopoulos, 2008) designed to answer key questions about the aurora and substorms. Currently, the network consists of 21 ASIs stationed across
northern North America, each capturing panchromatic, or “white light,” images of the aurora on a 256×256-pixel CCD with a 3 s cadence. These instruments have been oper-ating for over 10 years and have amassed tens of millions of images; on the order of 10 % contain pulsating aurora, which creates the ideal dataset for this study.
The rough estimate that 10 % of THEMIS images contain pulsating aurora can be calculated from the results of Jones et al. (2011), which state that up to 60 % of the images from the Gillam ASI contain pulsating aurora. Reducing this esti-mate by half to account for morning hours constituting half of the total operating hours of the camera and by half again to reflect cloud cover that is present approximately half of the time brings the estimate to 15 %. In addition, more poleward stations see pulsating aurora less frequently, thus decreasing the average to the order of 10 %.
The patches featured in this paper were imaged by the THEMIS ASIs located at Fort Smith, Sanikiluaq, and White-horse, Canada. Raw THEMIS images were used as inputs to the algorithm with data numbers cropped to 200 above the minimum value in the sequence being tracked and a maxi-mum of 9000; these thresholds were determined through trial and error. The THEMIS ASI images and necessary programs for replicating this study are provided via Grono (2017).
3 Tracking algorithm
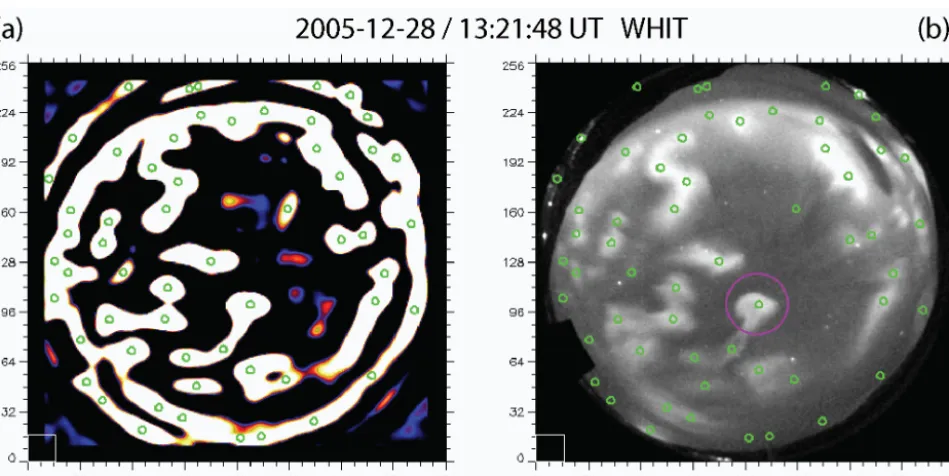
The tracking algorithm applied in this study is based on the work of Crocker and Grier (1996). Sequences of im-ages are pre-processed through the application of a wavelet filter which convolves the images with a Gaussian surface. This operation transforms structures within the bandpass into Gaussian-like “blobs” and removes noise with a size outside of the bandpass, thus allowing auroral forms within the FoV of an ASI to be more easily identified by the tracking algo-rithm. The Crocker and Grier (1996) algorithm locates the peak intensity of each blob inx–ypixel coordinates by iden-tifying the regional maxima which are within the upper 30th percentile of brightness across the entire image. This location is then refined to more accurately reflect the geometric centre of the structure by calculating the offset between the bright-est pixel and the brightness-weighted centroid of neighbour-ing pixels.
clas-Figure 1.A comparison of the output of the wavelet filter(a)to the original ASI image(b)in which blob locations are identified with green circles. The axes are inx–ypixel coordinates and the large purple circle identifies the patch that is the subject of Fig. 2a.
sified as the same structure. If a blob is not found in the next image – if it became too dim, for example – the algorithm keeps it in memory for a number of frames before declar-ing it to have permanently disappeared. This is an important feature for tracking pulsating aurora since without it the al-gorithm would tend to reidentify a patch as a new structure each time it leaves a dim state.
A number of algorithm parameters can be tuned, includ-ing the feature size that the filter enhances, the number of frames for which a blob can disappear or pixels it can travel before being identified as a different structure, and the mini-mum blob brightness and size. For the purposes of this study, the wavelet filter was set to enhance structures 11 pixels in diameter, remove noise on the order of 3 pixels, and per-form median smoothing in a neighbourhood 5 pixels wide. The maximum distance blobs were permitted to travel be-tween images was 10 pixels, in effect setting an upper limit to the patch velocities the algorithm could detect. For purely north–south motion relative to the FoV of the ASI, the limit was approximately 1700 m s−1, while the limit for east–west motion was approximately 3700 m s−1. Blobs were allowed to disappear for no more than five consecutive images; at the imaging cadence of the ASIs, this corresponds to 18 s, which is longer than the typical pulsation period of pulsating au-rora. Figure 1 illustrates the effect of the filter as well as how blobs are identified. The minimum peak brightness of blobs was set to four; this number reflects the brightness of the byte-scaled image, not the raw ASI data. The minimum blob size is defined by the area under the blob and referred to as “mass”, the minimum of which was set to 20 000 and is a
reflection of the overall brightness of a feature. This param-eter provides a threshold that helps to remove dim features in the camera which were not removed by the initial wavelet filtering. A final parameter informs the algorithm of the ap-proximate diameter of the features of interest; this size was set to 17 pixels and provides an estimate of the typical size of pulsating auroral features observed by the cameras.
4 Results
[image:3.612.66.541.65.303.2]780 E. Grono et al.: Tracking pulsating aurora
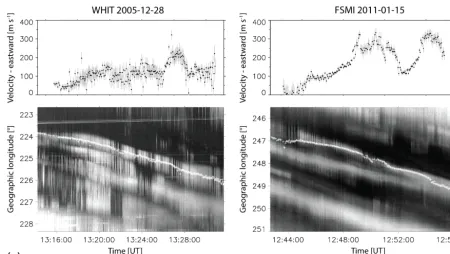
Figure 2.Smoothed longitudinal patch velocities (top) calculated from the locations over-plotted onto the bottom figures as white markers. The grey bars represent an estimated error in the speed, which was calculated by finding the standard error of the 30 values that went into the smoothed data point. Ewograms (bottom) comparing the actual patch motion to the result of the tracking algorithm, which is represented as white markers.
but reacquire it later; these instances are identified by gaps in the over-plotted markers.
The velocities shown in the top plots were calculated from the tracked auroral patches. To find the distance the patches travelled between any two frames, they were assumed to be at an altitude of 110 km and travelling at constant latitudes equal to the midpoint between the patches’ true latitudes at subsequent time points. The time between frames was gen-erally the 3 s resolution of the ASI, but it could be as high as 18 s if the patch was not identified by the algorithm for a maximum of five frames. Smoothing was necessary due to the presence of substantial jitter in the calculated patch loca-tions. The smoothing technique utilized was a 30-data-point-wide moving boxcar average for which the uncertainties were estimated as the standard error of the speeds used to calculate the mean.
Moving beyond examples of isolated events, Figs. 3 and 4 depict examples of multiple distinct pulsating auroral patches being tracked simultaneously within the FoV of an ASI. The former includes ewograms of three patches as well as a time series comparing the longitudinal component of their veloc-ities. The latter figure considers velocity time series of three separate periods that include six or seven patches each; in-stead of ewograms, it includes ASI images containing mark-ers denoting the locations of the majority of the patches. In both of the top two rows, a single patch is not marked in the ASI image since the lifetimes of the patches do not entirely
overlap. Error bars are not shown in either of these two fig-ures to avoid cluttering the images.
5 Discussion
The results produced by this algorithm suggest that it can be well suited to tracking pulsating aurora. Given the correct parameters, it is capable of automatically tracking all patches within a sequence of images despite the pulsations character-istic of this type of aurora. In addition, patch speeds are low enough and the time resolution of THEMIS is high enough that the algorithm is generally able to accurately follow blobs between images.
Figure 3.Time series (top image) of longitudinal velocity for three distinct, simultaneous patches that occurred between approximately 12:30 and 12:50 UT on 15 January 2011 at Fort Smith. Ewograms of the three patches (bottom three images).
ewogram and the white markers in Fig. 2b suggests that the tracking algorithm did a poor job, the reality is that the varia-tions in speed arose from the evolving shape. These types of patches are poorly suited for observing convection.
[image:5.612.50.286.63.577.2]Conversely, the patch shown in Fig. 2a demonstrates that the algorithm is capable of accurately extracting the veloc-ity of a patch from ASI images. Relative to the patch in Fig. 2b, that in Fig. 2a evolves quite slowly. A challenge to be overcome before pulsating aurora can be reliably used to ob-serve convection is to separate slowly from rapidly evolving patches.
Moreover, it is possible for structure shapes to change so rapidly that they are quickly identified as a new blob; in fact, this is the most frequent outcome. As seen in Fig. 5, the most common length of time for a patch to be tracked was less than 20 frames. However, if the tracks of these short-lived patches are smooth enough, the data for these events have value in statistical studies as velocities can still be extracted from a nominally single patch which the algorithm may sep-arate over time into two patches. In such a case, more than a single velocity would be calculated for a patch, but since it continually moves with the background convection speed, these velocities could still be used to observe ionospheric convection.
Regardless of how constant the shape of a patch remains, its pulsations introduce jitter into the output of the algorithm. Even minor variations in shape and brightness produce in-consistent results from the wavelet filter, creating fluctuations in the location of the blob peaks. In well-tracked patches, smoothing allows for velocities to be extracted which are comparable to what would be calculated by hand. Compli-cating matters further is that the elevation of a patch within the FoV of an ASI influences the quality of the track pro-duced. This is due to the proportional relationship between the spatial resolution of the ASIs and the elevation within the images they produce; pixels at lower elevations capture aurora farther away than what is observed at zenith. Conse-quently, patches at lower elevations can exhibit unusual be-haviour in one of two ways. A patch can either experience an extreme version of the jitter issue or have the opposite problem and not be observed to move whatsoever; both re-sult from the large distances between pixel centres. Another issue with the output of the tracking algorithm at low ele-vations is that the wavelet filter always creates blobs along the edge of the FoV. These blobs have a consistent shape and can become the longest-tracked structures output by the algo-rithm. This issue arises because the night sky is brighter than the black pixels outside the FoV, and the filter enhances the edge of the FoV like it does to any of the auroral structures. This effect can be seen in Fig. 1. Fortunately, issues related to elevation can be resolved by restricting the patches studied to elevations greater than a threshold of approximately 50◦.
782 E. Grono et al.: Tracking pulsating aurora
Figure 4.Three time series (right) of longitudinal velocity for distinct, simultaneously tracked patches. Locations of the tracked patches (left) within the FoV of the ASI at an instant in time. In the top two rows, one event is missing from the ASI image due to the patches not being entirely simultaneous.
Figure 5.Histogram of patch lifetimes measured by the number of frames they appeared in for the 13:00 UT hour of THEMIS Whitehorse ASI on 28 December 2005. The bins are 20 frames wide.
Patches coincident in time and nearby in space will not move with identical velocities, but it is often reasonable to assume that their motion will be similar. On average,
[image:6.612.99.496.498.622.2]vari-ations. Figures 3 and 4 demonstrate that the algorithm cal-culates patch velocities consistent with these expectations. On larger timescales, the velocities exhibit similar behaviour even though they may differ substantially at any particular moment.
6 Future work
The accurate tracking of the patches featured in Figs. 2a, 3, and 4 promotes optimism that this algorithm will be suc-cessful if its complications can be mitigated or altogether avoided. Methods of improving the overall quality of the patch tracks that may warrant further exploration include ag-gressively limiting the results to higher elevations in the FoV of the ASIs, ignoring patches that were identified in too few frames for the data to be reasonably smoothed, and adjust-ing the input parameters of the bandpass filter to produce blobs which may be less sensitive to subtle changes in patch shape and brightness. Possibilities that have not yet been in-vestigated include alternate filtering techniques and exclud-ing patches with shapes that change too quickly based on the properties of their velocity time series. Instruments with improved spatial and temporal resolution would improve the tracks produced by this technique, chiefly by increasing the usefulness of tracks at lower elevations in the ASI FoV and decreasing the distance a patch is allowed to move between successive images. However, certain key areas would not benefit from this, including the jitter introduced by evolving patch structures and dim patches that can be temporarily lost by the algorithm.
Early results of patch filtration suggest that pulsating au-rora can be separated into at least two distinct categories: one characterized by well-defined structures that follow convec-tion and another more dynamic type with a moconvec-tion that is difficult to ascertain and may be unrelated to structuring in cold equatorial plasma. This work is an initial step toward the ultimate goal of the automatic identification and track-ing of the first type of pulsattrack-ing aurora such that accurate maps of convection can be produced. Increasing the number of techniques available to observe and create maps of con-vection is beneficial to the community because it is a critical aspect of geospace dynamics which is difficult to observe. The coverage of the THEMIS ASI array is extensive. Un-der ideal meteorological and geomagnetic conditions, such as those described in Jones et al. (2013), it would be pos-sible to produce a map of convection covering the majority of Canada and Alaska. Pulsating auroral patches arise from wave–particle interactions with cold plasma located in the region of the magnetosphere where magnetic field lines tran-sition from tail-like to dipolar. When the next-generation au-roral imaging network Transition Region Explorer (TREx) is deployed over the next few years, the combined data will of-fer an unprecedented view of this part of the magnetosphere.
Data availability. The dataset and necessary IDL programs for replicating this analysis are available from Grono (2017). Further questions can be directed to the corresponding author.
Author contributions. EG designed and analysed the work and wrote the paper. ED is his supervisor and assisted with analysis. KRM provided the initial set of programmes for the work.
Competing interests. The authors declare that they have no conflict of interest.
Acknowledgements. This research was supported by grants from the Natural Science and Engineering Research Council (NSERC) of Canada, the Canadian Space Agency (CSA), and Danish Technical University (DTU). Thanks to Emma Spanswick for assistance with data from NASA’s Time History of Events and Macroscale Interac-tions during Substorms (THEMIS) all-sky imager (ASI). Thanks to Stephen Mende for the provision of THEMIS ASI data.
The topical editor, Yoshizumi Miyoshi, thanks two anonymous referees for help in evaluating this paper.
References
Angelopoulos, V.: The THEMIS Mission, Space Sci. Rev., 141, 5– 34, https://doi.org/10.1007/s11214-008-9336-1, 2008.
Angelopoulos, V., Kennel, C. F., Coroniti, F. V., Pellat, R., Kivel-son, M. G., Walker, R. J., Russell, C. T., Baumjohann, W., Feldman, W. C., and Gosling, J. T.: Statistical characteris-tics of bursty bulk flow events, J. Geophys. Res., 99, 21257, https://doi.org/10.1029/94JA01263, 1994.
Axford, W. I.: Magnetospheric convection, Rev. Geophys., 7, 421– 459, https://doi.org/10.1029/RG007i001p00421, 1969.
Blixt, E. M., Semeter, J., and Ivchenko, N.: Optical Flow Analysis of the Aurora Borealis, IEEE Geosci. Remote Sens. Lett., 3, 159– 163, https://doi.org/10.1109/LGRS.2005.860981, 2006. Carlson, C. W.: The fast auroral snapshot explorer, EOS
Transac-tions, 73, 249–256, https://doi.org/10.1029/91EO00202, 1992. Crocker, J. C. and Grier, D. G.: Methods of Digital Video
Mi-croscopy for Colloidal Studies, J. Colloid Interf. Sci., 179, 298– 310, https://doi.org/10.1006/jcis.1996.0217, 1996.
Davidson, G. T.: Pitch-angle diffusion and the origin of temporal and spatial structures in morningside aurorae, Space Sci. Rev., 53, 45–82, https://doi.org/10.1007/BF00217428, 1990.
Donovan, E., Mende, S., Jackel, B., Frey, H., Syrjäsuo, M., Voronkov, I., Trondsen, T., Peticolas, L., Angelopoulos, V., Harris, S., Greffen, M., and Connors, M.: The THEMIS all-sky imaging array – system design and initial results from the prototype imager, J. Atmos. Sol.-Terr. Phy., 68, 1472–1487, https://doi.org/10.1016/j.jastp.2005.03.027, 2006.
Doupnik, J. R., Banks, P. M., Baron, M. J., Rino, C. L., and Petriceks, J.: Direct measurements of plasma drift velocities at high magnetic latitudes, J. Geophys. Res., 77, 4268–4271, https://doi.org/10.1029/JA077i022p04268, 1972.
Me-784 E. Grono et al.: Tracking pulsating aurora
teorological Satellite Program (DMSP) Spacecraft S8 Through S10, Tech. Rep. AFGL-TR-86-0227, Air Force Geophysics Lab-oratory, Hanscom AFB, Mass., 1986.
Greenwald, R. A., Weiss, W., Nielsen, E., and Thomson, N. R.: STARE - A new radar auroral backscatter experi-ment in northern Scandinavia, Radio Sci., 13, 1021–1039, https://doi.org/10.1029/RS013i006p01021, 1978.
Grono, E.: Replication Data for: Tracking patchy pulsating aurora through all-sky images, Scholars Portal Dataverse, https://doi.org/10.5683/SP/EBWDOB, 2017.
Gustafsson, G., Bostrom, R., Holback, B., Holmgren, G., Lund-gren, A., Stasiewicz, K., Ahlen, L., Mozer, F. S., Pankow, D., Harvey, P., Berg, P., Ulrich, R., Pedersen, A., Schmidt, R., Butler, A., Fransen, A. W. C., Klinge, D., Thomsen, M., Falthammar, C.-G., Lindqvist, P.-A., Christenson, S., Holtet, J., Lybekk, B., Sten, T. A., Tanskanen, P., Lappalainen, K., and Wygant, J.: The Electric Field and Wave Experi-ment for the Cluster Mission, Space Sci. Rev., 79, 137–156, https://doi.org/10.1023/A:1004975108657, 1997.
Johnstone, A. D.: Pulsating aurora, Nature, 274, 119–126, https://doi.org/10.1038/274119a0, 1978.
Jones, S. L., Lessard, M. R., Rychert, K., Spanswick, E., and Donovan, E.: Large-scale aspects and temporal evolu-tion of pulsating aurora, J. Geophys. Res., 116, A03214, https://doi.org/10.1029/2010JA015840, 2011.
Jones, S. L., Lessard, M. R., Rychert, K., Spanswick, E., Dono-van, E., and Jaynes, A. N.: Persistent, widespread pulsat-ing aurora: A case study, J. Geophys. Res., 118, 2998–3006, https://doi.org/10.1002/jgra.50301, 2013.
Mende, S. B., Harris, S. E., Frey, H. U., Angelopoulos, V., Rus-sell, C. T., Donovan, E., Jackel, B., Greffen, M., and Peticolas, L. M.: The THEMIS Array of Ground-based Observatories for the Study of Auroral Substorms, Space Sci. Rev., 141, 357–387, https://doi.org/10.1007/s11214-008-9380-x, 2008.
Northrop, T. G.: Adiabatic Charged-Particle Mo-tion, Rev. Geophys. Space Ge., 1, 283–304, https://doi.org/10.1029/RG001i003p00283, 1963.
Rae, K.: Patchy Pulsating Aurora and its Relationship to Cold Plasma in the Magnetospheric Equatorial Plane, Master’s thesis, University of Calgary, 2014.
Royrvik, O. and Davis, T. N.: Pulsating aurora – Local and global morphology, J. Geophys. Res., 82, 4720–4740, https://doi.org/10.1029/JA082i029p04720, 1977.
Shiokawa, K., Nakajima, A., Ieda, A., Sakaguchi, K., Nomura, R., Aslaksen, T., Greffen, M., and Donovan, E.: Rayleigh-Taylor type instability in auroral patches, J. Geophys. Res., 115, A02211, https://doi.org/10.1029/2009JA014273, 2010.