Structure modifications of AOT reverse micelles due to protein incorporation
Hadas Gochman-Hecht, Havazelet Bianco-Peled
∗Department of Chemical Engineering, Technion—Israel Institute of Technology, Haifa 32000, Israel Received 14 July 2005; accepted 11 October 2005
Available online 18 November 2005
Abstract
Structural modifications of AOT/water/isooctane reverse micelles due to incorporation of proteins were studied at various water contents and protein concentrations, using small-angle X-ray scattering (SAXS) experiments under static conditions, rheometry analysis, and SR-SAXS exper-iments under induced shear flow. Two proteins, lysozyme (pI 11.1,Mw14,300 Da) and BSA (pI 4.3,Mw66,700 Da), were chosen as models. SAXS analysis of protein-containing reverse micelles at low water content detected minima in the average micelle size versus protein concen-tration curve, for both proteins, below and above their isoelectric point. This minimum was attributed to changes in the size distribution of the reverse micelles. SAXS measurements of reverse micelles at high water content have shown them to have a cylindrical form. Incorporation of lysozyme at pH 7 into the cylindrical micelles induced a shape transition to spherical micelles, which was associated with a decreased viscosity. SR-SAXS measurements under induced shear flow and dynamic conditions revealed alignment of the cylindrical micelles in the flow direction. The anisotropy parameter, a measure of the degree of the spatial order, was found to increase with increasing shear rate and to decrease with increasing lysozyme concentration.
2005 Elsevier Inc. All rights reserved.
Keywords:AOT reversed micelles; Small-angle X-ray scattering; Lysozyme; BSA; Shear-induced alignment
1. Introduction
Reverse micelles are thermodynamically stable surfactant aggregates with a polar core, which are formed spontaneously when certain types of surfactants are dissolved in organic sol-vents. Water and host macromolecules can be solubilized in that core, protected from direct contact with the organic sol-vent; therefore their biological activity remains unharmed[1,2]. Due to this property there is growing interest in reverse micelles for future applications in biotechnological industry, such as se-lective extraction of proteins or enzymatic catalysis in organic media. Proteins can be selectively extracted by manipulating parameters such as surfactant concentration, salt concentration in the aqueous solution, water acidity, or water content. The wa-ter contentW0, expressed in terms of the ratio of water molar
concentration to surfactant molar concentration, is one of the
* Corresponding author. Fax: +972 4 8295672.
E-mail address:[email protected](H. Bianco-Peled).
important parameters in this system, as it determines the size of the water core and thus the size of the reverse micelles.
Several groups have investigated the process of protein in-corporation into reversed micelles in terms of the driving forces for protein solubilization, protein localization, and size or shape perturbations induced by the protein[3–15]. Additionally, the structure of the protein, which is crucial if an enzymatic re-action is to be carried out using reverse micellar system, has been examined. A strong relation between the activity of the incorporated protein and the reverse micelle size has been re-ported [16–18]. When the micelle size is comparable to the protein dimensions, its structure is more affected by the wa-ter content. Protein structure and activity in reverse micelles also depend on the protein localization. Proteins that are lo-cated in the water core tend to maintain their activity, while localization near the surfactant interface will often lead to lower activity[16]. As for the size of the micelles, the literature re-ports somewhat contradictory results. Pileni and co-workers suggested a model[5,9,14,15]according to which hydrophilic proteins such asα-chymotrypsin and ribonuclease tend to be located in the water core, avoiding contact with the surfactant
0021-9797/$ – see front matter 2005 Elsevier Inc. All rights reserved.
head groups. This localization causes an equivalent increase in the water core volume and therefore increased radii. On the other hand, proteins such as cytochrome c anchor to the surfac-tant molecules at the interface or near it, due to electrostatic or hydrophobic interactions with the surfactant. This localization leads to increased interfacial area and therefore decreases the water core radii[9]. An opposite observation was reported by Melo et al.[3,4], who observed swelling of reverse micelles due to incorporation of the protein cutinase that attaches to the mi-celle wall. This phenomenon was attributed to conformational changes and unfolding of the protein.
The current research focuses on structural modifications due to protein incorporation in water-containing reverse micelles formed by the anionic surfactant sodium bis-(2-ethylhexyl) sul-fosuccinate (AOT) in the organic solvent isooctane. One of our objectives was to evaluate whether the influence of the protein stability on the size of the reverse micelles, observed by Melo et al. [3,4] for cutinase, is a general phenomenon that could be observed with other proteins as well. Therefore two model proteins were chosen, lysozyme and bovine serum albumin (BSA), which differ in their stability in reverse mi-celle systems. Lysozyme changes its conformation markedly and denatures in the AOT/isooctane/H2O system at all water
contents[17,19], due to strong specific interaction with AOT molecules in the micellar interface. In contrast, BSA maintains its structure to a large extent during extraction with AOT re-verse micelles[20,21]. We were further interested in evaluating the influence of protein concentration, a parameter that has not been studied thoroughly before[18], on the micelle structure. As described in this paper, our results revealed an interesting and unexpected dependence of the micelle size on the protein concentration. Finally, we have characterized the micelle struc-ture under shear. In addition to scientific interest, this study has practical significance since industrial utilization of reverse mi-celle solutions, either as a solvent for liquid–liquid extraction of proteins or for enzymatic catalysis, must be performed under stirring conditions.
2. Materials and methods
2.1. Materials and solutions preparation
AOT (Fluka), isooctane (Carlo Erba or Scharlau), and lysozyme and BSA (Sigma) were used as received. Lysozyme and BSA aqueous solutions were prepared using Milli-Q wa-ter. If needed, water acidity was adjusted by adding NaOH or HCl 0.1 M solutions. For the preparation of reverse mi-celle solutions with incorporated proteins, measured volumes of water, lysozyme, or BSA aqueous solutions were injected into 100 mM solutions of AOT in isooctane using a Hamilton syringe. The injected volume was calculated for the water-containing reverse micelles to give a desired water content W0=W0,app= [H2O]/[AOT]. In each series of experiments
identical injected volumes were used, even though water was replaced with protein solution, in order to evaluate the influ-ence of the protein–micelle interactions.
2.2. Rheology
Rheology measurements were performed using a Rheomet-ric Scientific (ARES) strain-controlled shear rheometer fitted with a cup-and-bob (Couette) fixture covered with an anti-evaporation cover. Steady rate sweep measurements were per-formed in a shear rate range of 1–250 Hz. Calculations and processing of the results were performed using the RSI Orch-stator software package version 6.5.1.
2.3. Small angle X-ray scattering (SAXS)
SAXS measurements under static conditions were per-formed with CuKα radiation using a compact Kratky camera having a linear position-sensitive detector system (Raytech) with pulse-height discrimination and a multichannel analyzer (Nucleus). The entrance slit to the collimation block was 20 µm, and the slit length delimiters were set at 15 mm. The sample to detector distance was 26.4 cm. Reverse micelle solutions were placed in cylindrical quartz cells (A. Paar Co., 1 mm path length). The sample temperature was kept at 25◦C by means of a temperature controller (A. Paar). Primary beam intensities were determined using the moving slit method of Stabinger and Kratky[22]and subsequently using a thin quartz monitor as a secondary standard. The scattering curves, as a function of the scattering vectorq=4πsinθ/λ(where 2θ andλare the scat-tering angle and the wavelength, respectively), were corrected for counting time and for sample absorption. The background scattering (isooctane-filled capillary) was measured separately and subtracted from the scattering curve. The correction of the effect of the beam dimension (desmearing) was performed ac-cording to the indirect transformation method[23,24]using the program ITP. Data analysis was based on fitting the desmeared curve to an appropriate theoretical model using a least-squares procedure.
SAXS measurements under shear force were performed at the beam line ID02, European Synchrotron Radiation Facility, Grenoble, France. The wavelength of the incident photons was 1 Å, and the sample-to-detector distance was either 1 or 2 m. The measurements were performed using a two-dimensional multiwire proportional gas counter. The samples were studied in a polycarbonate coquette cell having a 1-mm annular gap be-tween the rotor (outer) and stator (inner) cylinders, mounted on motorized translation stages, which allowed the sample to be aligned in both the radial and tangential positions[25]. In the radial configuration the incident beam was perpendicular to the flow direction but parallel to the velocity gradient. In the tan-gential configuration the incident beam was parallel to the flow direction or the shear velocity. The raw data were corrected to account for the transmission of the 2-D detector response.
3. Modeling of the SAXS intensities
The scattered X-ray intensity,I (q), is expressed as[6,8,9]
(1) I (q)=npP¯s(h)S(h),
wherenpis the number of micelles per unit volume,P¯s(q)is the
average polydisperse form factor, which is related to the struc-ture of the reversed micelles (shape and size), andS(h)is the structure factor, which provides information on the structural arrangement of the reversed micelles (intermicellar interac-tions). In dilute solutions, the structure factor is approximately equal to unity, due to negligible interparticle interference.
At low water content, AOT reverse micelles are commonly described using a model of spherical “core and shell” aggre-gates [8]. This model describes an aggregate with an outer diameter of Rs, built from a core having a radius of Rc and
electron density of ρc, surrounded by a thin spherical shell of
surfactant molecules having an electron density ofρs. The form
factor for such an aggregate is given by
Ps(q)=
4π 3 R
3
s(ρs−ρm)Φ(qRs)
(2) +4π
3 R
3
c(ρc−ρs)Φ(qRc) 2
with
Φ(qRs)=3
sin(qRs)−qRscos(qRs)
(qRs)3
,
Φ(qRc)=3
sin(qRc)−qRccos(qRc)
(qRc)3
,
whereρmis the electron density of the medium.
The polydisperse form factor, P¯s(q), was obtained from
Ps(q) by assuming a Gaussian (normal) size distribution[9]
withσ as the root-mean-square deviation from the mean water core radiusR¯c, and then evaluated as
(3) ¯
Ps(q)=
1 √
2π σ2
Ps(q)exp
−(Rc− ¯Rc)2
2σ2
dRc.
In fitting Eqs.(1)–(3)to the experimental SAXS curves it was assumed that the shell has a constant thickness of 0.4 nm[6]. The electron densities of the shell, the water core, and the sol-vent were fixed as ρs =550 e−/nm3, ρc =334.6 e−/nm3,
andρm=240.8e−/nm3, respectively. The electron density of
aqueous protein solution was measured and found to be almost equal to that of water only; therefore the electron density of the water core was kept constant. Fit was obtained by varying the values ofR¯c,σ, andnp.
4. Results and discussion
The two proteins selected for this research differ greatly in size. BSA (MW 66 kDa, pI 4.9) is a bulky hydrophilic protein having radius of about 3.5 nm[20,21], while lysozyme (Mw
14 kDa, pI 11.1) has a much smaller radius of about 2 nm. To allow us to examine different scenarios, we chose to work at two water contents:W0=40, for which the average reverse micelle
size (4.9 nm[26]) is larger than both proteins, andW0=20,
[image:3.595.309.550.70.234.2]where the reverse micelles (2.5 nm) could be large enough to
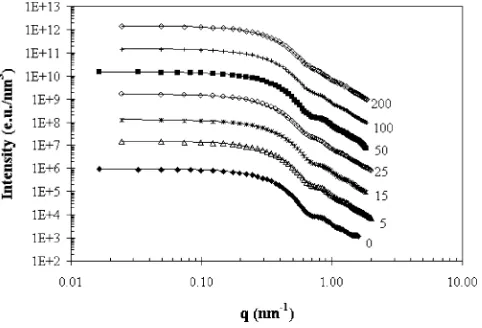
Fig. 1. Experimental scattering curves (symbols) for reverse micelles solu-tions prepared from 100 mM AOT solusolu-tions atW0=40, pH 7, and different
lysozyme concentrations (in µM) indicated next to the curves. Solid lines were calculated from Eqs.(1)–(3)using the best-fit parameters summarized in Ta-ble 1. Successive curves are displaced upwards by one logarithmic unit for better visualization.
Table 1
Summery of best-fit parameters for 100 mM AOT/H2O/isooctane solution, at W0=40, pH 7, and different concentrations of solubilized lysozyme Clys(µM) np(aggregates/nm3) σ(nm) R¯c(nm)
0 7.87×10⁻⁶ 1.18 4.9
5 1.51×10⁻⁵ 1.42 4.4
15 2.85×10⁻⁵ 1.72 3.7
25 2.49×10⁻⁵ 1.58 3.4
50 1.48×10⁻⁵ 1.57 4.2
100 1.67×10⁻⁵ 1.56 4.1
200 1.83×10⁻⁵ 1.71 3.8
Notes.Clys: concentration of solubilized lysozyme in reverse micelles solution; W0: molar ratio of water to surfactant;np: number of micelles per unit volume;
¯
Rc: mean radius of the water core; σ: root-mean-square deviation from the
mean water core radius.
accommodate the lysozyme but not the BSA. For each protein the experiments were conducted at two pH values: below the isoelectric point, where the positively charged protein strongly interacts with the AOT headgroups, and above the pI. It should be noted, thus, that while lysozyme does not interact with AOT above its isoelectric point[27], BSA produces weak interac-tions with the surfactant both below and above the pI[20].
Structural studies of AOT reverse micelles in the presence of the proteins were first performed using the Kratky camera under static conditions. The water content was kept constant at eitherW0=20 orW0=40 while the protein concentration
was varied. Experimental SAXS curves for various lysozyme concentrations (0–200 µM, obtained from injecting protein so-lutions having concentrations of 0–40 g/l) at W0=40 and
(a)
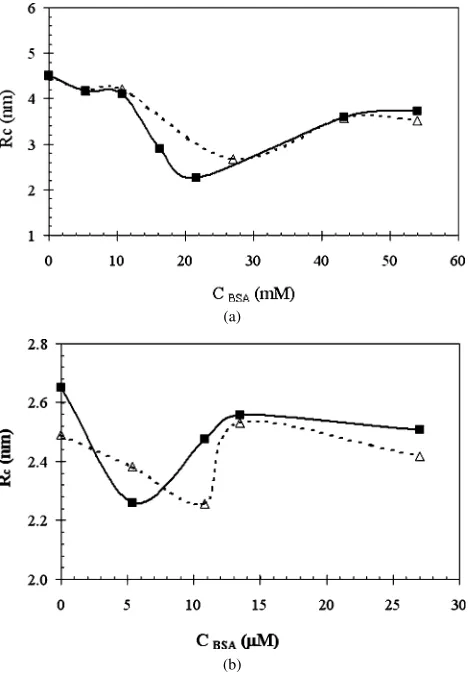
[image:4.595.44.290.67.409.2](b)
Fig. 2. Average water core radius vs lysozyme concentration at pH 7 (solid line) and pH 12 (dashed line). (a)W0=40; (b)W0=20.
The average core radiusR¯c is plotted in Fig. 2as a
func-tion of the solubilized lysozyme concentrafunc-tion. For the whole measured concentration range, the average size of the protein-containing micelles is smaller than the size of the empty ones. Yet a clear minimum is observed at pH 7 both for W0=40
(Fig. 2a) and forW0=20 (Fig. 2b). A minimum is still
ob-served, although it is less pronounced, at pH 12, which is above the isoelectric point of lysozyme (dashed line inFig. 2). Similar SAXS measurements and analysis were performed for BSA-containing AOT reverse micelles, and their results are summa-rized inFig. 3. As for the lysozyme, a minimum value ofR¯c
is revealed at water content ofW0=40 (Fig. 3a) andW0=20
(Fig. 3b), both below the pI (pH 3) and above it (pH 8). A previous work by Pileni and co-workers[12]did not de-tect minima in the graph describing the reverse micelle size vs cytochrome c concentration. Rather, the micelle size was found to decrease with an increase in the protein concentra-tion. A decrease in the average micelle size was also observed in other studies[16,17,19]in which a single protein concentra-tion was used. The decrease in the micelle size was attributed to the anchoring of the positively charged protein molecules to the surfactant headgroups, due to electrostatic interactions be-tween them. The protein was claimed to perform as a substitute for additional surfactant, causing the effective water content [H2O]/[AOT] to decrease and therefore the mean size of the
wa-(a)
(b)
Fig. 3. Average water core radius vs BSA concentration at pH 3 (solid line) and pH 8 (dashed line). (a)W0=40; (b)W0=20.
ter pool also to decrease [16,17,19]. The concentration range used in the work of Pileni and co-workers was narrower than the one used in the current study. Therefore, it is possible that a minima was not observed experimentally but it do exist. Still, the model suggested by Pileni and co-workers cannot explain the minima in theRcvs concentration curve. Moreover, since
this minimum appears both for positively charged proteins and for negatively charged ones, it is unlikely to attribute it to elec-trostatic interactions.
[image:4.595.320.555.69.408.2]Fig. 4. Size distributions for reverse micelle solutions prepared from 100 mM AOT solutions atW0=40, pH 7, and different lysozyme concentrations (in
µM) indicated next to the curves.
(a)
(b)
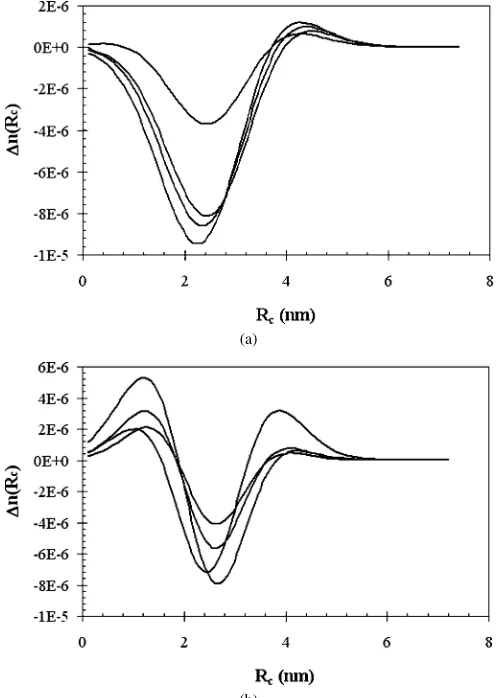
Fig. 5. Differential size distributions for protein-containing reverse micelles at
W0=40: (a) lysozyme (b) BSA.
of the “empty” micelles (Fig. 4). In particular, it seems that the fraction of smaller micelles is larger in the presence of the pro-tein. In an attempt to quantify these changes, we have calculated a differential size distribution n(Rc), defined as the
differ-ence between the number of micelles in the presdiffer-ence and in the
(a)
[image:5.595.302.550.70.419.2](b)
Fig. 6. Differential size distributions for protein-containing reverse micelles at
W0=20: (a) lysozyme (b) BSA.
absence of protein. Several representative differential size dis-tributions are shown inFigs. 5 and 6. ForW0=40, two clear
positive peaks are seen, one around 3 nm and the other at about 7.5 nm (marked with an arrow inFig. 5). ForW0=20, again
two peaks appear; however, one of them is negative, indicating a decrease in the number of micelles having an average radius of about 2.5 nm. Although the full size distribution can be pre-dicted theoretically, this task is beyond the scope of this man-uscript. Still, our results qualitatively demonstrate that adding a protein shifts the entire size distribution rather than causing a contraction or expansion of each individual micelle. More-over, a preference for formation of micelles with favorable size in the protein-containing reverse micelles seems to support the previously suggested mechanism[3,4]according to which two populations of micelles are formed, protein-containing micelles and empty ones.
[image:5.595.33.284.278.647.2]Fig. 7. Viscosity of reverse micelles solution at 100 mM AOT vs water content for reverse micelles without protein (2) and with lysozyme aqueous solution concentration of 3 (E), 5 (P), and 10 g/l (!).
aqueous concentrations (3, 5, and 10 g/l) into 100 mM AOT reverse micelle solutions, were measured at a range of water content (W0)of 0–100, and are shown inFig. 7, in
compar-ison to similar measurements without protein incorporation. Low lysozyme concentration (3 g/l) does not affect the vis-cosity. In contrast, increasing the lysozyme concentration (5 or 10 g/l) hindered the sharp leap in viscosity that occurred in water volume fractions equivalent to that of the percolation threshold[10]. This sharp leap occurs at a higher water con-tent of W0=80 in the presence of lysozyme, compared to
W0=70 without it. Incorporation of lysozyme at all
concentra-tions also hindered the transition in the flow characteristics of the reverse micelle solution from a Newtonian fluid to a shear-thinning fluid at high water content. This transition occurred atW0=90 in protein-containing reverse micelles, in
compari-son toW0=80 without the protein. These results contradict the
observation of Huruguen et al.[10]who reported that the pres-ence of cytochrome c expedited the percolation threshold and the sharp leap in viscosity.
Since the changes in the rheological behavior may indi-cate that the structure is altered due to the shear flow and the protein incorporation, we have studied the microstructure of the AOT/water/isooctane reverse micelles under shear flow using SR-SAXS. Reverse micelles solutions with 100 mM AOT in isooctane at different water contents (W0=20, 40,
70, 80, 90) with incorporated lysozyme at different concen-trations (0–40 g/l in the injected aqueous solution) at pH 7 were examined in a shear rate range of 0–900 rpm. At water contents lower then W0=80, at all lysozyme concentrations
and at all shear rates, we found an isotropic scattering pattern. Analysis of the dynamic SR-SAXS curves did not indicate any changes due to the flow at low water content ofW0=70 or less,
when compared to similar measurements performed using the Kratky camera at static conditions. Contrary, reverse micelles at higher water content ofW0=80, without added lysozyme,
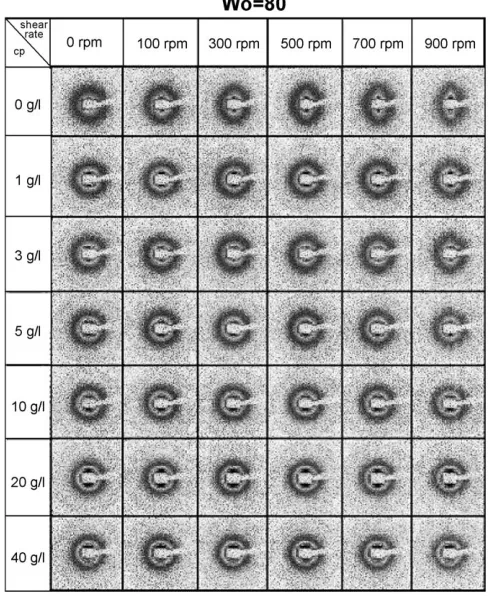
[image:6.595.314.559.73.372.2]have demonstrated an anisotropic scattering patterns at all shear rates (Fig. 8). Accordingly, the model of core–shell spherical aggregates failed to give a reasonable fit to the experimental data. Huruguen et al. [11] suggested a model of cylindrical
Fig. 8. Two-dimensional scattering patterns for reverse micelle solutions of 100 mM AOT in isooctane andW0=80 at different lysozyme concentrations
and shear rates.
objects, forming a network due to micelle entanglement, to de-scribe their SAXS data. The form factorPc(q)of such an object
is given by[28]
(4) Pc(q)=
π/2
0
ρ2J1(qRsinα) qRsinα
sin(qLcosα/2) (qLcosα/2)
2
sinαdα,
whereρ is the electron density difference between the cylin-der and the medium,J1is the first-order Bessel function,Lthe
cylinder length, andRthe radius of its cross-section. In the cur-rent work, we have followed the approach of Huruguen et al. but used a form factor of core–shell cylindrical rodlike objects. Following preliminary calculations, we were able to justify the use of a simplified expression that is applicable in the limit of very long core–shell cylinders[29],
Pc(q)=
π L q
(ρs−ρm)π Rs2
2J1(qRs)
qRs
(5) +(ρc−ρs)π Rc2
2J1(qRc)
qRc 2
,
whereρcandRc are the electron density and the radius of the
polar core of the cylindrical reverse micelle,Rsis the outer
ra-dius of the micelle,ρsis the electron density of the cylindrical
shell surrounding the core, andρmis the electron density of the
Fig. 9. Fits of the scattering data from 100 mM AOT withW0=80 to a model
of cylindrical core–shell micelles (dashed line), and to a model describing a mixture of cylindrical and spherical micelles (solid line).
Ps(q)withPc(q)in Eq.(3). Finally, the scattering intensity was
calculated from Eq. (1), assuming S(q)=1 (as applying the structure factor given by Huruguen et al. did not improve the fit). The best fit to this model, which was calculated from the best-fit parametersRc=5.42 nm andσ=1.29 and is shown as a dashed line inFig. 9, agree well with the experimental data at small scattering angles. However, the fits at higher angles are rather poor, indicating the coexistence of smaller objects. Indeed, a good fit to the experimental data was obtained by suggesting a two-component model that takes into account the coexistence of small spherical micelles having a diameter of 1 nm (solid line inFig. 9)[26]. The ratio of surfactant mole-cules forming cylindrical micelles to those forming spherical micelles,Nc/Ns, which was calculated from the fit assuming
an identical area per headgroup in both types of aggregates was found to be equal to 223. It is evidence that most surfactant molecules are found in the cylindrical micelles.
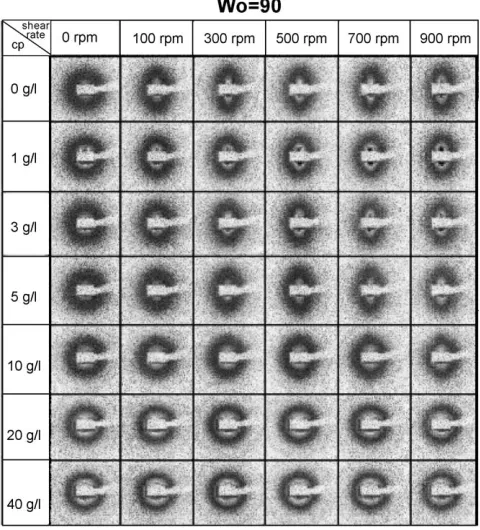
At high water content ofW0=90, the anisotropy subjected
[image:7.595.307.547.72.337.2]under shear force reduces with increasing lysozyme concentra-tion and increases with an increase in the shear rate, as shown in
Fig. 10. The anisotropy is noticeable at low lysozyme concen-trations of 1–5 g/l and is most pronounced with no lysozyme addition at all (0 g/l). At higher lysozyme concentrations of 10–40 g/l anisotropy does not appear at any shear rate. As be-fore, the anisotropic scattering patterns have shown good agree-ment with the theoretical fitting model of cylindrical reverse mi-celles (Eq.(5)), whereas isotropic patterns, obtained at higher lysozyme concentrations of 10–40 g/l, showed good agreement with a model of spherical reverse micelles. The different shapes and mean water core radius of reverse micelles atW0=90 and
different lysozyme concentrations are summarized inTable 2. As can be seen from the data given inTable 2, the reverse mi-celles atW0=90 change their shape from a cylindrical micelle
to a spherical one due to the lysozyme incorporation. The shape change is gradual, as evident from the gradual decrease in the cylinder radii at lysozyme concentrations of 1–5 g/l, followed by formation of spherical reverse micelles at lysozyme concen-trations of 10 g/l and higher.
Fig. 10. Two-dimensional scattering patterns of reverse micelle solutions of 100 mM AOT in isooctane andW0=90 at different lysozyme concentrations
[image:7.595.302.554.422.500.2]and shear rates. Table 2
Geometrical shape and mean water core radius of reverse micelles at water content ofW0=90 with different lysozyme concentrations
cp(g/l) Clys(µM) Shape R¯c(nm)
1 11.25 Cylinder 6.3
3 33.75 Cylinder 5.71
5 56.25 Cylinder 5.70
10 112.5 Sphere 7.8
20 225 Sphere 9.2
40 450 Sphere 9.1
The changes in the micelle shape correlates well with the viscosity measurements. With the empty micelles, the transition from spheres atW0=70 to cylinders atW0=80 increases the
aspect ratio(L/D)and therefore raises the resistance of the re-verse micelles to shear force[30], thus causing the sharp leap in viscosity observed in the rheometry experiments (Fig. 7). This sharp viscosity leap was hindered toW0=80 by incorporating
lysozyme concentration of 3–5 g/l into the reverse micelle so-lution, which changes their shape back from cylinders spheres. The transition from nonisotropic to isotropic scattering pat-terns was quantified using the anisotropy parameter A(q), which is defined as the ratio between the scattering intensities in perpendicular and parallel to the flow direction in the detec-tor plane H–V and is given by[31]
(6) A(q)=IV(q)
IH(q)=
I (qez)
I (qex),
where IV(q) and IH(q) are the scattering intensities
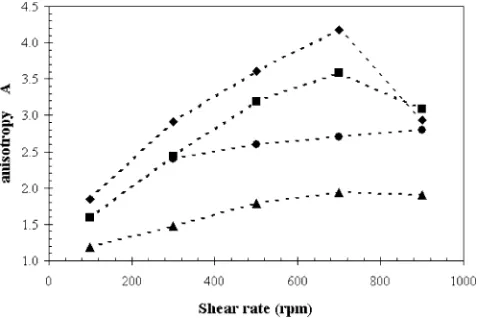
Fig. 11. Dependence of anisotropy parameter, for 100 mM AOT in isooctane solution atW0=90 on shear rate and lysozyme concentration in aqueous
solu-tion of 1 ("), 3 (2), 5 (E), and 10 g/l (Q). Lines are guides for the eye.
parallel to the cylinder axes, respectively. The 2-D scatter-ing pattern, measured in the radial X-ray beam position, was cross-sectioned in both detector plane primary axes in order to get one-dimensional scattering curves of IV(q)andIH(q).
Anisotropy parameter was calculated for the maximum change in the ratio between those two scattering curvesIV(q)/IH(q)
and illustrated for reverse micelles with water content ofW0=
90 inFig. 11.
The anisotropy parameter indicates the degree of spatial or-der of the cylindrical reverse micelles in the flow direction due to the induced shear force. The anisotropy parameter increases with increasing shear rate, as shown inFig. 11 for W0=90.
This suggests a better alignment of the cylinders in the flow direction at higher shear rates, and therefore correlates well with the shear-thinning phenomenon observed in the rheom-etry experiments. The shear force causes a reduction in the shear resistance by straightening and loosening the cylindrical micellar aggregates along the flow direction thus the micelles tend to slide over each other instead on entangling in each other[32–34]. The degree of anisotropy also increases with in-creasing the lysozyme concentration in the range of 1–5 g/l. This observation indicates that the aspect ratio(L/D) of the micelles increases with increasing protein concentration.
5. Conclusions
The influence of protein incorporation on the microstruc-ture of the reverse micelles was studied by varying the wa-ter content W0, the protein concentration, and its net charge.
It was found that the presence of proteins induced changes in the micelle size distribution, leading to a minimum in the average radius vs protein concentration curve. At high water content, a shape change from spherical to cylindrical micelles was observed. The shape transformation was associated with an increased viscosity of the reverse micelle solution, and with rheological characteristics of a shear thinning liquid. Adding a protein to the reverse micelles hindered both the shape transfor-mation and the viscosity changes by shifting the percolation to higher water contents.
Acknowledgments
We acknowledge the European Synchrotron Radiation Facil-ity for provision of synchrotron radiation facilities and we thank Dr. N. Theyencheri for assistance in using beamline ID02. This research was partly supported by the Technion V.P.R. Fund— Tobias and Reissman Research Fund in Chemical Engineer-ing.
References
[1] J.M.S. Cabral, M.R. Aires-Barros, in: J.F. Kennedy, J.M. Cabral (Eds.), Recovery Processes for Biological Materials, Wiley, Chichester, 1993, p. 247.
[2] M.J. Pires, M.R. Aires-Barros, J.M.S. Cabral, Biotechnol. Prog. 12 (1996) 290.
[3] E.P. Melo, M.R. Aires-Barros, J.M.S. Cabral, Biotechnol. Ann. Rev. 7 (2001) 87.
[4] E.P. Melo, S.M.B. Costa, J.M.S. Cabral, P. Fojan, S.B. Petersen, Chem. Phys. Lipids 124 (2003) 37.
[5] M.P. Pileni (Ed.), Structure and Reactivity in Reverse Micelles, Studies in Physical and Theoretical Chemistry, vol. 65, 1989.
[6] G. Cassin, S. Illy, M.P. Pileni, Chem. Phys. Lett. 221 (1994) 205. [7] G. Cassin, Y. Duda, M. Holovko, J.P. Badiali, M.P. Pileni, J. Chem.
Phys. 107 (1997) 2683.
[8] F. Pitre, C. Regnaut, M.P. Pileni, Langmuir 9 (1993) 2855. [9] M.P. Pileni, T. Zemb, Chem. Phys. Lett. 118 (1985) 414.
[10] J.P. Huruguen, M. Authier, J.L. Greffe, M.P. Pileni, Langmuir 7 (1991) 243.
[11] J.P. Huruguen, T. Zemb, M.P. Pilenti, Prog. Colloid Polym. Sci. 89 (1992) 39.
[12] P. Brochette, C. Petit, M.P. Pileni, J. Phys. Chem. 92 (1988) 3505. [13] J.P. Huruguen, M.P. Pileni, Prog. Colloid Polym. Sci. 84 (1991) 442. [14] M.P. Pileni, G. Cassin, F. Michel, F. Pitre, Colloids Surf. B 3 (1995) 321. [15] C. Petit, P. Brochette, M.P. Pileni, J. Phys. Chem. 90 (1986) 6517. [16] K. Naoe, K. Noda, M. Kawagoe, M. Imai, Colloids Surf. B 38 (2004) 179. [17] E. Battistel, P.L. Luisi, G. Rialdi, J. Phys. Chem. 92 (1988) 6680. [18] F.C. Marhuenda-Egea, S. Piera-Velazquez, C. Cadenas, E. Cadenas,
Ar-chaea 1 (2002) 105.
[19] B. Steinmann, H. Jaeckle, P.L. Luisi, Biopolymers 25 (1986) 1133. [20] K. Shiomori, Y. Kawano, R. Kuboi, I. Komasawa, J. Chem. Eng. Jpn. 28
(1995) 803.
[21] K. Shiomori, N. Ebuchi, Y. Kawano, R. Kuboi, I. Komasawa, J. Ferment. Bioeng. 86 (1998) 581.
[22] H. Stabinger, O. Kratky, Makromol. Chem. 179 (1978) 1655. [23] O. Glatter, J. Appl. Crystallogr. 10 (1977) 415.
[24] O. Glatter, P. Zipper, Acta Phys. Aust. 43 (1975) 307.
[25] T. Ebeling, M. Paillet, R. Borsali, O. Diat, A. Dufresne, J.-Y. Cavaille, H. Chanzy, Langmuir 15 (1999) 6123.
[26] H. Gochman-Hecht, H. Bianco-Peled, J. Colloid Interface Sci. 288 (2005) 230.
[27] G.J. Lye, J.A. Asenjo, D.L. Pyle, Chem. Eng. Sci. 49 (1994) 3195. [28] J.S. Pedersen, Adv. Colloid Interface Sci. 70 (1997) 171.
[29] O. Glatter, O. Kratky, Small Angle X-Ray Scattering, Academic Press, New York, 1982.
[30] J. Ferguson, Applied Fluid Rheology, Elsevier, London, 1991.
[31] C. Munch, H. Hoffmann, K. Ibel, J. Kalus, G. Neubauer, U. Schmelzer, J. Selbach, J. Phys. Chem. 97 (1993) 4514.
[32] R. Angelico, G. Palazzo, U. Olsson, L. Ambrosone, A. Ceglie, Prog. Col-loid Polym. Sci. 112 (1999) 1.
[33] P. Schurtenberger, L.J. Magid, J. Penfold, R. Heenan, Langmuir 6 (1990) 1800.