Ames Laboratory Accepted Manuscripts Ames Laboratory
8-17-2018
A first-principles based description of the Hf-Ni
system supported by high-temperature synchrotron
experiments
A. J. Ross
Pennsylvania State University
T. Gheno
University of Pittsburgh
Pratik K. Ray
Ames Laboratory
Matthew J. Kramer
Ames Laboratory, [email protected]
X. L. Liu
Pennsylvania State University
See next page for additional authors
Follow this and additional works at:https://lib.dr.iastate.edu/ameslab_manuscripts Part of theMaterials Science and Engineering Commons
This Article is brought to you for free and open access by the Ames Laboratory at Iowa State University Digital Repository. It has been accepted for inclusion in Ames Laboratory Accepted Manuscripts by an authorized administrator of Iowa State University Digital Repository. For more information, please [email protected].
Recommended Citation
Ross, A. J.; Gheno, T.; Ray, Pratik K.; Kramer, Matthew J.; Liu, X. L.; Lindwall, G.; Zhou, B.; Shang, S. L.; Gleeson, B.; and Liu, Z.-K., "A first-principles based description of the Hf-Ni system supported by high-temperature synchrotron experiments" (2018).Ames Laboratory Accepted Manuscripts. 346.
A first-principles based description of the Hf-Ni system supported by
high-temperature synchrotron experiments
Abstract
Hf-Ni is an important binary system for high temperature alloys and shape memory alloys which has been investigated several times in the literature but often using samples of Hf contaminated by Zr. The
thermodynamics of this system are remodeled in this work based on first-principles calculations and additional experiments using Hf with relatively low Zr contamination (0.25 wt. %). Diffusion couples in the Ni-rich portion of the Hf-Ni system heat treated at 1173, 1273 and 1373 K are used to measure phase stability and Hf solubility in the fcc phase. The solubility observed in fcc Ni from Ni/Ni50Hf50 (at.%) diffusion couples is larger than that observed in previous experiments. These results are the only source fit to during modeling of the fcc solubility to mitigate effects from Zr contamination. Data in the literature suggests that the high temperature crystal structure of the B33 NiHf phase is, in fact, the B2 structure. High temperature synchrotron measurements provide confirmation of this crystal structure. Modeling of the B2 phase was aided by first-principles calculations using special quasi-random structures (SQS). The present CALPHAD model will prove useful when designing shape memory alloys containing Hf and when modeling the Hf activity in Ni-base high temperature alloys.
Disciplines
Materials Science and Engineering
Authors
A. J. Ross, T. Gheno, Pratik K. Ray, Matthew J. Kramer, X. L. Liu, G. Lindwall, B. Zhou, S. L. Shang, B. Gleeson, and Z.-K. Liu
1
A first-principles based description of the Hf-Ni system supported by high-temperature synchrotron experiments
Ross A. J.a, Gheno, T. b, Ray P.K.c, Kramer M.J.c, Liu, X.L. a, Lindwall, G.d, Zhou, B.a, Shang, S.L. a, Gleeson, B. b, Liu, Z-K.a
aDepartment of Materials Science and Engineering, The Pennsylvania State University,
University Park, PA 16802
bDepartment of Mechanical Engineering & Materials Science, University of Pittsburgh,
Pittsburgh, PA 15261, USA
c Ames Laboratory, US-DOE, Ames, IA 50011, USA
dDepartment of Materials Science and Engineering, KTH Royal Institute of Technology Brinellvägen 23, SE-11428 Stockholm
Abstract
Hf-Ni is an important binary system for high temperature alloys and shape memory alloys which
has been investigated several times in the literature but often using samples of Hf contaminated
by Zr. The thermodynamics of this system are remodeled in this work based on first-principles
calculations and additional experiments using Hf with relatively low Zr contamination (0.25 wt.
%). Diffusion couples in the Ni-rich portion of the Hf-Ni system heat treated at 1173, 1273 and
1373 K are used to measure phase stability and Hf solubility in the fcc phase. The solubility
observed in fcc Ni from Ni/Ni50Hf50 (at.%) diffusion couples is larger than that observed in
previous experiments. These results are the only source fit to during modeling of the fcc
solubility to mitigate effects from Zr contamination. Data in the literature suggests that the high
temperature crystal structure of the B33 NiHf phase is, in fact, the B2 structure. High
temperature synchrotron measurements provide confirmation of this crystal structure. Modeling
of the B2 phase was aided by first-principles calculations using special quasi-random structures
(SQS). The present CALPHAD model will prove useful when designing shape memory alloys
2
1 Introduction
The Hf-Ni system is of key importance to high temperature oxidation resistant alloys where Hf
has been observed to reduce the growth rate of protective oxides and improve scale adherence
[1]. In MCrAlX overlay coatings (M=Ni, Co or Fe and X=Y,Hf,Zr, or La), platinum diffusion
aluminides (e.g. MDC-151L) and Ni-base superalloys (e.g. Rene N5), Hf has proven to be
especially beneficial in providing oxidation resistance. These materials are based on the
following phases: fcc solid solution, γ’-Ni3Al (L12) and β-NiAl (B2). Both the L12 phase the B2
phase are rich in Al, making them important for forming a protective oxide layer of 𝛼𝛼-Al2O3
during oxidation. The disordered fcc phase will often be in equilibrium with the L12 or the B2
phase in MCrAlX coatings. Hence, it is important to understand the solubility and activity of Hf
in the disordered phase. It is also especially important to consider the stability of the B2 phase in
the Hf-Ni system since the thermodynamics from this binary system will play an important role
in the reactivity of Hf during oxidation of the 𝛽𝛽-NiAl phase.
Hf-Ni is also considered an important binary system for shape memory applications. The
Ti-Hf-Ni system has been long considered a rich source of shape memory compositions due to the
relative low cost of these alloys[2]. The large stability range of the B2-NiTi phase plays a role in
the design of these alloys. It has been suggested that NiTi forms a complete solid solution with
NiHf at high temperatures but the high temperature phase rich in Hf could not be analyzed after
quenching[3]. Although it is likely that this phase has a B2 structure, no experiments have
directly confirmed this. Confirmation of this phase structure will offer justification to
thermodynamic models which describe it as the B2 phase. Finally the Hf-Ni system is important
3 several alloying elements X and because of the eutectics often present in those Hf-Ni-X systems
[4]–[6].
The Hf-Ni system has been modeled several times in the literature. It was recently modeled by
Wang et al[7] using new experimental diffusion couples. Then, the system was re-modeled by
Zhang et al[8] in an investigation of the Ni-rich part of the Al-Hf-Ni system. Finally a
first-principles based assessment was carried out by Berche et al[6] with little focus on experiments.
Unfortunately, many thermochemical experiments in the literature used by Wang et al used Hf
with ~2-3 wt.% Zr. This is not ideal for equilibrium measurements and phase boundary
measurements as Zr may alter the phase boundary of the system or stabilize a phase which would
not have otherwise been present. Although it is not wise to discard these equilibria measurements
entirely, some uncertainty must be attributed to the position of phase boundaries – especially for
the equilibrium between the fcc solution phase and Ni5Hf which will have a large impact on the
resulting activity of Hf. While not all experimental data in the literature reports the presence of
Zr in their Hf samples, it is seems likely that Zr contamination is more probable in older
experiments given the cost in detecting and removing Zr from Hf[9].
The present theoretical and experimental work seeks to expand (1) the previously investigated
first-principles in this system, (2) the phase stability and solubility of Hf in this system using
high purity Hf, and (3) the high temperature stability of the NiHf phase. Finite temperature,
first-principles calculations are carried out on select Ni-rich intermetallic phases to obtain Gibbs
energies for each of these phases. Special quasi-random structures (SQS) calculations were
performed to obtain enthalpies of mixing in the fcc, bcc and B2 phases. This information is
implemented in the computation of phase diagrams (CALPHAD) remodeling of this system.
4 experiments confirm that there is a larger solubility of Hf in fcc compared to previous
experiments. First-principles calculations of the B33-NiHf and B2 phases shows the expected
results that the B2 phase is mechanically stable and has a higher calculated molar entropy
compared to the B33 phase. This suggests the possibility of B2 being the high temperature stable
phase. Differential scanning calorimetry (DSC) is used to measure the transition temperature of
the high temperature phase and high temperature synchrotron experiments performed on a
Ni-50Hf (at.%) alloy confirms the presence of the B2 phase. This work is part of a larger
investigation of the Al-Cr-Hf-Ni system.
2 Literature Review
Although the Hf-Ni system has been investigated many times, results often came with the
presence of Zr impurities in the Hf used. For instance, investigations into equilibria in this
system by Hajjaji et al.[10], Svechnikov et al.[11] Bsenko et al.[12] contained ~2.5, ~0.65, and
~3 wt.% Zr in the starting Hf alloys, respectively. Investigations into the formation enthalpies of
intermetallic compounds by Selhaoui et al.[13] and Bencze[14], contained ~2.3 and ~2.52 wt.%
Zr, respectively, in the starting Hf alloys. An additional complicating factor is that Hf has a very
high solubility for O[15] which is only briefly addressed by Guo et al. [16], [17]. The most
recent collection of the literature in this system are included in the thermodynamic re-modeling
by Wang et al.[7]. While many sources are listed, the details of these experiments are not fully
summarized. What follows is an in-depth discussion of this literature and more recent
experiments in this system.
2.1 Equilibria
The Ni-rich part of the Hf-Ni system (65-80 at. % Ni) has been investigated by Bsenko et al.[12]
5 Differential thermal analysis (DTA) of arc-melted samples was also used to tabulate the invariant
reactions within this composition range. Svechnikov et al.[11] and Yeremenko et al[18] both
used DTA to measure the liquidus of the system from 0 to 100 and 0 to 50 at.% Ni, respectively.
Yeremenko et al.[18] reported performing additional equilibria measurements at 1473 K, 1373 K
and 1273 K, but only data at 1375 K is reported.
Wang performed diffusion couple experiments at 1123 and 1173 K for 1440 and 1200 hours,
respectively. Electron probe micro-analysis (EPMA) was used to measure the Hf solubility in
fcc-Ni, the Ni solubility in hcp-Hf, and the composition range of the NiHf2 phase. Hajjaji et
al.[10] also studied the solubility of Hf in fcc-Ni using XRD and transmission electron
microscopy (TEM) in the temperature range of 773 to 1373 K. Notably, heat treatment times for
measurements in this study were unspecified except at 1333 K with a heat treatment time of 24
hours.
2.2 Thermochemical data
Experiments by Bencze[14] using Knudsen effusion cell spectrometry represents the most
extensive investigation of the thermochemical information of the solid phases in the Hf-Ni
system. This data set includes Gibbs energies of formation, enthalpies of formation, associated
activities and, to a lesser extent, phase stabilities at 1418 and 1473 K. Selhaoui et al.[13] and
Guo et al. [16], [17] both measured formation enthalpies of compounds via direct synthesis
calorimetry for a range of temperatures between 1323 K and 1623 K and at 1477 K, respectively.
The most recent thermochemical investigation into the liquid phase was carried out by
Popoprigora et al.[19], [20] on Hf-Ni melts at 1770 ±5 K using calorimetry. Earlier calorimetry
measurements were also carried out by Selhaoui et al.[13] at 1473 and 1633 K, and by
6
2.3 First-principles data
The formation enthalpy of the known compounds in the binary system was investigated by
Berche[6] in a larger investigation of the Hf-Ni-Sn system. Calculations were performed in the
Vienna ab initio simulation package (vasp)[22] using settings intended to attain reasonable
accuracy for values of the compound formation enthalpy. However, this study did not investigate
the B2 phase or the L12 phase and did not include enthalpies for the disordered fcc-A1 and
bcc-A2 solution phases. Additional sources of compound formation enthalpies for select compounds
are also available from high-throughput DFT calculations such as work using AFLOW[23].
2.4 Experimental evidence of the B2 phase
In the investigation by Wang et al.[7] the high temperature allotrope of NiHf is not explicitly
identified as the B2 phase. This is largely due to the fact that there has been no direct observation
of this phase in the literature. Experiments performed by Yeremenko et al[18] in the Hf-Ni-Ti
system suggests a complete solid solution between 𝛽𝛽-NiTi and the high temperature NiHf phase
through phase relations of quenched alloys and DTA measurements. However it was not possible
for Yeremenko et al[18] to quench this phase from high temperature and only the low
temperature B33 allotrope was ever resolved during experiments. There are also other
experiments by Eremenko et al.[24] which studied solid solutions between NiZr and NiHf. A
complete solid solution was observed for the B33 phase at low temperatures and a large solution
range for a high temperature phase of B2 was also suggested but was again too difficult to
resolve from quenching[24].
7 As stated before, Wang et al. [7] observed an appreciable composition range in the Hf2Ni phase.
A small composition range (0.3 at. %) was also observed in Hf2Ni7. Several other ternary
investigations have noted significant solubility in this phase. Experiments by Nash and West[25],
[26], Khorunov et al.[5], and Zhang et al.[8] all observed that tie-lines consistent with a Hf2Ni7
phase which could dissolve a significant amount of Ni. In this work, a model for this phase is
adopted from our larger investigation into the Al-Cr-Hf-Ni system and a suggested solubility is
added based on modeling in the ternary Al-Hf-Ni system.
3 Thermodynamic models
3.1 Stoichiometric intermetallic phases
For a stoichiometric compound HfANiB, the molar Gibbs energy of this phase, 𝐺𝐺𝑚𝑚𝐻𝐻𝑓𝑓𝐴𝐴𝑁𝑁𝑖𝑖𝐵𝐵, can be
given as:
𝐺𝐺𝑚𝑚𝐻𝐻𝑓𝑓𝐴𝐴𝑁𝑁𝑖𝑖𝐵𝐵− �𝐴𝐴+𝐴𝐴𝐵𝐵� 𝐻𝐻𝐻𝐻𝑓𝑓𝑆𝑆𝑆𝑆𝑆𝑆− �𝐴𝐴+𝐴𝐴 𝐵𝐵� 𝐻𝐻𝑁𝑁𝑖𝑖𝑆𝑆𝑆𝑆𝑆𝑆= 𝑎𝑎+𝑏𝑏𝑏𝑏+𝑐𝑐𝑏𝑏ln𝑏𝑏+𝑑𝑑𝑏𝑏2+𝑏𝑏𝑒𝑒+𝑓𝑓𝑏𝑏3
where 𝑎𝑎 through 𝑓𝑓 are constants and 𝐻𝐻𝑖𝑖𝑆𝑆𝑆𝑆𝑆𝑆 is the enthalpy of element 𝑖𝑖 in the standard element
reference state. When experiments are not available to fit these parameters they can instead be
determined using first-principles calculations[27]. However, this is not always considered
necessary and in some cases a simpler Kopp–Neumann type approach is used[28]. In such cases
the Gibbs energy is given as:
𝐺𝐺𝑚𝑚𝐻𝐻𝑓𝑓𝐴𝐴𝑁𝑁𝑖𝑖𝐵𝐵− � 𝐴𝐴
𝐴𝐴+𝐵𝐵� 𝐻𝐻𝐻𝐻𝑓𝑓𝑆𝑆𝑆𝑆𝑆𝑆− �𝐴𝐴+𝐴𝐴𝐵𝐵� 𝐻𝐻𝑁𝑁𝑖𝑖𝑆𝑆𝑆𝑆𝑆𝑆
8 Where 𝐴𝐴 𝐻𝐻𝑓𝑓𝐴𝐴𝑁𝑁𝑖𝑖𝐵𝐵 and 𝐵𝐵𝐻𝐻𝑓𝑓𝐴𝐴𝑁𝑁𝑖𝑖𝐵𝐵 are values used to fit the available formation enthalpy and entropy,
respectively, and the heat capacity is given by the mechanical mixture of the individual elements.
Both models are used in this work.
3.2 Solution phases
The bcc, fcc, hcp and liquid phases are modeled using the compound energy formalism[29]
(CEF), with mixing on a single symmetry equivalent sublattice. For each of the solid solution
phases the sublattice is occupied by both Ni and Hf with sublattice model (Ni,Hf)a(Va)b where a
and b represent the relative stoichiometry for lattice sites and modeled interstitial sites,
respectively. Mixing occurs between end-members - those compounds representing extremes in
sublattice occupation: NiaVab and HfaVab. The Gibbs energy of the solution phase is constructed
using contributions from the mechanical mixing of these end-members, configurational entropy
and an excess term. The excess Gibbs energy, 𝐺𝐺𝑚𝑚𝑒𝑒𝑒𝑒 is considered using a Redlich-Kister
polynomial:
𝐺𝐺𝑚𝑚𝑒𝑒𝑒𝑒 =� � 𝑥𝑥𝑖𝑖𝑥𝑥𝑗𝑗� 𝐿𝐿𝜈𝜈 𝑖𝑖,𝑗𝑗 𝜈𝜈
�𝑥𝑥𝑖𝑖− 𝑥𝑥𝑗𝑗�𝜈𝜈
𝑗𝑗>𝑖𝑖 𝑖𝑖
Where 𝜈𝜈𝐿𝐿𝑖𝑖,𝑗𝑗 is the 𝜈𝜈th order interaction parameter between species 𝑖𝑖 and 𝑗𝑗 expanded out in mole
fraction of these components: 𝑥𝑥𝑖𝑖 and 𝑥𝑥𝑗𝑗 respectively. In this work the interaction parameters are
expanded to the first order of T:
𝐿𝐿
𝜈𝜈
𝑖𝑖,𝑗𝑗 = 𝜈𝜈𝐴𝐴𝑖𝑖,𝑗𝑗+𝜈𝜈𝐵𝐵𝑖𝑖,𝑗𝑗𝑏𝑏
Where 𝜈𝜈𝐴𝐴𝑖𝑖,𝑗𝑗 is used to fit to the excess enthalpy and 𝜈𝜈𝐵𝐵𝑖𝑖,𝑗𝑗 the excess entropy for a given phase.
3.3 Non-stoichiometric intermetallic phases
Wang et al.[7] observed significant solubility in the Ni1Hf2 phase and thus modeled this phase
9 This model is adopted in this work with Ni1Hf2 and Hf1Hf2 end-members adjusted using
first-principles calculations. Aside from this, the model is the same as the one found by Wang et
al.[7]. The Ni7Hf2 phase is modeled using the sublattice model: (Ni)7(Hf,Ni)2.. This model was
chosen in this work to account for Hf solubility observed in higher order systems[25], [26] of the
Al-Cr-Hf-Ni system.
3.4 The order disorder model
The order disorder model in this work describes the bcc-A2 to B2 and fcc-A1 to L12
transformations. L12 is not stable in the binary but it is still important to model this phase for
higher order systems where it is stable - such as the Ni-Al-Hf system[30]. The model used in this
work to describe these transformations is the one developed by Ansara[31] and Dupin[32]. While
a more physical version of this model uses four sublattices, this paper will use the two sublattice
(2SL) model for both the B2 and L12 ordered phases given the wide-spread application of the
2SL model. For a given disordered phase Θ and its corresponding ordered phase Θ′, the 2SL
model treats the Gibbs energy of the ordered phase, 𝐺𝐺𝑚𝑚Θ′, as a sum the Gibbs energy of the
disordered solution phase, 𝐺𝐺𝑚𝑚Θ , and an ordering contribution, Δ𝐺𝐺𝑚𝑚Θ′.The full form of the ordering
contribution can be found elsewhere and will not be discussed here[33], [34].
The interactions and end-members of the ordered energy contribution are modeled using the
concept of bond energies between elements 𝑖𝑖 and 𝑗𝑗, 𝑈𝑈𝑖𝑖,𝑗𝑗, on a given sublattice. For the Hf-Ni
system there are three ordered compounds considered in the 2SL model. The Gibbs energy of
these compounds is given as:
𝐺𝐺HfNi3 = 3𝑈𝑈𝐻𝐻𝑓𝑓𝑁𝑁𝑖𝑖+𝛼𝛼HfNi3
10
𝐺𝐺Hf3Ni = 3𝑈𝑈𝐻𝐻𝑓𝑓𝑁𝑁𝑖𝑖+𝛼𝛼Hf3Ni
Where the 𝛼𝛼 terms represent changes in the bonding environment between each compound[35].
𝑈𝑈𝐻𝐻𝑓𝑓𝑁𝑁𝑖𝑖 and the 𝛼𝛼 terms are used to fit to available thermochemical and phase equilibria data in the
same way that interaction parameters are:
𝑈𝑈𝐻𝐻𝑓𝑓𝑁𝑁𝑖𝑖 =𝐴𝐴𝑈𝑈𝐻𝐻𝑓𝑓𝑁𝑁𝑖𝑖 +𝐵𝐵𝑈𝑈𝐻𝐻𝑓𝑓𝑁𝑁𝑖𝑖𝑏𝑏
And
𝛼𝛼i = 𝐴𝐴𝑖𝑖 +𝐵𝐵𝑖𝑖𝑏𝑏
In the 4SL model there is an equivalency between sublattice configurations due to the symmetry
between Wyckoff sites in the L12 phase and B2 phase. This results in equivalency between
end-members of the 4SL model, e.g.: 𝐺𝐺𝑖𝑖:𝑗𝑗:𝑗𝑗:𝑗𝑗 = 𝐺𝐺𝑗𝑗:𝑖𝑖:𝑗𝑗:𝑗𝑗 =𝐺𝐺𝑗𝑗:𝑗𝑗:𝑖𝑖:𝑗𝑗 =𝐺𝐺𝑗𝑗:𝑗𝑗:𝑗𝑗:𝑖𝑖, and interactions in the 4SL
model, e.g.: 𝐿𝐿𝑖𝑖.𝑗𝑗:𝑗𝑗:𝑗𝑗:𝑗𝑗 = 𝐿𝐿𝑗𝑗:𝑖𝑖.𝑗𝑗:𝑗𝑗:𝑗𝑗 =𝐿𝐿𝑗𝑗:𝑗𝑗:𝑖𝑖.𝑗𝑗:𝑗𝑗 = 𝐿𝐿𝑗𝑗:𝑗𝑗:𝑗𝑗:𝑖𝑖.𝑗𝑗. Since the 2SL model represents a
simplification of the more complex 4SL model, modifications to the energy surface of the 2SL
model are made through relations in the interaction parameters to account for this equivalency.
The full form of these relations can be found elsewhere[34].
4 First-principles methodologies
4.1 Finite temperature calculations
Although first-principles calculation have already been carried out by Berch et al.[6] it is of
interest to calculate the finite temperature properties of the B2 phase, the low temperature HfNi
allotrope and the high temperature compound NiHf2. The NiHf2 is of interest since it will come
in equilibrium with the B2 phase at high temperatures. All calculations are carried out in the
Vienna ab initio software package[22] (vasp 5.3.3) using the projector augmented wave (PAW)
11 using the generalized gradient approximation via the implementation by Perdew, Burke, and
Ernzerhof[36] (PBE). The recommended PAW potentials by vasp for Hf and Ni are used in this
work[37]. Brillouin zone integration was carried out using the tetrahedron-bloch method with the
fully automatic function of k-mesh generation provided by vasp. A length of 80 was provided for
all calculations within this method[37]. This kpoint method results in a variable kpoint per
reciprocal atom (kppra) value but the smallest kppra was 5000 which results in acceptable
accuracy.
Finite temperature information is obtained using the approach detailed by Shang and Wang[38],
[39] where the Helmholtz free energy, 𝐹𝐹(𝑉𝑉,𝑏𝑏), is taken as the sum of the 0K energy, 𝐸𝐸0𝐾𝐾, the
vibrational Helmholtz free energy, 𝐹𝐹𝑣𝑣𝑖𝑖𝑣𝑣(𝑉𝑉,𝑏𝑏), and the thermal-electronic Helmholtz free energy,
𝐹𝐹𝑇𝑇−𝑒𝑒𝑒𝑒𝑒𝑒(𝑉𝑉,𝑏𝑏). In this work 𝐹𝐹𝑣𝑣𝑖𝑖𝑣𝑣(𝑉𝑉,𝑏𝑏) is obtained with the quasi-harmonic Debye model as
described by Shang et al.[38] where a Debye temperature, Θ(𝑉𝑉,𝑏𝑏), is calculated using structures
at different volumes to obtain the energy as a function of volume, 𝐸𝐸0𝐾𝐾(𝑉𝑉), through a four
parameter Birch-Murnaghan equation of state fitting. A scaling factor for Θ(𝑉𝑉,𝑏𝑏) to account for
the crystal anisotropy of a given phase was calculated using the methods described by Shang et
al.[40]
4.2 SQS calculations
SQS calculations are carried out in vasp using the setting described above. bcc-A2 mixing
enthalpies were calculated using binary structures developed by Jiang et al.[41]. fcc-A1 mixing
was calculated using structures developed by Wolverton et al.[42] and B2 mixing was calculated
using structures developed by Jiang et al.[43]. All calculations followed a three-tiered relaxation
scheme during vasp structure calculations: 1st only volume was allowed to relax, 2nd volume and
12 Mixing enthalpies were only kept if the corresponding structure kept its crystal symmetry. This
was tested using radial distribution functions to assess the symmetry of the structures.
5 Experimental methodologies
The experiments were performed using a HfNi ingot of nominally equiatomic composition,
Hf50Ni50 (at. %), received from the Materials Preparation Center of Ames Laboratory [44]. The
Hf contained 0.25 wt. % Zr. The ingot was made by argon arc melting, drop cast into a 10 mm
diameter rod, and homogenized for 6 h at 1473 K plus 48 h at 1423 K in vacuum. The
homogenization was chosen as part of a standard treatment used for laboratory alloys.
5.1 Diffusion couple
Diffusion couples were made between the HfNi alloy and pure Ni in order to study phase
equilibria in the Ni-rich half of the HfNi system. The Ni specimens were taken from a high
purity (99.999 %), 1 mm thick plate received from Goodfellow. Specimens of dimensions 4 x 4 x
1 mm were ground using SiC papers, polished with diamond suspensions down to a 3 µm finish,
and ultrasonically cleaned in ethanol. Couples were made by placing Ni and HfNi specimens in a
silicon nitride clamping device, using Al2O3 powder to keep the samples leveled, and heat
treating the assembly 30 min at 1373 K (1173 K couple) or 1 h at 1423 K (other couples) in
laboratory air. After slow cooling, the couples were vacuum-encapsulated in quartz capsules and
annealed at 1173, 1283 and 1373 K for 500, 190, and 100 h, respectively. The diffusion heat
treatments were terminated by water quenching.
Polished sections of the heat-treated couples were prepared by standard metallographic
procedures. Composition profiles were measured by electron probe micro-analysis (EPMA)
using a JEOL JXA-8530F field emission gun instrument. The measured intensities were
13 standards. A step size of 5 µm was used for overall scans of the diffusion regions, and 1 µm
steps were used for detailed scans of the Ni/HfNi5 interface region.
5.2 In-situ observation of phase transition
The high temperature phase transformation was observed using Differential Scanning
Calorimetry (DSC) and time-resolved synchrotron based High Energy X-Ray Diffraction
(HEXRD). The DSC experiments were performed using a NETZSCH 2000 calorimeter, in inert
ultra-high purity argon environment. The sample was heated from room temperature to 1400°C
and then cooled back to room temperature at a rate of 10°C/min. The time-resolved HEXRD
experiments were carried out at the Advanced Photon Source (APS) at Argonne National
Laboratory, in sector 11, beamline ID-11-C (energy – 105.6 keV, wavelength – 0.118Å). The
samples were prepared by sectioning the cast HfNi alloys and thinning down the sections to ~
500μm. The samples were then stacked in a Linkham TS1500 resistance furnace. These samples
were then heated to 1490 K using an initial heating rate of 30K/min till 1373 K and 10K/min
from 1373 to 1490 K. The diffraction data was collected using a Perkin-Elmer detector.
6 Results and Discussion
6.1 Results from first-principles
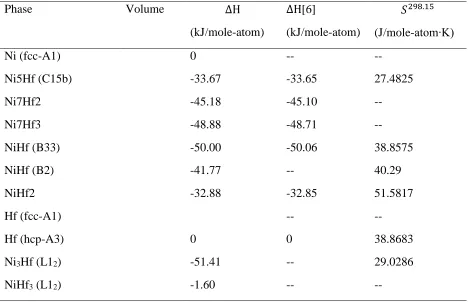
A list of calculated enthalpies formation at 298.15 K, Δ𝐻𝐻298.15𝐾𝐾 and entropies at 298.15 K,
𝑆𝑆298.15, are given in Table 1. Data by Berche[6] is given for comparison. Formation enthalpies
from Berche agree well with the present calculated values. The entropy at 298.15 K for the NiHf
B2 phase is higher than the entropy for the B33-NiHf phase while the formation enthalpy for the
14 thermodynamics of high-temperature and low temperature phases. The difference in the
formation enthalpy is around 8 kJ, however, and it is difficult to ascertain directly from
first-principles if this is surmountable for the B2 phase based on the entropy difference between these
two phases and the accuracy of the present vibrational calculations.
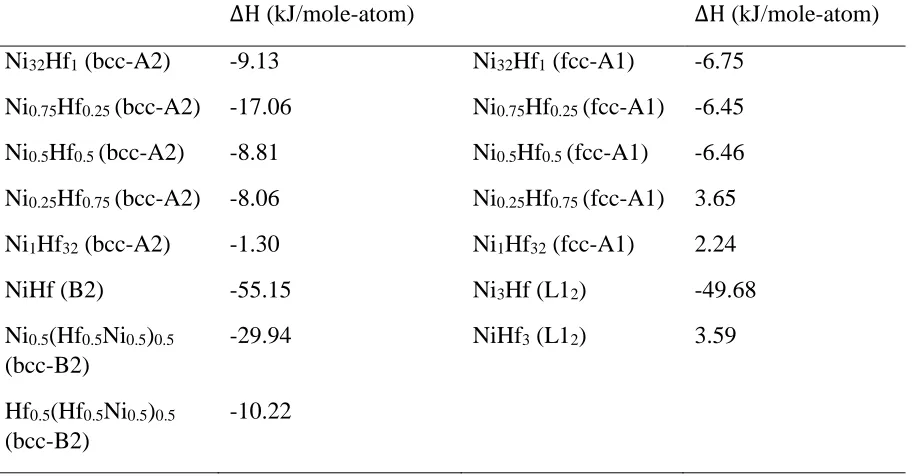
Calculated mixing enthalpies for the fcc, bcc and B2 solutions are presented in Table 2. Also
included are the formation enthalpies of the ordered B2 and L12 compounds with respect to their
respective disordered solutions. Mixing was more positive for dilute Hf-rich calculations
compared to dilute Ni-rich calculations. There is a sign change between the two extremes in
composition in the fcc phase. This is most likely caused by the size mismatch between each
element. This may explain why the sign does not flip on the bcc portion of the diagram - since
the bcc Hf phase has a greater equilibrium volume than the fcc phase and can therefore
accommodate more strain in the lattice. The ordering contributions are much more negative
compared to the disordered solutions, as expected.
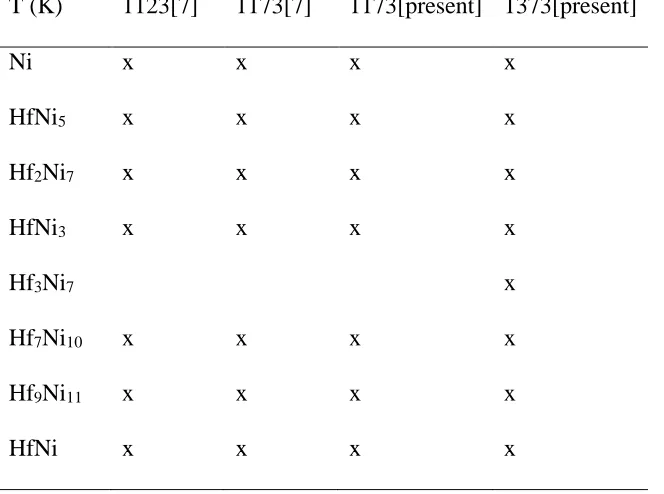
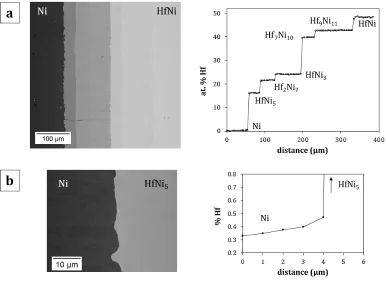
6.2 Diffusion couple experimental results
The phases present after annealing of the diffusion couples, identified from the composition
profiles, are summarized in Table 3 (partial oxidation of the 1283 K couple prevented reliable
identification of the complete sequence at that temperature). Micrographs and composition
profiles obtained from the 1173 K couple are given in Figure 1 as an example. This information
is compared to diffusion couple work by Wang et al.[7] in the same table. Phase observations are
in good agreement. The results are also in good agreement with ternary diffusion couple
15 Hf-Ni system[45]. Detailed analysis of the Ni/HfNi5 interface region allowed the Hf solubility in
γ-Ni to be determined; the measured values are plotted in Figure 8a and will be discussed later.
6.3 High temperature experimental results
The differential scanning calorimetry (DSC) thermogram is shown in figure 2a. Interestingly, the
exothermic peak corresponding to the phase transformation at 1433 K exhibits a significant
asymmetry. Similarly, during cooling, one can observe a pronounced asymmetry. This is
suggestive of a two-step transformation process (similar to the phase transformations in the
TiAlNb system [47]). The temperature-dependent high energy x-ray diffraction (HEXRD)
pattern is shown n figure 2b, with the powder diffraction pattern from the low temperature HfNi
phase superimposed. The data is represented in a 2D plot, with the lines indicating the location of
Bragg peaks in Q-space. The peak colors indicate the intensity of the peaks. Therefore, the phase
transformation is indicated by the appearance of new peaks at approximately 1433 K, as
indicated in figure 2b. There is a good agreement on the transformation temperatures (~ 1433 K)
between the DSC measurements and the temperature-dependent diffraction data. It should be
noted that the transformation, as observed in the HEXRD data is not a military type
transformation and is constrained by kinetics. The peak intensities of the room temperature phase
decreases but doesn’t disappear completely. This indicates that the transformation kinetics are
still sluggish and the transformation, during the synchrotron experiments, did not go to
completion. In fact, the initial intensities during the appearance of the B2 phase at 1433 K is
rather weak, with the intensities becoming significantly higher around 1458 K. Upon careful
16 than 1433 K (corresponding to the pre-peak in the DSC thermogram in figure 2a) and gain in
intensity beyond this temperature.
Similar phase transformations have been investigated in the Ti-Al-Nb system[46]. The phase
section was predicted on the basis of sub-group selections while cooling from high temperatures
(as opposed to heating). The B2 phase in the Ti-Al-Nb system was predicted to transform
initially to a B19 phase (Pmma) and eventually to the Cmcm phase[46]. We report the phase
transformation during heating, with the room temperature Cmcm phase transforming to a B2
structure at elevated temperatures. The asymmetry and splitting n the DSC peak could be an
indicator of a deeper underlying transformation mechanism that we do not yet understand
completely and was not captured in the HEXRD data due to inadequate time resolution and
relatively higher heating rates.
6.4 Results from CALPHAD optimization
CALPHAD optimization was done using the Parrot module of Therm-Calc[47]. The model
parameters were first adjusted using thermochemical data from the first-principles calculations.
Following this, the parameters were adjusted using both first-principles and experimental data.
The resulting parameters and thermodynamic database can be found in the supplementary
materials section.
6.4.1 Intermetallic stability
A plot of the formation enthalpies calculated from the present model at 1413.15 K and 298.15 K
compared to experimentally determined enthalpies of formation and calculated enthalpies of
formation is given in Figure 3. Data by Benscze et al.[14] at 1413 K is not fully reproduced at
17 and the result of fitting to the available invariant reactions and liquidus information. Only two
compounds fall on the convex hull according to DFT: B33-NiHf and Ni3Hf (R-3m). In the
present modeling, these phases are also the only ones present on the convex hull at 298.15.
However, C15b-Ni5Hf is stabilized at 302 K and this phase is so close to the convex hull as to be
practically stable at low temperatures in the present predictions.
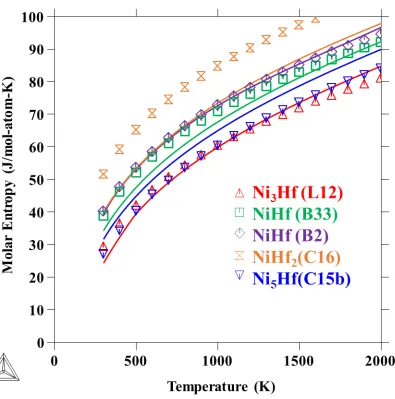
Calculated molar entropies from the present modeling for the Ni3Hf (L12), B33, B2, C16, and
C15b phases is given in Figure 4 compared to values obtained from first-principles calculations.
Calculated trends in entropy are replicated in the present model but the magnitude of entropy
was not. The C15b phase required a higher entropy to match observed invariant equilibria with
the liquid and the C16 phase required a decrease of ~10 J/mol-atom-K at 298.15 K. The entropy
difference between B33 and B2 modeled in this work was much larger compared to the value
calculated from first-principles. Although it is possible that this is related to uncertainty in the
equilibria near this phase, it is more likely caused by sources of error in the bonding described
between B33 and B2 through the PBE, PAW potentials.
Ni activities measured by Bencze[14] compared to the calculated activities in the present
database are shown in Figure 5. Good agreement is achieved to this data. Optimization to the
activity represented by the equilibria between B2 and the liquid is not achieved. Agreement is
also worse on the Hf-rich portion of the diagram. However, there is a large degree scatter in the
experimental values for samples with low Ni activities in this portion.
6.4.2 Thermochemical data in the liquid phase
The enthalpies of mixing at 1770 K, partial enthalpy of mixing at 1770 K, and the enthalpy of
mixing with respect to liquid Ni and solid hcp at 1743 K is plotted in Figure 6a, b and c
18 resulting mixing enthalpy is an average of experimental values. Disagreement occurs with higher
Hf concentrations between datasets. This is why partial enthalpy calculations by Podoprigora et
al.[20] and Sudavtsova et al.[21] disagree with the present model and why experimental partial
enthalpies agree well for low Hf concentration in the liquid.
6.4.3 The liquidus and sources of disagreement in this work
The Hf-Ni phase diagram is plotted in Figure 7. Invariant reactions agree well with the collected
experimental invariant reactions with the exception of those between B2 and the NiHf2 phase.
The disagreement between DTA from Yeremenko et al.[3] and Svechinkov et al.[11] data is
stark with a difference of roughly 200 K between the two experiments near 66 at.% Hf. Work by
Eremenko[24] showed that the liquidus between the compounds NiZr and NiHf was roughly a
linear interpolation between the melting points of these two compounds: 1543 and 1778 K,
respectively. The liquidus surface should not be drastically different between NiHf2 and NiZr2 so
of the two datasets, assuming no error between datasets, measurements by Yeremenko et al. [3]
are more likely to be contaminated by Zr. However, it was not possible to fit to data by
Svechinkov et al.[11] and simultaneously capture the surrounding eutectics. Hence, near the
NiHf2 phase, DTA data by only Yeremenko et al. [3] was used to fit the liquidus in this region.
The catatectic on the Hf-rich portion was subsequently affected with a calculated value of 1802
K which is much higher than 1428 K suggested by Yeremenko et al. [3] . While it is possible to
adjust the liquid energy in this region of the phase diagram to yield an acceptable fit to the
measured phase boundaries and catatectic reaction, this would require a more intricate model
such as the assosciate model or the modified quasichemical model[48]. It is the opinion of the
authors that more experimental work is needed with high purity samples in the Zr-rich portion
19
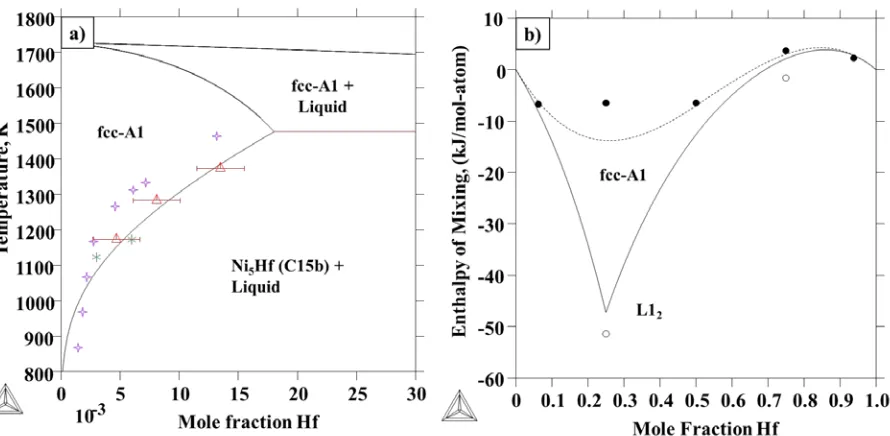
6.4.4 Hf solubility in fcc Ni and the L12 phase
The Ni-rich portion of the Hf-Ni phase diagram displaying equilibrium between the fcc solution
phase and Ni7Hf2 phase from 800 K to 1600 K with experiments from this work and work by
Hajjaji[10] and Wang[7] is given in Figure 8a. The solubility measurements in this work were
larger than the solubility measured by Hajjaji[10]. This may be due to the Zr present in the
samples but it may also be due the heat treatment by Hajjaji[10] which was not stated. If these
heat treatment times were sufficiently small it may be that the experiments did not quite reach
equilibrium. Indeed, heat treatments of 1200 and 1440 hours by Wang et al.[7] yield solubility
measurements close to the present results. Hence, the present fitting was performed only with
respect to the experiments in this work.
The fit to SQS calculations along with the calculated metastable diagram resulting from this
paper’s fitting is given in Figure 8b. The asymmetric mixing did not require major modification
during solubility fitting and the L12 enthalpy with respect to the fcc phase was replicated to a
reasonable degree without 𝛼𝛼 terms. This asymetric mixing is consistent with the chemically
similar Ni-Ti[49] and Ni-Zr[50] models, each of which has a more negative mixing enthalpy on
the Ni-rich portion of the diagram.
6.4.5 The bcc-A2 and B2 phases
Given the confirmation of the B2 phase by high-temperature synchrotron, the high temperature
NiHf phase phase was modeled with this crystal structure with a transition temperature of 1433
K in accordance with DSC and high temperature Synchrotron data. A plot of the phase diagram
containing the high temperature B2 phase is given in Figure 7 from 45 to 75 at.% Hf. The
20 Good agreement is found with the surrounding transition temperatures and experimental liquidus
obtained. Good agreement is also found with DTA data from Svechinkov[11] and from
Yeremenko[3] near 50 at.% Hf. However, there are unaccounted transitions in the present
description between the NiHf phase and the NiHf2 phase. It is likely that this is caused by a
wider solubility range for Ni in this phase at higher temperatures. Since this could not be
confirmed it was not addressed further here. The calculated value for the transition from B33 to
B2 was 1420 K which falls close to the measured value of 1433 K by DSC and synchrotron data
in this work.
A plot of the mixing enthalpies resulting from SQS calculations and the metastable diagram
bcc-B2 diagram is given in Figure 9a and b, respectively. A fit of the bcc mixing enthalpy was not
possible simultaneously with the B2 enthalpy with respect to the bcc end-members and the
modeled liquidus.
7 Conclusions
A thorough investigation into the nickel-rich portion of the Hf-Ni system is performed using both
first-principles calculations and experiments. New experiments are made using HfNi with
relatively low Zr contamination (0.25 wt. % Zr in the starting Hf). Diffusion couple experiments
are carried out at 1173, 1273, and 1373 K to confirm the phase stability observed in previous
experiments and to measure the Hf solubility in fcc Ni. This solubility is of key importance to
understanding and predicting the Hf activity in Ni-rich alloys containing Hf as a component to
improve the oxidation resistance of the alloy. CALPHAD modeling is carried out using phase
stability data from these diffusion couples and from the literature, thermochemical data in the
literature and calculated thermochemical data from first-principles calculations. The resulting
21 First-principles thermochemical data at 0K and finite temperatures provided a physical basis for
the modeling of experimentally observed phases and unstable phases having the L12 crystal
structure. This description of the L12 phase in this system is important for extrapolations into
higher-order systems. Special quasi-random structures are used to obtain mixing enthalpies in
the fcc and B2 systems.
The stability of the B2 phase is also important to oxidation resistant alloys given the prominence
of the B2-NiAl phase in high-temperature alloys and coatings. The stability is investigated using
DSC to confirm the presence of a high temperature phase and high-temperature synchrotron
experiments to confirm that the crystal structure of this phase is B2 above the transition
temperature. DSC results found a high temperature transition at 1433 K and HEXRD
experiments confirmed this phase to be the B2 phase – although the exact nature of the
transformation still warrants investigation. This is significant since it represents the first time the
B2 phase in the Hf-Ni system has been observed experimentally to the knowledge of the authors.
Previously, the B2 phase was only suggested to form a solid solution with the B2-NiTi phase
from DSC measurements. However, previous experiments could not directly observe the B2
phase due to symmetry changes caused by quenching in samples rich in Hf. Special
quasi-random structures are subsequently used to model the bcc phase and the B2 phase is modeled as
a solution phase in tandem with modeling of the bcc phase. The stability range of the B2 phase
fit using first-principles will provide important groundwork for future databases built to design
shape-memory alloys and high temperature coatings.
References
22 4, pp. 660–68, Apr. 2003.
[2] G. . Firstov, J. Van Humbeeck, and Y. . Koval, “Comparison of high temperature shape memory behaviour for ZrCu-based, Ti–Ni–Zr and Ti–Ni–Hf alloys,” Scr. Mater., vol. 50, no. 2, pp. 243–248, Jan. 2004.
[3] V. N. Yeremenko, E. L. Semenova, L. A. Tretyachenko, and V. M. Petyukh, “Constitution of the Hf-Ni system up to 50 at.% Ni,” J. Alloys Compd., vol. 191, no. 1, pp. 117–119, Jan. 1993.
[4] Y. Kim and R. Ashbrook, “Directionally solidified pseudo-binary eutectics of Ni-Cr-(Hf, Zr),” 1975.
[5] V. Khorunov, V. Ivanchenko, and V. Kvasnitskij, “Structure and phase composition of Ni-Cr-Zr and Ni-Cr-Hf alloys used as brazing alloys,” Avtom. Svarka, 1999.
[6] A. Berche, J. C. Tédenac, and P. Jund, “Phase diagram and enthalpy of formation of Hf-Ni-Sn,” Comput. Mater. Sci., vol. 125, pp. 271–277, Dec. 2016.
[7] T. Wang, Z. Jin, and J.-C. Zhao, “Experimental study and reassessment of the Ni-Hf binary system,” Zeitschrift für Met., vol. 92, no. 5, pp. 441–446, 2001.
[8] C. Zhang, J. Zhu, Y. Yang, H.-B. Cao, F. Zhang, W.-S. Cao, and Y. A. Chang,
“Thermodynamic modeling and experimental investigation of the Ni-rich corner of the Ni?Al?Hf system,” Intermetallics, vol. 16, no. 2, pp. 139–147, Feb. 2008.
[9] X. Yang, C. Pin, and A. Fane, “Separation of hafnium from zirconium by extraction chromatography with liquid anionic exchangers,” J. Chromatogr. Sci., 1999.
[10] M. Hajjaji, “Solid solubility of hafnium in nickel,” J. Alloys Compd., vol. 274, no. 1–2, pp. 185–188, 1998.
[11] V. N. Svechnikov, A. K. Shrin, and G. P. Dmitriyeva, “The Hafnium-Nickel Equilibrium Diagram,” Izv. Akad. Nauk SSSR, Met., vol. 6, pp. 176–179, 1967.
[12] L. Bsenko, “The Hf-Ni and Zr-Ni systems in the region 65 – 80 at.% Ni,” J. Less Common Met., vol. 63, no. 2, pp. 171–179, 1979.
[13] N. Selhaoui, J. C. Gachon, and J. Hertz, “Enthalpies of formation of some solid hafnium nickel compounds and of the Ni-Rich HfNi liquid by direct reaction calorimetry,” Metall.
Trans. B, vol. 23, no. 6, pp. 815–819, 1992.
[14] L. Bencze and K. Hilpert, “Thermochemistry of the Ni-Hf system—Intermetallic phases,”
Metall. Mater. Trans. A, vol. 27, no. 11, pp. 3576–3590, 1996.
[15] D. Shin, R. Arróyave, and Z.-K. Liu, “Thermodynamic modeling of the Hf–Si–O system,”
Calphad, vol. 30, no. 4, pp. 375–386, Dec. 2006.
[16] Q. Guo and O. J. Kleppa, “Standard Enthalpies of Formation of Ni3V, Ni3Hf, PdsHf, and Pt3Sc and Systematics of AHof for Ni3Me (Me = La, Hf, Ta), Pd3Me (Me,” J. Phys.
Chem., vol. 99, no. 9, pp. 2854–2856, Mar. 1995.
[17] Q. Guo and O. J. Kleppa, “Standard enthalpies of formation of some alloys formed between group IV elements and group VIII elements, determined by high-temperature direct synthesis calorimetry,” J. Alloys Compd., vol. 269, no. 1–2, pp. 181–186, 1998. [18] V. N. Yeremenko, E. L. Semenova, L. a. Tretyachenko, and V. M. Petyukh, “Constitution
of the Hf-Ni system up to 50 at.% Ni,” Journal of Alloys and Compounds, vol. 191, no. 1. pp. 117–119, 1993.
[19] V. V. Sudavtsova, N. V. Podoprigora, and M. A. Shevchenko, “Thermodynamic
23 [20] N. V. Podoprigora and V. S. Sudavtsova, “Thermodynamic properties of liquid alloys of
the Ni-Hf system,” Russ. Metall., vol. 2009, no. 2, pp. 107–112, 2009.
[21] V. Sudavtsova and N. Sharkina, “Interaction in liquid alloys of Fe–Hf and Ni–Hf systems,” Neorg. Mater, 1998.
[22] G. Kresse and J. Furthmüller, “computer code VASP, Vienna, Austria, 1999,” Comput. Mater. Sci, 1996.
[23] O. Levy, G. L. W. Hart, and S. Curtarolo, “Hafnium binary alloys from experiments and first principles,” Acta Mater., vol. 58, no. 8, pp. 2887–2897, 2010.
[24] N. N. Eremenko, E. L. Semenova, L. A. Tret’yachenko, and V. . Petyukh, “Reaction of equiatomic binary compounds in ternary systems formed by group-IV transition metals with nickel,” Inorg. Mater., vol. 28, pp. 923–927, 1992.
[25] P. Nash and D. R. F. West, “Phase equilibria in Ni-rich region of Ni–Cr–Hf system,” Met. Sci., vol. 15, no. August, pp. 347–352, Aug. 1981.
[26] P. Nash and D. R. F. West, “Phase equilibria in Ni-rich region of Ni-AI-Hf system,” Met. Sci., vol. 15, no. August, pp. 347–352, 1981.
[27] Z.-K. Liu, “First-Principles Calculations and CALPHAD Modeling of Thermodynamics,”
J. Phase Equilibria Diffus., vol. 30, no. 5, pp. 517–534, Sep. 2009.
[28] M. Hillert, Phase equilibria, phase diagrams and phase transformations: their
thermodynamic basis. 2007.
[29] M. Hillert, “The compound energy formalism,” J. Alloys Compd., vol. 320, no. 2, pp. 161–176, May 2001.
[30] K. Lee and P. Nash, “The Al-Hf-Ni system (Aluminum-Hafnium-Nickel),” J. phase equilibria, 1991.
[31] I. Ansara, N. Dupin, H. L. Lukas, and B. Sundman, “Thermodynamic assessment of the Al?Ni system,” J. Alloys Compd., vol. 247, no. 1–2, pp. 20–30, Jan. 1997.
[32] N. Dupin, I. Ansara, and B. Sundman, “Thermodynamic re-assessment of the ternary system Al-Cr-Ni,” Calphad, vol. 25, no. 2, pp. 279–298, Jun. 2001.
[33] I. Ansara, N. Dupin, H. L. Lukas, and B. Sundman, “Thermodynamic assessment of the AlNi system,” J. Alloys Compd., vol. 247, no. 1–2, pp. 20–30, Jan. 1997.
[34] N. Dupin, I. Ansara, and B. Sundman, “Thermodynamic Re-Assessment of the Ternary System Al-Cr-Ni,” Calphad, vol. 25, no. 2, pp. 279–298, 2001.
[35] A. Kusoffsky, N. Dupin, and B. Sundman, “On the compound energy formalism applied to fcc ordering.,” Calphad, vol. 25, no. 4, pp. 549–565, Dec. 2001.
[36] J. P. Perdew, K. Burke, and M. Ernzerhof, “Generalized Gradient Approximation Made Simple,” Phys. Rev. Lett., vol. 77, no. 18, pp. 3865–3868, Oct. 1996.
[37] G. Kresse, M. Marsman, and J. Furthmuller, “VASP the Guide,”
http://cms.mpi.univie.ac.at/vasp/vasp/vasp.html, 2016. [Online]. Available:
http://cms.mpi.univie.ac.at/vasp/vasp/vasp.html. [Accessed: 01-Jan-2017].
[38] S. L. Shang, Y. Wang, D. Kim, and Z. K. Liu, “First-principles thermodynamics from phonon and Debye model: Application to Ni and Ni3Al,” Comput. Mater. Sci., vol. 47, no. 4, pp. 1040–1048, 2010.
[39] Y. Wang, Z. K. Liu, and L. Q. Chen, “Thermodynamic properties of Al, Ni, NiAl, and Ni3Al from first-principles calculations,” Acta Mater., vol. 52, no. 9, pp. 2665–2671, 2004.
24
Appl. Phys. Lett., vol. 90, no. 10, p. 101909, Mar. 2007.
[41] C. Jiang, C. Wolverton, J. Sofo, L.-Q. Chen, and Z.-K. Liu, “First-principles study of binary bcc alloys using special quasirandom structures,” Phys. Rev. B, vol. 69, no. 21, p. 214202, Jun. 2004.
[42] C. Wolverton, “Crystal structure and stability of complex precipitate phases in Al–Cu– Mg–(Si) and Al–Zn–Mg alloys,” Acta Mater., vol. 49, no. 16, pp. 3129–3142, Sep. 2001. [43] C. Jiang, L.-Q. Chen, and Z.-K. Liu, “First-principles study of constitutional point defects
in B2 NiAl using special quasirandom structures,” Acta Mater., vol. 53, no. 9, pp. 2643– 2652, May 2005.
[44] “Materials Preparation Center, Ames Laboratory USDOE, Ames IA, USA.” .
[45] J. L. Liu, L. L. Zhu, X. M. Huang, G. M. Cai, and Z. P. Jin, “Investigation of the phase equilibria in Ti-Ni-Hf system using diffusion triples and equilibrated alloys,” Calphad, vol. 58, pp. 160–168, Sep. 2017.
[46] L. A. Bendersky, A. Roytburd, and W. . Boettinger, “Transformation of BCC and B2 High Temperature Phases to HCP and Orthorhombic structures in the Ti-Al-Nb System. Part I: Microstructural Predictions Based on a Subgroup relation between phases,” J. Res. Natl.
Inst. Stand. Technol., vol. 98, pp. 561–583, 1993.
[47] J.-O. Andersson, T. Helander, L. Höglund, P. Shi, and B. Sundman, “Thermo-Calc & DICTRA, computational tools for materials science,” Calphad, vol. 26, no. 2, pp. 273– 312, Jun. 2002.
[48] A. D. Pelton, S. A. Degterov, G. Eriksson, C. Robelin, and Y. Dessureault, “The modified quasichemical model I—Binary solutions,” Metall. Mater. Trans. B, vol. 31, no. 4, pp. 651–659, Aug. 2000.
[49] W. J. Zhu, L. I. Duarte, and C. Leinenbach, “Experimental study and thermodynamic assessment of the Cu–Ni–Ti system,” Calphad, vol. 47, pp. 9–22, Dec. 2014.
[50] N. Wang, C. Li, Z. Du, and F. Wang, “Experimental study and thermodynamic re-assessment of the Ni–Zr system,” Calphad, vol. 31, no. 4, pp. 413–421, Dec. 2007. [51] N. Selhaoui, J.-C. Gachon, and J. Hertz, “Enthalpies of formation of some solid hafnium
nickel compounds and of the Ni-Rich HfNi liquid by direct reaction calorimetry,” Metall.
Trans. B, vol. 23, no. 6, pp. 815–819, Dec. 1992.
25
[image:27.612.73.542.150.452.2]Required Figures and Tables
Table 1. Calculated entropies at 298.15 K, 𝑆𝑆298.15, and enthalpies of formation at 298.15 K,
Δ𝐻𝐻298.15𝐾𝐾. Comparison is made to calculated values by Berche et al. [6]
Phase Volume ΔH
(kJ/mole-atom)
ΔH[6]
(kJ/mole-atom)
𝑆𝑆298.15
(J/mole-atom∙K)
Ni (fcc-A1) 0 -- --
Ni5Hf (C15b) -33.67 -33.65 27.4825
Ni7Hf2 -45.18 -45.10 --
Ni7Hf3 -48.88 -48.71 --
NiHf (B33) -50.00 -50.06 38.8575
NiHf (B2) -41.77 -- 40.29
NiHf2 -32.88 -32.85 51.5817
Hf (fcc-A1) -- --
Hf (hcp-A3) 0 0 38.8683
Ni3Hf (L12) -51.41 -- 29.0286
26 Table 2. Calculated enthalpies of mixing for the fcc-A1, bcc-A2, and B2 solutions.
ΔH (kJ/mole-atom) ΔH (kJ/mole-atom)
Ni32Hf1 (bcc-A2) -9.13 Ni32Hf1 (fcc-A1) -6.75
Ni0.75Hf0.25 (bcc-A2) -17.06 Ni0.75Hf0.25 (fcc-A1) -6.45
Ni0.5Hf0.5 (bcc-A2) -8.81 Ni0.5Hf0.5 (fcc-A1) -6.46
Ni0.25Hf0.75 (bcc-A2) -8.06 Ni0.25Hf0.75 (fcc-A1) 3.65
Ni1Hf32 (bcc-A2) -1.30 Ni1Hf32 (fcc-A1) 2.24
NiHf (B2) -55.15 Ni3Hf (L12) -49.68
Ni0.5(Hf0.5Ni0.5)0.5 (bcc-B2)
-29.94 NiHf3 (L12) 3.59
Hf0.5(Hf0.5Ni0.5)0.5 (bcc-B2)
27 Table 3: Phases of the Ni-rich half of the HfNi system observed after annealing of the
Ni/HfNi diffusion couples. Phases observed in these experiments are marked “x”. T (K) 1123[7] 1173[7] 1173[present] 1373[present]
Ni x x x x
HfNi5 x x x x
Hf2Ni7 x x x x
HfNi3 x x x x
Hf3Ni7 x
Hf7Ni10 x x x x
Hf9Ni11 x x x x
28 Figure 1. Micrograph and composition profile obtained from Ni/HfNi diffusion couple annealed
29 Figure 2. (a) DSC thermogram of the equiatomic Hf-Ni alloy, plotted from data collected during
heating and cooling at 10 K/min; (b) temperature-dependent diffractogram plotted from the
HEXRD data. The vertical lines indicate the Bragg peaks in Q-space, while the line colors
indicate the peak intensities. A powder pattern of the low temperature HfNi is superimposed on
the HEXRD plot in order to accentuate the appearance of the peaks corresponding to the B2
30 Figure 3. Formation enthalpy of compounds at 0K by first-principles and at 298 and 1418 K as calculated from the present model. Comparison is made to experiments with reported error bars by at 1418 K by Bencze[14] ( ), 1477 K by Guo[16], [17] ( ), and at 1323 K by Selhaoui[51] (
33 Figure 6. Thermochemical calculations in the liquid phase: a) the molar enthalpy of mixing at 1770 K compared to experiments by Podoprigora and Sudavtsova[19], [20] at 1770 K ( ) and Sudavtsova[21] at 1877 K ( ) and thesis work cited by Podoprigora and
34 Figure 7. Hf-Ni phase diagram from 300 to 3000 K plotted with DTA data by Svechnikov et al.[11]( ) DTA data, two phase observations, and single phase observations by

![Figure 5. Calculated Ni activies from this work at 1418 and 1523 K compared to measurements by Bencze[14] ( ) with a Ni reference state of fcc at the given temperature in each case](https://thumb-us.123doks.com/thumbv2/123dok_us/8122814.239912/34.612.75.513.74.285/figure-calculated-activies-compared-measurements-bencze-reference-temperature.webp)
![Figure 6. Thermochemical calculations in the liquid phase: a) the molar enthalpy of mixing at 1770 K compared to experiments by Podoprigora and Sudavtsova[19], [20] at 1770 K ( ) and Sudavtsova[21] at 1877 K ( ) and thesis work cited by Podoprigora and Sudavtsova[19], [20] ( ) b) calculated partial molar enthalpy of mixing compared to Podoprigora and Sudavtsova at 1770 K[19], [20] ( ) and c) calculated molar enthalpy of mixing (*with respect to solid hcp Hf and liquid Ni) at 1743 K compared to data by Selhaoui[13] at this temperature ( )](https://thumb-us.123doks.com/thumbv2/123dok_us/8122814.239912/35.612.76.547.87.526/thermochemical-calculations-experiments-podoprigora-podoprigora-sudavtsova-podoprigora-sudavtsova.webp)
 DTA data, two phase observations, and single phase observations by](https://thumb-us.123doks.com/thumbv2/123dok_us/8122814.239912/36.612.81.483.73.467/figure-phase-diagram-plotted-svechnikov-observations-single-observations.webp)