R E S E A R C H A R T I C L E
Open Access
Refining developmental coordination disorder
subtyping with multivariate statistical methods
Christophe Lalanne
1,2*, Bruno Falissard
2,3, Bernard Golse
2,4,5and Laurence Vaivre-Douret
2,4,5,6Abstract
Background: With a large number of potentially relevant clinical indicators penalization and ensemble learning methods are thought to provide better predictive performance than usual linear predictors. However, little is known about how they perform in clinical studies where few cases are available. We used Random Forests and Partial Least Squares Discriminant Analysis to select the most salient impairments in Developmental Coordination Disorder (DCD) and assess patients similarity.
Methods: We considered a wide-range testing battery for various neuropsychological and visuo-motor impairments which aimed at characterizing subtypes of DCD in a sample of 63 children. Classifiers were optimized on a training sample, and they were used subsequently to rank the 49 items according to a permuted measure of variable importance. In addition, subtyping consistency was assessed with cluster analysis on the training sample. Clustering fitness and predictive accuracy were evaluated on the validation sample.
Results: Both classifiers yielded a relevant subset of items impairments that altogether accounted for a sharp discrimination between three DCD subtypes: ideomotor, visual-spatial and constructional, and mixt dyspraxia. The main impairments that were found to characterize the three subtypes were: digital perception, imitations of gestures, digital praxia, lego blocks, visual spatial structuration, visual motor integration, coordination between upper and lower limbs. Classification accuracy was above 90% for all classifiers, and clustering fitness was found to be satisfactory. Conclusions: Random Forests and Partial Least Squares Discriminant Analysis are useful tools to extract salient features from a large pool of correlated binary predictors, but also provide a way to assess individuals proximities in a reduced factor space. Less than 15 neuro-visual, neuro-psychomotor and neuro-psychological tests might be required to provide a sensitive and specific diagnostic of DCD on this particular sample, and isolated markers might be used to refine our understanding of DCD in future studies.
Background
Neuropsychological and psychiatric studies often involve a large collection of testing instruments, each aiming to assess more or less specific facets of one’s behavo-rial and psychological profile. The number of available cases appears rather small (n < 60) in some cases, due to the low prevalence of the outcome of interest and/or costs associated to data collection. In such a situation, it becomes critical to select the most relevant items to the study at hand which amounts to find a good compro-mise between screening efficacy or diagnostic accuracy,
*Correspondence: [email protected]
1AP-HP, Department of Clinical Research, Saint-Louis Hospital, Paris, France 2Inserm Unit UMR-SO 669, University Paris Sud, Paris Descartes, Paris, France Full list of author information is available at the end of the article
consulting time, and availability of dedicated testing bat-teries. Another concern is that researchers typically want to assess what best characterize clinical subgroups and how homogeneous they are. The present study aims at performingfeature extraction, that is selecting the most informative items, when diagnosing dyspraxia in children during planned clinical examination. A second objective is to show that there exist specific impairments that are relevant and consistent within clinical subgroups; in other words, we seek to build atypology of the patients.
Clinical subtyping of developemental coordination disorder
With a prevalence up to 10% worldwide (higher in boys), developmental coordination disorder (DCD) constitutes
a major challenge from a public health perspective as it may lead to learning difficulties, behavioral disor-der, or social and emotional maladaptation. Dyspraxic patients are usually screened based on their impairments in motor coordination or usual visuo-motor and neu-ropsychological tests batteries [1,2], and are often cat-egorized as patients suffering from DCD [3]. However, the DSM-IV-R criteria remain vague with regard to the exact nature of those impairments and the relevance and consistency of dyspraxia subtyping within DCD cate-gory. Previous approaches mainly relied on cluster anal-ysis to refine the distinction, although the number of reported subtypes generally varied between three and six [2,4-8]. This heterogeneous clustering is attributable in part to the difference in the testing material (e.g., Bru-ininksOseretsky Test of Motor Proficiency, BOTMP, or Movement Assessment Battery for Children, M-ABC) used in these studies, but more importantly to the fact that they largely focused on coordination and motor performance in relation to learning. As pointed out by Wilson [9], a normative functional skill approach suffers from the selection of tasks that are not necessarily rep-resentative of the various facets of motor control and movement skills, such that “a multi-level approach to assessment and treatment is recommended for children with DCD. The use of multiple and converging measures will circumvent existing issues with diagnosis and pro-mote a fuller appreciation of motor development at dif-ferent levels of function–behavioural, neurocognitive, and emotional” (p. 819).
In a recent study, Vaivre-Douret and coll. [10] pro-vided a more detailed account of children exhibit-ing different types of sensory-motor deficit by usexhibit-ing a broader testing battery. These authors systematically assessed academic, language, cognitive, visual-spatial, and visual-motor perception skills, while using additional standardized neuro-developmental psychomotor tests, including motor coordination, visual, and neuro-muscular tone examination. It was concluded that ‘pure’ forms of developmental dyspraxia—ideomotor and visual-spatial/visual-constructional—may be distinct from spe-cific motor coordination disorder, and more frequently associated to various neuropsychological disorders and soft neurological signs. A ‘mix’ group exhibiting spe-cific motor coordination disorders with a large number of learning disorders was isolated from these two ‘pure’ forms. Moreover, it was suggested that motor planning and programming appear to be the core problem under-lying children difficulties, and not performance per se. The implications of these findings from an etiological standpoint goes beyond the scope of the present article, and the interested reader is referred to the above arti-cle for a more in-depth discussion. The above results will be used to refine neuro-visual, neuro-psychomotor and
neuro-psychological markers that are characteristic of this three-subtype classification.
Statistical approaches for feature extraction
A crucial aspect of explanatory statistical inference in this context is that we need methods that allow to deal with categorical outcomes and to weigh a large num-ber of potentially correlated predictors while preventing from overfitting. We will here focus on two multivariate statistical techniques that seem to meet these two criteria. As an extension to classification and regression trees
(CART), Leo Breiman proposed the Random Forests
(RF) algorithm which retains many benefits of decision trees while achieving better results and competing with penalized SVM, Neural Networks or Gradient Boosting Machines [11,12]. The RF algorithm is built upon the gen-eral framework of Bagging [13]: It relies on resampling via the boostrap procedure but add an extra randomization step at the level of the variables. As such it overcomes the limitations of linear classifiers and yield an ensemble of unpruned trees that achieve a good balance between bias and variance.
Another method which might also be applied with a low ratio of samples (n) to potentially correlated variables (p) is Partial Least Square Discriminant Analysis (PLS-DA). This is a regression method that seeks to sharpen the separation between groups of observations while con-structing maximally covarying linear combinations of the original predictors. It has been successfully used in pro-teomic studies [14] or microarray expression data [15]. Although PLS regression might be directly applied when
the number of variables p is greater than the number
of observations n, several methods for variable ranking [16,17] and selection [18,19] have been proposed (for a review, [20]), it is also possible to consider a more parci-monious model by adding constraints during parameter estimation. Regularization or so-called “shrinkage” meth-ods consider a weighted variance-covariance matrix, as in ridge regression [21]. While reducing their variance, it also increases the bias of the parameter estimates. An alternative penalization scheme is theelastic netcriterion proposed by Zou and Hastie [22]. Following their nota-tions, it is defined as the argument that minimizes, over the vector of parametersβ, the following loss function:
L(λ1,λ2,β)= Y−Xβ2+λ2β2+λ1β1,
on the SIMPLS algorithm [24], although by settingλ2 = ∞there remains only two tuning parameters, the number
of hidden componentsKand the thresholding parameter
λ1. An alternative formulation of Lasso (L1) penalization was proposed by Lˆe Cao and coll. in related work [25]; specifically, the penalization now takes the form of a soft-thresholding rule applied on variable loadings during the iterative steps of the NIPALS algorithm [26].
In addition to protect against increased false posi-tive rate arising from multiple comparisons in univariate screening of interesting predictors, such embedded meth-ods have been proved to compete with wrapper methmeth-ods [27,28], and a recent study showed that sparse PLS and RF provide sensible and interpretable results with gene expression data [29].
The rest of this article is organised as follows: partici-pants and clinical assessment are described first, together with the estimation of model parameters and measures of variable importance; then we present the results obtained with RF and unpenalized or penalized PLS-DA; finally, these results are discussed in the context of DCD subtypes identified in [10].
Methods
Participants and testing material
The data are comprised of a set of N = 63 children (5
to 15 years old with a median age of 8.1 yrs., 83% of males). Patients were enrolled based on DSM-IV-R cri-teria: mild to moderate motor-coordination difficulties interfering with the performance of daily activities (cri-terion A), and with academic achievement (cri(cri-terion B). They were free of previous assessment, and no comorbidi-ties (e.g., ADHD, neurological disorder, visual or auditory deficit) were detected during first examination.
Following clinical examination detailed in [10], all patients were classified as suffering from either ideo-motor (IM), visual-constructional and spatial (VSC), or mixt (MX) dyspraxia. For each subject, binary-scored responses (0=success, 1=failure) based on percentile or SD thresholds were available for a set of 49 items covering visual, motor, perceptuo-motor, and general performance. Neuro-psychological assessment consisted in adminis-tering subtests of a standard Wechsler measure of intel-ligence, and standardized tests of visual constructional skills (block design), visual-spatial structuring (Rey’s geo-metric figures and Beery’s Visual-Motor Integration test), visual-spatial attention (bell-crossing test), mental execu-tive functions (Porteus Labyrinth and Tower of London test). A handwriting scale was also used to detect dysgra-phy, visual perception was assessed with form recognition tasks, and kinaesthetic perception (memory) was assessed by positioning child’s arm and finger and asking him with eyes closed to remember and repeat. A language screening battery included tasks of reading, repetition of words
and logatoms, picture-naming speed, meta-phonological tests, auditory memory and working memory tasks (digit span). Neuro-psychomotor assessment was based on the “neuro-psychomotor functions in children” battery (NP-MOT), which allows to measure developmental mat-uration of the following functions: neuromuscular exami-nation, gross motor-control tasks, laterality, praxis, digital gnosis, manual dexterity, body spatial integration, rhyth-mic tasks, auditory-attentional task [30]. Finally, neuro-visual examination included electro-retinogram, neuro-visually evoked potentials and motor electro-oculogram.
For clarity purpose, the full set of items has been abbre-viated using four-letter acronyms (see List of abbrevia-tions used).
This study was conducted by Inserm Unit 669 in the out-patient consultation of the Child Psychiatry Depart-ment, Necker Hospital, Paris. Institutional review board approval was obtained for the clinical investigations, and this study is in compliance with the ethical principles for medical research as presented in the Helsinki Declaration. Written informed consent was obtained from the partici-pant (parents and children) for publication of this report and any accompanying images.
Statistical models
The RF algorithm can be summarized as follows. Given
ntreenumber of trees to grow andmtryvariables used to split each node:
1. Construct a bootstrap sample of sizen<N, with replacement, and start growing a tree for this sample. 2. When growing the tree, usemtryvariables selected
at random to find the best split.
3. Repeat the preceding step until the tree reaches its maximal extent (no pruning).
The PLS-DA classifier consists in a classical PLS regres-sion [26,31] where we seek to construct from the explana-tory blockX(of dimensionsn×p) a set ofK orthogonal orthogonal factors scores or latent variables, ξ1,. . .,ξK, with associated loadings, u1,. . .,uK, that maximize the covariance between X and an univariate or multivariate response blockY. LetY be a single vector of outcomes, this yields the following optimization problem:
max ||uk||=1
cov(Xk−1uk,Y),
whereXk−1 is the residual matrix in the regression ofY on ξk = Xkuk, for each componentk = 1,. . .,K. The sign and magnitude of theuk’s give an indication about the contribution of each variable in the construction of the components scores,ξk. In PLS-DA, the categorical out-come of interestYis recoded in a set of dummy variables
expressing individual class membership. Considering C
classes, we define an indicator matrixZbased onY
Zc=
1 ifY=yc, 0 otherwise,
and constructCclassification functions of the form
ˆ
Zc=b0,c+b1,cX1+ · · · +bp,cXp, c=1,. . .,C,
where thebi,c’s are the regression coefficients asssociated to thecth class.
Model calibration
The sample was divided into a training sample and a vali-dation sample, using a split ratio of 0.7/0.3. Model building and feature extraction were performed on the training sample only. The validation set was used to assess the predictive power of the models and clustering fitness.
Tuning of hyperparameters for RF (number of variables
used to build a single tree, mtry) and PLS-DA
(num-ber of dimensions,K, and/or sparsness parameter,η) was done using a nested cross-validation scheme, comprised of stratified and repeated 10×5-fold resampling (inner loop) combined to a search grid of length 10 for the hyper-parameters (outer loop). The number of trees considered in RF was kept constant (ntree=500). For sparse PLS-DA, we used a custom grid of tuning parameters with 10 uniformly spaced 0.3 < η < 0.9, for K ranging from 1 to 10. The criterion to select model parameter(s) was the average classification accuracy computed on hold-out samples across resampling results. Accuracies were compared between models using the method proposed in [32].
Variables scoring
For RF, we considered the mean decrease in accuracy to assess variable importance. For PLS-DA, items loadings
were used as overall (i.e., not class-specific) measures of variable importance for each of the extracted compo-nent. In both cases, the significance of all measures of variable importance was tested using a permutation strat-egy, whereby class labels were randomly exchanged and variable importance was recomputed on a total of 999 samples. For sparse PLS-DA, only 95% bootstrap confi-dence intervals associated to regression coefficients were computed.
Predictive accuracy
For thetraining sample, prediction of class membership was based on the internal voting scheme for RF, whereas for PLS-DA a softmax method was used, whereby the pre-dicted class,c∗, is the largest class probability after model predictions have been transformed on a [0,1] interval (with unit sum), that is
Y=yc where c∗= arg max
0≤Zc≤1,
Zc=1
(Zˆc).
For thevalidation sample, we computed classification accuracy based on the optimized model parameters.
Clustering fitness
The PAM algorithm[33] was used to identify one rep-resentative sample (“medoid”) for each cluster, based on the PLS components scores in the training sample. The number of clusters was determined by maximizing the overall average silhouette width (ASW). The stability of the resulting partition was assessed using the bootstrap procedure described in [34]: For each bootstrap sam-ple, Jaccard similarities between the original three-cluster solution and the one found on resampled data were aver-aged clusterwise. In addition, we verified whether cluster might be considered as isolated clusters (L- or L∗-cluster) or not. According to [33], a cluster is an L∗-cluster if and only if its diameter is smaller than its separation. A clus-ter is an L-clusclus-ter if and only if for each observationithe maximal dissimilarity between iand any other observa-tion of the cluster is smaller than the minimal dissimilarity betweeniand any observation of another cluster.
Cluster affinity was defined as the euclidean distance between each observation in the validation sample and its expected cluster medoid. This mimic the isolation mea-sure described above, though it is based on a distance and not a similarity measure.
Statistical software
All analyses were performed with the open-sourceR
soft-ware, version 2.12 [35], the randomForest, pls and
spls packages, and the caret interface for machine
Table 1 Descriptive statistics for the training and validation samples
Training Validation Combined
N N=46 N=17 N=63
Diagnosis: IM 63 9%( 4) 6%( 1) 8%( 5)
VSC 52%(24) 53%( 9) 52%(33)
MX 39%(18) 41%( 7) 40%(25)
Gender: Male 63 78%(36) 94%(16) 83%(52)
Age (years) 63 6.8 8.0 9.7 6.6 8.7 12.3 6.8 8.1 10.4
Term: Yes 63 96%(44) 88%(15) 94%(59)
FIQ 62 85 98 114 92 108 121 86 100 115
PIQ 62 73 87 102 75 93 107 74 90 105
VIQ 62 92 107 122 100 119 130 92 110 124
Three-number summaries are lower quartile, median, and upper quartile.
Nis the number of non–missing values.
Results
Patients characteristics
The main patients’ characteristics, including clinical diag-nosis, for the training (n= 46) and test (n= 17) samples are shown in Table 1. As described in the original article [10], patients were mostly 8 years old males, with full IQ in the expected range. Nine cases out of ten were diagnosed as suffering from either VSC or MX dyspraxia, whereas only five subjects were classified as IM-dyspraxic.
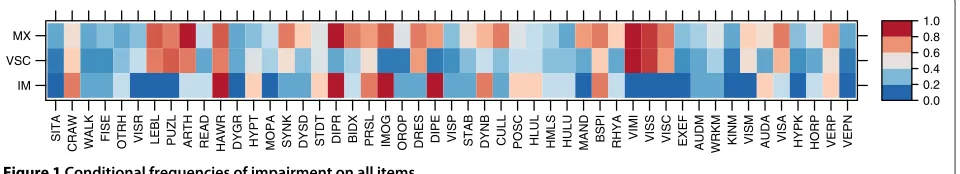
Interitem Pearson correlations were in the range [−0.411; 0.831] (median, 0.087). The marginal propor-tions of item failure were between 7.9% (Sitting alone) and 92.1% (Visual motor integration).
Item failures for the whole cohort are summarized in Figure 1 as a heatmap where higher relative frequencies of failure are indicated in red. As can be seen, there are systematic patterns of failure that are clearly visible for some groups, for example digital praxia (DIPR) in MX and IM patients, arithmetic (ARTH) in MX patients only, visual-motor integration (VIMI) in MX and VSC patients, or digital perception (DIPE) in IM patients only. Also, there are some evidence for covarying items scores: IM patients were not impaired on lego (LEBL) and puzzles (PUZL) tasks, nor any visuo-motor tasks (VIMI, VISS, VISC), whereas VSC patients show systematic failures on the latter.
The average level of success did not differ between the training and test samples on any of the studied variables (allp> 0.05, withp-values computed from Monte Carlo
χ2significance tests).
Model calibration Random forest
The number of variables retained for growing trees was estimated atmtry=12, yielding an optimal classification accuracy of 0.924 (SD 0.055). Of note, this value is near the recommended default value for this parameter (√49=7). For the final model, the OOB estimate highlighted an error rate of 8.7%, with 2 VSC (8.3%) and 2 MX (11.1%) missclassified patients on the training sample. An infor-mal look at the evolution of error rates as a function of the number of trees indicated that the OOB error was stabilized after 225 trees were grown.
PLS-DA
For standard PLS-DA, six components were selected for an average classification accuracy of 0.917 (SD 0.088). For penalized PLS-DA, the optimal parameters were found to
beK = 2 components andη = 0.7 for sparseness. This
resulted in a classification accuracy of 0.942 (SD 0.076), with only one missclassified VSC patient (4.2%). It should be noted that these two classification accuracies do not
IM VSC MX
SITA
CRAW WALK FISE OTRH VISR LEBL PUZL ARTH READ HAWR DYGR HYPT MOPA SYNK DYSD STDT DIPR BIDX PRSL IMOG
OROP DRES DIPE VISP STAB DYNB CULL POSC HLUL HMLS HULU MAND BSPI RHYA VIMI VISS VISC EXEF AUDM
WRKM KINM VISM AUDA VISA HYPK HORP VERP VEPN
0.0 0.2 0.4 0.6 0.8 1.0
differ one from the other (p= 0.346, with Bonferroni cor-rection), nor with classification accuracy estimated for RF (p= 0.491, for sPLS-DA).
Variable importance Random forest
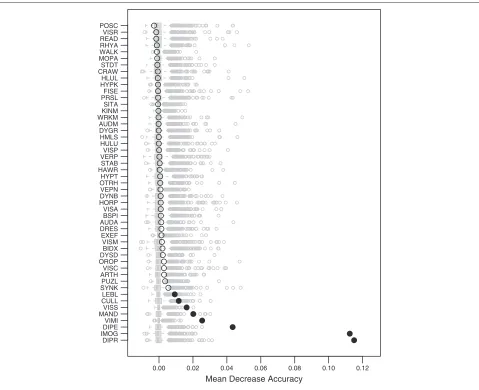
The importance of variables in RF, as measured by the mean decrease accuracy, are shown in Figure 2. The original estimates from the retained model during param-eters tuning are shown as black circles, and the impor-tance computed through re-randomization are shown as Tukey’s boxplots in grey color. Filled symbols indicate a significant permutation test at the 5% level. In this case, eight variables showed a consistent and significant contribution to overall accuracy on the training sample. These are, in decreasing order of magnitude: digital praxia (DIPR), imitation of gestures (IMOG), digital perception (DIPE), visual motor integration (VIMI), manual dexterity
(MAND), visual spatial structuration (VISS), coordination between upper and lower limbs (CULL), and lego blocks (LEBL). Class-specific measures of variable importance are also provided in Table 2.
PLS-DA
For PLS-DA, the following important variables were found, in decreasing order of magnitude (items found on more than one component are emphasized in italic
letters): (Component 2) visual spatial memory (VISM),
puzzles (PUZL), visual spatial constructional (VISC), visual spatial structuration (VISS), lego blocks (LEBL),
visual motor integration (VIMI); (Component 3)
pos-tural control (POSC), dynamic balance (DYNB),
stand-ing tone (STDT), kinaesthetic memory (KINM);
(Com-ponent 4) work memory (WRKM), auditivo
mem-ory (AUDM), first sentences(FISE), dysgraphia (DYGR);
(Component 5) postural control (POSC), hand writing
0.00 0.02 0.04 0.06 0.08 0.10 0.12
Mean Decrease Accuracy DIPR
IMOG DIPE VIMI MANDVISS CULL LEBL SYNK PUZL ARTHVISC OROP DYSD BIDX VISM EXEF DRES AUDA BSPI VISA HORP DYNB VEPN OTRH HYPT HAWR STAB VERPVISP HULU HMLS DYGR AUDM WRKMKINM SITA PRSL FISE HYPKHLUL CRAW STDT MOPA WALK RHYA READ VISR POSC
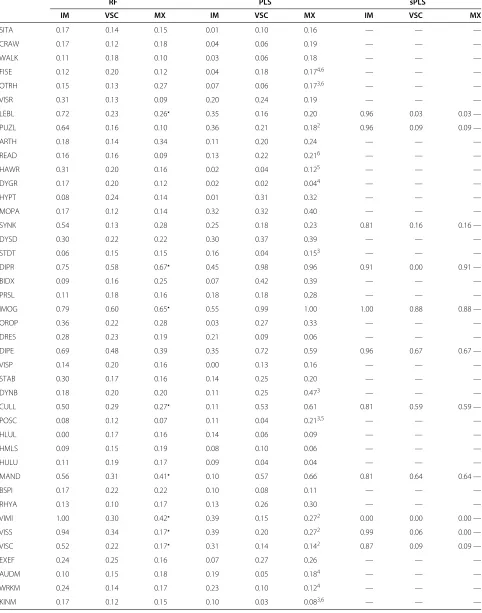
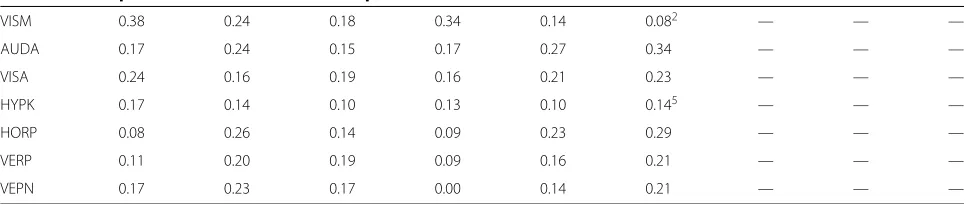
Table 2 Class-specific measures of variable importance for RF, PLS-DA and sPLS-DA
RF PLS sPLS
IM VSC MX IM VSC MX IM VSC MX
SITA 0.17 0.14 0.15 0.01 0.10 0.16 — — —
CRAW 0.17 0.12 0.18 0.04 0.06 0.19 — — —
WALK 0.11 0.18 0.10 0.03 0.06 0.18 — — —
FISE 0.12 0.20 0.12 0.04 0.18 0.174,6 — — —
OTRH 0.15 0.13 0.27 0.07 0.06 0.173,6 — — —
VISR 0.31 0.13 0.09 0.20 0.24 0.19 — — —
LEBL 0.72 0.23 0.26 0.35 0.16 0.20 0.96 0.03 0.03 —
PUZL 0.64 0.16 0.10 0.36 0.21 0.182 0.96 0.09 0.09 —
ARTH 0.18 0.14 0.34 0.11 0.20 0.24 — — —
READ 0.16 0.16 0.09 0.13 0.22 0.216 — — —
HAWR 0.31 0.20 0.16 0.02 0.04 0.125 — — —
DYGR 0.17 0.20 0.12 0.02 0.02 0.044 — — —
HYPT 0.08 0.24 0.14 0.01 0.31 0.32 — — —
MOPA 0.17 0.12 0.14 0.32 0.32 0.40 — — —
SYNK 0.54 0.13 0.28 0.25 0.18 0.23 0.81 0.16 0.16 —
DYSD 0.30 0.22 0.22 0.30 0.37 0.39 — — —
STDT 0.06 0.15 0.15 0.16 0.04 0.153 — — —
DIPR 0.75 0.58 0.67 0.45 0.98 0.96 0.91 0.00 0.91 —
BIDX 0.09 0.16 0.25 0.07 0.42 0.39 — — —
PRSL 0.11 0.18 0.16 0.18 0.18 0.28 — — —
IMOG 0.79 0.60 0.65 0.55 0.99 1.00 1.00 0.88 0.88 —
OROP 0.36 0.22 0.28 0.03 0.27 0.33 — — —
DRES 0.28 0.23 0.19 0.21 0.09 0.06 — — —
DIPE 0.69 0.48 0.39 0.35 0.72 0.59 0.96 0.67 0.67 —
VISP 0.14 0.20 0.16 0.00 0.13 0.16 — — —
STAB 0.30 0.17 0.16 0.14 0.25 0.20 — — —
DYNB 0.18 0.20 0.20 0.11 0.25 0.473 — — —
CULL 0.50 0.29 0.27 0.11 0.53 0.61 0.81 0.59 0.59 —
POSC 0.08 0.12 0.07 0.11 0.04 0.213,5 — — —
HLUL 0.00 0.17 0.16 0.14 0.06 0.09 — — —
HMLS 0.09 0.15 0.19 0.08 0.10 0.06 — — —
HULU 0.11 0.19 0.17 0.09 0.04 0.04 — — —
MAND 0.56 0.31 0.41 0.10 0.57 0.66 0.81 0.64 0.64 —
BSPI 0.17 0.22 0.22 0.10 0.08 0.11 — — —
RHYA 0.13 0.10 0.17 0.13 0.26 0.30 — — —
VIMI 1.00 0.30 0.42 0.39 0.15 0.272 0.00 0.00 0.00 —
VISS 0.94 0.34 0.17 0.39 0.20 0.272 0.99 0.06 0.00 —
VISC 0.52 0.22 0.17 0.31 0.14 0.142 0.87 0.09 0.09 —
EXEF 0.24 0.25 0.16 0.07 0.27 0.26 — — —
AUDM 0.10 0.15 0.18 0.19 0.05 0.184 — — —
WRKM 0.24 0.14 0.17 0.23 0.10 0.124 — — —
Table 2 Class-specific measures of variable importance for RF, PLS-DA and sPLS-DAContinued
VISM 0.38 0.24 0.18 0.34 0.14 0.082 — — —
AUDA 0.17 0.24 0.15 0.17 0.27 0.34 — — —
VISA 0.24 0.16 0.19 0.16 0.21 0.23 — — —
HYPK 0.17 0.14 0.10 0.13 0.10 0.145 — — —
HORP 0.08 0.26 0.14 0.09 0.23 0.29 — — —
VERP 0.11 0.20 0.19 0.09 0.16 0.21 — — —
VEPN 0.17 0.23 0.17 0.00 0.14 0.21 — — —
denote significant measure of variable importance in the PLS case, and upper script numbers indicate on which PLS component a variable was found significant at
the 5% level.
(HAWR), hyperkinesia (HYPK) (Component 6)
read-ing/spelling (READ), kinaesthetic memory (KINM),first
sentences(FISE), otorhinolaryngologia (OTRH). It should be noted that none of the variables reach the 5% signifi-cance level on the first component. Class-specific loadings are summarized in Table 2.
On the contrary, eleven variables were selected by sPLS-DA: lego blocks (LEBL), puzzles (PUZL), synki-nesia (SYNK), digital praxia (DIPR), imitation of ges-tures (IMOG), digital perception (DIPE), coordination between upper and lower limbs (CULL), manual dexterity (MAND), visual motor integration (VIMI), visual spa-tial structuration (VISS), and visual spaspa-tial constructional (VISC). This set of variables closely matched the one out-lined with RF method, and is a subset of the variables with highest loadings for the unpenalized PLS-DA approach. Variables loadings are given in Table 2 and regression coefficients with their associated 95% confidence intervals are displayed in Figure 3.
Predictive classification accuracy
Classification accuracy on the validation sample was per-fect in the case of RF, and identical for PLS and sPLS (0.941, 95% CI [0.713;0.999]), with only one VSC patient missclassified.
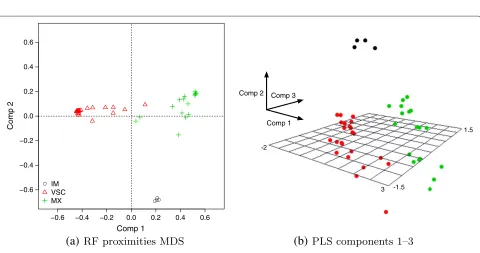
Projection of individuals in the feature space
Figure 4 shows individual locations in a reduced facto-rial space defined by multidimensional scaling applied to individual proximities computed from RF (Figure 4a), and projection of factor scores in the first three dimensions of PLS-DA (Figure 4b).
In the case of PLS-DA, the first component is deter-mined by an opposition between hypotonia (high negative loading) and manual tasks (imitation of gestures, digital praxia, digital perception, manual dexterity). The second axis is mainly driven by the same manual tasks, except manual dexterity, vs. visuo-spatial tasks (puzzles, visual spatial structuration, visual spatial memory). On the third axis, the same visuo-spatial and manual tasks have high
negative loadings while dynamic balance, motor pathways and auditivo memory have high positive values.
Patients typology
With component scores computed from the PLS-DA model, the optimal number of clusters was estimated at three, with an average silhouette width of 0.348. Although this is indicative of a weak clustering structure, the cross-classification of cluster and diagnosis classes was satis-factory: Two VSC patients were considered as belonging
to the cluster composed of MX patients only (n = 18).
When using bootstrap (500 samples), the clusterwise Jac-card similarity values were all above 0.5, except for the smaller cluster (Table 3).
For the penalized PLS-DA model, three clusters were identified by optimizing the average sihouette width (0.625). The clusterwise Jaccard bootstrap measures were all in the acceptable range (≥ 0.8), and 4 VSC patients were found in the cluster composed of MX patients.
Except for the minority cluster (IM), the representative individuals were different in the two PLS models.
Clustering fitness
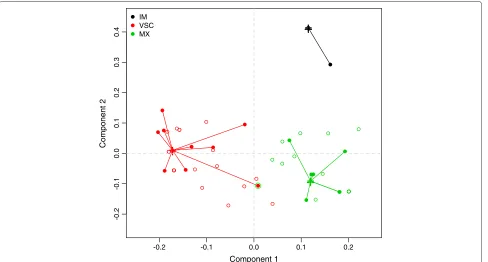
As can be seen in Table 3, the average euclidean distance of patients from the validation sample to their expected medoids (C1 to C3) was always less than the average dis-tance to other medoids, except for IM patients with PLS-DA. When considering sPLS-DA, the MX group appears to exhibit more compactness since it has the lowest aver-age distance measure. This is further illustrated in Figure 5 which shows patients’ location in the factor space defined by the two components of the sPLS-DA model. The mis-classified individual has been highlighted using a double circle.
Pattern of association between selected variables and clinical diagnosis
Estimate CULL
DIPE DIPR IMOG LEBL MAND PUZL SYNK VIMI VISC VISS
-0.4 -0.2 0.0 0.2 0.4
IM CULL
DIPE DIPR IMOG LEBL MAND PUZL SYNK VIMI VISC VISS
VSC CULL
DIPE DIPR IMOG LEBL MAND PUZL SYNK VIMI VISC VISS
MX
Figure 3Sparse PLS-DA regression coefficients with associated 95% confidence intervals computed usingB=1, 000bootstrap samples.
−0.6 −0.4 −0.2 0.0 0.2 0.4 0.6 −0.6
−0.4 −0.2 0.0 0.2 0.4 0.6
Comp 1
Comp 2
IM VSC MX
Comp 1 Comp 3 Comp 2
-2
3 -1.5
1.5
(b)
(a)
Table 3 Measures of predictive accuracy and clustering fitness
Classifier Class Sensitivity Specificity ASW Isolation Jaccard C1 C2 C3
PLS-DA IM 1.00 1.00 0.625 L∗ 0.462 1.587 2.784 1.206
VSC 0.89 1.00 0.369 No 0.665 3.106 0.838 2.315
MX 1.00 0.90 0.270 No 0.605 2.811 2.416 0.587
sPLS-DA IM 1.00 1.00 1.000 L∗ 0.792 0.129 0.437 0.386
VSC 0.89 1.00 0.712 No 0.928 0.468 0.103 0.282
MX 1.00 0.90 0.479 No 0.854 0.487 0.330 0.073
L or L∗denotes isolated cluster (See text for details).
Figure 6, considering variables selected by RF and sPLS-DA on the training sample. The size of each ribbon reflects the strength of the association (i.e., cell counts in the cor-responding 7 or 11×3 table), while the outer segments indicate marginal frequencies. Such a picture offers an intuitive visualization of the following three main charac-teristics of task failure due to specific dyspraxia: (a) IM patients are equally impaired on digital perception (DIPE), imitations of gestures (IMOG), and digital praxia (DIPR), (b) some items are commonly found in both VSC and MX patients, that is lego blocks (LEBL), visual spatial structuration (VSS), and visual motor integration (VIMI), whereas (c) some items remain mostly specific of MX, and to a lesser extent VSC dyspraxia, namely digital praxia,
imitation of gestures, and more importantly coordination between upper and lower limbs (CULL) and digital per-ception (DIPE).
Of the 11 items isolated with sPLS-DA, IMOG and DIPE were found significantly associated with clinical diagnosis in the validation sample at a 5% Bonferroni-corrected level (0.05/11 = 0.0045). Thep-values for digital praxia and synkinesis were below 10%.
Discussion
The primary aims of this article were to determine the most relevant items for distinguinshing between three DCD subtypes, and to quantify the homogeneity of patients within each subtype. Two multivariate methods,
-0.2 -0.1 0.0 0.1 0.2
-0.2
-0.1
0.0
0
.1
0.2
0
.3
0.4
Component 1
Component 2
+
+
+
IM VSC MX
(b)
(a)
Figure 6Association between clinical group and variables ranked or selected as most important in RF and sPLS-DA.
RF and PLS-DA, were shown to be useful to select the most informative items from a large set of testing instru-ments with high sensitivity and specificity, while allowing to characterize a set of 63 patients from a multivariate perspective. Imposing sparsity when building PLS compo-nents led to more direct and interpretable results.
Interest of multivariate classification
Feature selection based on RF has been proposed in the past, including the use of permutation techniques. For example, Diaz-Uriarte and Alvarez de Andr´es [37] pro-posed a backward elimination algorithm to select relevant subset of genes based on variable importance. Using this
method, as implemented in the varSelFR R package,
with a slight different configuration for RF (500 trees, but with themtryparameter set at its default value of√p), five variables were selected: digital perception (DIPE), dig-ital praxia (DIPR), imitation of gestures (IMOG), manual dexterity (MAND), and visual motor integration (VIMI). The .632+ Bootstrap estimate of prediction error was found to be 0.0713 (using 500 replicates), which is in close agreement with the prediction error observed on our training sample. It should be noted, however, that permut-ing clinical labels allows to verify the existence of a class structure in the dataset, not whether the classifier truly exploits items dependency [38].
Contrary to Robert-Grani´e et al.’s study [29], our results didn’t show a clear improvement of sparse PLS over
unpenalized PLS when predicting diagnostic classes, although they both yielded a consensual subset of impor-tant variables. This might be explained by the high signal-to-noise ratio for some of the neuro-psychological tests used in this study.
Another point that deserves some discussion con-cerns the choice of the metric used to quantify variable importance in PLS-DA. In this study, variable loadings were used as they reflect the “weight” of the variables when building component scores that maximize the dis-crimination among classes. Other measures of variable importance have been proposed, for example Variable Importance in Projection (VIP), but see [20] for a review. We found, however, that using VIP-based measures of variable importance yielded results in close agreement with the one reported in this study.
highlight higher-order interaction effects. However, PLS-DA was found to perform better overall for classification, as compared to RFs. The superiority of PLS-based clas-sifiers was also confirmed in presence of additive global noise on synthetic datasets, but its performance decreased when irrelevant features were added. Nevertheless, recur-sive feature elimination based on Gini importance can be used to remove features with non-discriminatory variance before applying a PLS-DA classifier. This suggests that depending on the structure of the data under considera-tion, a combined approach where RFs are used to perform dimensionality reduction and some form of regularization on input data before they enter a linear classifier or pro-jection to latent structures might a be viable alternative. Other interesting approaches have been proposed as well, for example Logic Regression [42] which also relies on the idea of bagging boolean trees to identify significant inter-actions among a set of descriptive binary variables, see also [43,44].
Finally, RF and PLS-DA provide efficient ways for visu-alizing how patients and variables cluster together when considering all variables at the same time (unlike uni-variate screening approaches), which has already been discussed by [45]. They both appear to nicely comple-ment each other. Looking at patients’ locations in the PLS factorial space leads to a more direct interpreta-tion of the relainterpreta-tionships between subjects and variables, or between variables themselves, since the latent dimen-sions extracted from PLS-DA are just linear combinations of the original variables. On the other hand, screening variables of interest through RF is relatively straightfor-ward, whereas relying on PLS-DA often means “reading” beyond the first dimension. For example, RF considered digital praxia and imitation of gesture as the two most important variables, whereas they were found on separate dimensions when using PLS-DA.
Clinical implications
The present findings are consistent with the previous observation that difficulties in planning and programming movement, rather than executive disorders, might partly be responsible for the observed typology in this sample of 63 children.
Indeed, our results confirmed the importance of some aspects of visual processing of spatial information and motor control in developmental coordination disorder and their subtle association in delineating DCD subtypes, as discussed in [10]. Digital praxia and imitation of ges-tures help distinguishing between visuo-constructional and spatial dyspraxia (no impairment) and ideomotor or mixt dypraxia, whereas visual motor integration and visual spatial structuration are more characteristic of the opposition between ideomotor dyspraxia (no impair-ment) and the two other subtypes. Hence, mixt dyspraxia
is characterized by the presence of disorders specific of VSC or IM dyspraxia, but further includes unique comorbidities such as problem in coordinating upper and lower limbs, poorer manual dexterity or synkinesia which could be specific markers of developmental coordination disorder.
When assessing only performance on motor coordina-tion in relacoordina-tion to learning development, it is likely that we would fail to identify associated non-verbal learn-ing disorders, as well as language or mathematics-related skills. Furthermore, as few or no gross motor skill dis-orders were found to be characteristic of VSC dyspraxia, this means that gross motor disorders are not necessar-ily associated with dyspraxia. The dissociation of such comorbid disorders was made possible because of the sys-tematic investigation of different cerebral functions from a psychological, psychomotor and neuro-visual viewpoint on a sample of children enrolled with strict inclusion criteria, hence the need for a multi-dimensional or multi-level assessment of these children [9,10].
Ideomotor patients appear more alike compared to VSC or MX patients, and they are impaired on fewer tasks overall. From a clinical perspective, it is interesting to note that misclassification was only observed for a VSC patient (considered as MX by the PLS classifier). A closer inspection of his medical record further indicated that he suffered from a discrete hemiplegia implying left dysadi-adochokinesis, impaired digital praxia, but with normal visual perception.
might generalize beyond the sample enrolled in this study is a critical issue. While our methodology was devised so as to limit the risk of overfitting during model selection, our low sample size offers only a limited way to investigate model performance and cluster stability. An external val-idation study with a larger sample of children, free of any comorbidities, would be needed to confirm the relevance of the highlighted markers.
However, such results could be used to drive more focused investigations of motor control and sensorimotor integration in DCD children; this potentially includes the collection of physiological and cognitive measures when children perform controlled motor tasks, analysis of eye movements dynamics and eye-hand coordination, longi-tudinal follow-up, etc. As pointed out in the introduction, there is a need for a fairly extensive assessment of dif-ferent cerebral functions, or a multi-level approach of assessment as suggested by Wilson [9].
Conclusions
Multidimensional assessment of learning disabilities appears of great interest for the medical community. The statistical analysis of such multivariate and possibly irregular (i.e., few observations, high number of vari-ables) datasets is challenging, but ensemble methods and dimension-reduction techniques can be successfully used to screen variables of interest and assess groupwise clus-tering profile.
In a sample of 63 children diagnosed as suffering from developmental dyspraxia, these methods provide a concise depiction of two types of pure dyspraxia (ideomotor and visual-spatial/visual-constructional) that are well characterized in the spatial and visual-motor domain, and a third type of dyspraxia (mixt dys-praxia) which features specific comorbidities in addition to impairments shared with the two other types.
Abbreviations
SITA, Sitting alone; CRAW, Crawling; WALK, Walking alone; FISE, First sentences (language); OTRH, Otorhinolaryngologia; VISR, Visual refraction; LEBL, Lego blocks; PUZL, Puzzles; ARTH, Arithmetic; READ, Reading/spelling; HAWR, Hand writing; DYGR, Dysgraphia; HYPT, Hypotonia; MOPA, Motor pathway; SYNK, Synkinesis; DYSD, Dysadiadochokinesis; STDT, Standing tone; DIPR, Digital praxia; BIDX, Bimanual dexterity; PRSL, Praxia slowness; IMOG, Imitation of gestures; OROP, Orofacial praxia; DRES, Dressing skill; DIPE, Digital perception; VISP, Visual perception; STAB, Static balance; DYNB, Dynamic balance; CULL, Coordination between upper and lower limbs; POSC, Postural control; HLUL, Homogeneity tonic laterality upper/lower limbs; HMLS, Homogeneity manual laterality spontaneous psychomotor; HULU, Homogeneity usual laterality upper/lower limbs; MAND, Manual dexterity; BSPI, Body spatial integration; RHYA, Rhythmic adaptation; VIMI, Visual motor integration; VISS, Visual spatial structuration; VISC, Visual spatial constructional; EXEF, Executive function; AUDM, Auditivo memory; WRKM, Work memory; KINM, Kinaesthetic memory (perception); VISM, Visual spatial memory; AUDA, Auditivo attention; VISA, Visual spatial attention; HYPK, Hyperkinesia; HORP, Horizontal pursuit; VERP, Vertical pursuit; VEPN, Visual evocated potentials (neurovisual).
Competing interests
The authors declare that they have no competing interests.
Authors’ contributions
CL designed the statistical study, performed the analysis of data and contributed to their interpretation. LVD was in charge of data collection and clinical assessment. LVD, BG, and BF have made substantial contributions to the interpretation of the data and writing of the manuscript. All authors read and approved the final manuscript.
Acknowledgements
This study has received support from University Paris Descartes, under the head of “Collaborative projects 2011”. CL would like to thank Max Kuhn and Kjell Johnson for helpful discussion about PLS-DA. The authors wish to thank the reviewers for their constructive comments.
Author details
1AP-HP, Department of Clinical Research, Saint-Louis Hospital, Paris, France. 2Inserm Unit UMR-SO 669, University Paris Sud, Paris Descartes, Paris, France. 3AP-HP, Paul Brousse Hospital, Public Health Department, Villejuif, France. 4AP-HP, Necker-Enfants Malades Hospital, Paris, France.5University Paris
Descartes, Sorbonne Paris Cit´e, France.6AP-HP, Port Royal-Cochin Hospital,
Dept. Obstetrics & Gynecology, Paris, France. Received: 12 October 2011 Accepted: 24 June 2012 Published: 26 July 2012
References
1. Missiuna C, Polatajko H:Developmental dyspraxia by any other name: are they all just clumsy children?Am J Occup Ther1995,49(7):620–627. 2. Hoare D:Subtypes of Developmental Coordination Disorder.Adapted
Phys Act Quaterly1994,11:158–169.
3. Polatajko H, Fox M, Missiuna C:An international consensus on children with developmental coordination disorder.Can J Occup Ther1995,
62:3–6.
4. Macnab J, Miller L, Polatajko H:The search for subtypes of DCD : Is cluster analysis the answer?Human Movement Sci2001,
20:49–72.
5. Wright H, Sugden D:The nature of developmental coordination disorder: inter- and intragroup differences.Adapted Phys Activities Quarterly1996,13:357–371.
6. Dewey D, Kaplan B:Subtyping of developmental motor deficits.Dev Neuropsychology1994,10(3):265–284.
7. Miyahara M:Subtypes of students with learning disabilities based upon gross motor functions.Adapted Phys Activities Quarterly1994,
11:368–382.
8. Lyytinen H, Ahonen T:Developmental motor problems in children: a 6-year longitudinal study.J Clin Exp Neuropsychology1988,10:57. 9. Wilson P:Practitioner Review: Approaches to assessment and
treatment of children with DCD: an evaluative review.J Child Psychology and Psychiatry2005,46(8):806–823.
10. Vaivre-Douret L, Lalanne C, Ingster-Moati I, Boddaert N, Cabrol D, Dufiera JL, Golse B, Falissard B:Subtypes of Developmental Coordination Disorder: Research on their nature and etiology.Dev Neuropsychology
2011,36(5):614–643.
11. Breiman L:Random Forests.Machine Learning2001,45:5–32. 12. Cutler A, Cutler D, Stevens J:Tree-based methods.InHigh-Dimensional
Data Analysis in Cancer Research. Edited by Li X, Xu R: Springer; 2009:83–101.
13. Breiman L:Bagging predictors.Machine Learning1996,26:123–140. 14. Musumarra G, Barresi V, Condorelli D, Fortuna C, Scir`e S:Potentialities of
multivariate approaches in genome-based cancer research: identification of candidate genes for new diagnostics by PLS discriminant analysis.J Chemom2004,18:125–132.
15. P´erez-Enciso M, Tenenhaus M:Prediction of clinical outcome with microarray data: a partial least squares discriminant analysis (PLS-DA) approach.Human Genet2003,112(5-6):581–592. 16. Palermo G, Piraino P, Zucht H:Performance of PLS regression
coefficients in selecting variables for each response of a multivariate PLS for omics-type data.Adv App Bioinf Chem2009,2:57–70.
17. Wold S, Sj ¨ostr ¨om M, Eriksson L:PLS-regression: a basic tool of chemometrics.Chemom Intell Lab Syst2001,58:109–130. 18. Gauchi J, Chagnon P:Comparison of selection methods of
manufacturing process data.Chemom Intell Lab Syst2001,
58(2):171–193.
19. Alsberg B, Kell D, Goodacre R:Variable Selection in Discriminant Partial Least-Squares Analysis.Anal Chem1998,70:4126–4133. 20. Lˆe Cao KA, Le Gall C:Integration and variable selection of ‘omics’ data
sets with PLS: a survey.J de la Soci´et´e Franc¸aise de Statistique2011,
152(2):77–96.
21. Hoerl A, Kennard R:Ridge regression: Applications to nonorthogonal problems.Technometrics1970,12:69–82.
22. Zou H, Hastie T:Regression and variable selection via the elastic net.
J R Stat Soc: Ser B2005,67:301–320.
23. Chun H, Keles¸ S:Sparse partial least squares regression for simultaneous dimension reduction and variable selection.J R Stat Soc: Ser B2010,72:3–25.
24. de Jong S:Simpls: an alternative approach to partial least squares regression.Chemom Intell Lab Syst1993,18:251–263.
25. Lˆe Cao KA, Rossouw D, Robert-Grani´e C, Besse P:A sparse PLS for variable selection when integrating omics data.Stat Appl Genet Mol Biol2008,7:Article 35.
26. Wold H:Estimation of Principal Components and Related Models by Iterative Least Squares. New York: Academic Press; 1966.
27. Guyon I, Gunn S, Nikravesh M, Zadeh, LA (Eds):Feature Extraction: Foundations And Applications: Springer-Verlag; 2006.
28. Schwender H, Ickstadt K, Rahnenf ¨uhrer J:Classification with high-dimensional genetic data: Assigning patients and genetic features to known classes.Biometrical J2008,50(6):911–926. 29. Robert-Grani´e C, Lˆe Cao KA, SanCristobal M:Predicting qualitative
phenotypes from microarray data – the Eadgene pig data set.BMC Proc2009,3(Suppl 4):S13.
30. Vaivre-Douret L:Batterie d’ ´evaluation des fonctions
neuro-psychomotrices (NP-MOT) de l’ ´enfant [Tests battery of neuro-psychomotor functions in children (NP-MOT)].Paris, France: Editions du Centre de Psychologie Appliqu´ee2006.
31. Rosipal R, Kr¨amer:Overview and recent advances in partial least squares.InSubspace, Latent Structure and Feature Selection Techniques. Edited by Saunders C, Grobelnik M, Gunn S, Shawe-Taylor J: Springer; 2006:34–51.
32. Hothorn T, Leisch F, Zeileis A, Hornik K:The Design and Analysis of Benchmark Experiments.J Comput Graphical Stat2005,14(3):675–699. 33. Kaufman L, Rousseeuw P:Finding groups in data: an introduction to cluster
analysis: Wiley Online Library; 1990.
34. Hennig C:Cluster-wise assessment of cluster stability.Comput Stat & Data Anal2007,52:258–271.
35. R Development Core Team:R: A language and environment for statistical computing.R Foundation for Statistical Computing, Vienna, Austria, ISBN 3-900051-07-02010. [http://www.R-project.org/] 36. Kuhn M:Building Predictive Models in R Using the caret Package.J
Stat Software2008,28(5).
37. D´ıaz-Uriarte R, Alvarez de Andr´es S:Gene selection and classification of microarray data using random forest.BMC Bioinf2006,7:3.
38. Ojala M, Garriga G:Permutation tests for studying classifier performance.J Machine Learning Res2010,11:1833–1863.
39. Han L, Embrechts M, Szymanski B, Sternickel K, Ross A:Random Forests Feature Selection with Kernel Partial Least Squares: Detecting Ischemia from MagnetoCardiograms.InProceedings of the European Symposium on Artificial Neural Networks. Burges, Belgium; 2006:221–226. 40. Ram´ırez J, G ´orriz J, Segovia F, Chaves R, Salas-Gonzalez D, L ´opez M,
´Alvarez I, Padilla P:Computer aided diagnosis system for the Alzheimer’s disease based on partial least squares and random forest SPECT image classification.Neurosci Lett2010,
472:99–103.
41. Menze B, Kelm B, Masuch R, Himmelreich U, Bachert P, Petrich W, Hamprecht F:A comparison of random forest and its Gini importance with standard chemometric methods for the feature selection and classification of spectral data.BMC Bioinf2009,10:213.
42. Ruczinski I, Kooperberg C, et al.:Exploring interactions in
high-dimensional genomic data: an overview of logic regression, with applications.J Multivariate Anal2004,90:178–195.
43. Wolf B, Slate E, Hill E:Logic Forest: An ensemble classifier for discovering logical combinations of binary markers.Bioinformatics
2010,26(17):2183–2189.
44. Schwender H, Ickstadt K:Identification of SNP Interactions Using Logic Regression.Biostatistics2007,9:187–198.
45. Le Cao K, Boitard S, Besse P:Sparse PLS Discriminant Analysis: biologically relevant feature selection and graphical displays for multiclass problems.BMC Bioinf2011,12:253.
doi:10.1186/1471-2288-12-107
Cite this article as:Lalanneet al.:Refining developmental coordination dis-order subtyping with multivariate statistical methods.BMC Medical Research Methodology201212:107.
Submit your next manuscript to BioMed Central and take full advantage of:
• Convenient online submission
• Thorough peer review
• No space constraints or color figure charges
• Immediate publication on acceptance
• Inclusion in PubMed, CAS, Scopus and Google Scholar
• Research which is freely available for redistribution