www.biogeosciences.net/11/2465/2014/ doi:10.5194/bg-11-2465-2014
© Author(s) 2014. CC Attribution 3.0 License.
Biogeosciences
Revisiting the CO
2
“source” problem in upwelling areas – a
comparative study on eddy upwellings in the South China Sea
N. Jiao1,2, Y. Zhang1,2, K. Zhou1, Q. Li1, M. Dai1, J. Liu1,2, J. Guo1,2, and B. Huang1
1State Key Laboratory of Marine Environmental Sciences, Xiamen University, Xiamen 361101, China 2Institute of Marine Microbes and Ecospheres, Xiamen University, Xiamen 361101, China
Correspondence to: N. Jiao ([email protected])
Received: 31 July 2013 – Published in Biogeosciences Discuss.: 13 August 2013 Revised: 12 March 2014 – Accepted: 14 March 2014 – Published: 6 May 2014
Abstract. The causes for a productive upwelling region to be
a source of CO2are usually referred to the excess CO2
sup-plied via upwelling of high dissolved inorganic carbon (DIC) from deep water. Furthermore, we hypothesize that microbial activity plays a significant role on top of that. To test this hy-pothesis, multiple biogeochemical parameters were investi-gated at two cyclonic-eddy-induced upwelling sites, CE1 and CE2, in the western South China Sea. The data showed that upwelling can exert significant influences on biological activ-ities in the euphotic zone and can also impact on particulate organic carbon (POC) export flux depending on upwelling conditions, such as the magnitude, timing, and duration of nutrient input and consequent microbial activities. At CE2, the increase of phytoplankton biomass caused by the up-welled nutrients resulted in increase of POC export flux com-pared to non-eddy reference sites, while at CE1 the microbial respiration of organic carbon stimulated by the upwelled nu-trients significantly contributed to the attenuation of POC ex-port flux. These results suggest that on top of upwelled DIC, microbial activities stimulated by upwelled nutrients and la-bile organic carbon produced by phytoplankton can play a critical role for an upwelling area to be outgassing or up-taking CO2. We point out that even though an upwelling
re-gion is outgassing CO2, carbon sequestration still takes place
through the POC-based biological pump as well as the re-fractory dissolved organic carbon (RDOC)-based microbial carbon pump.
1 Introduction
Upwelling is an oceanographic phenomenon that can bring nutrient- and dissolved inorganic carbon (DIC)-rich sub-thermocline water upwards and thus can lead to ecosys-tem biogeochemical responses (Mann and Lazier, 2006). Cy-clonic eddies elevate isopycnals in the upper ocean to induce upwelling-like motion to varying degrees (Sweeney et al., 2003), and thus provide diverse scenarios for studies on sub-sequent biogeochemical responses. Note that here we term in a broad sense the eddy-induced upward motion as upwelling. Some studies have reported eddy-induced upwelling areas to be sinks of atmospheric CO2 associated with enhanced
export flux of particulate organic carbon (POC) (Beaulieu, 2002; Honjo et al., 1999; McGillicuddy et al., 1998, 2003; Newton et al., 1994; Siegel et al., 1999; Benitez-Nelson et al., 2007; O’Brien et al., 2013). Other studies suggest that eddies make a minor contribution to regional biogeochem-ical budgets (Oschlies and Garçon, 1998; Oschlies, 2002), and upwelling areas can be CO2 outgassing (Rosón et al.,
1999; Chen et al., 2007). The recognized fact is that upwelled DIC-rich deep water through isopycnals elevation could re-lease CO2 and ultimately result in outgassing (Burt et al.,
2013). However, microbial contributions to such outgassing have not yet been fully elucidated.
extremely low (Takahashi and Bienfang, 1983) unless they are aggregated (Richardson and Jackson, 2007). Instead, they are effectively grazed by Protozoa within the microbial loop (Azam et al., 1983; Glover et al., 1988). Eddy lifespan is an-other controlling factor on the extents of biological response and associated export flux, as nutrient injection would sub-side as the eddy begins to decay (Sweeney et al., 2003). De-spite these significant recognitions, one issue has not yet been elucidated: While eddy-induced nutrient supply to surface waters increases primary production, elevated nutrient levels and consequently enhanced primary production could also stimulate microbial heterotrophic metabolisms that influence carbon respiration (Jiao et al., 2011) as well as carbon se-questration through the microbial carbon pump (MCP) (Jiao et al., 2010). Given that microbes are major contributors to both community respiration (CO2source) (∼50 to>90 %;
Rivkin and Legendre, 2001; Robinson and Williams, 2005) and refractory dissolved organic carbon (RDOC) (CO2sink)
as the output of the MCP (Benner and Herndl, 2011), micro-bial activities remain the key aspect to be addressed in this regard. We therefore hypothesize that upwelling can either increase or decrease POC export flux depending on the en-vironmental conditions and nature of microbial activity, and thus can significantly influence the dynamics of air–sea CO2
exchanges. To test and verify this hypothesis, we conducted a comparative study with systematic biogeochemical observa-tions in two comparable cyclonic eddies in the South China Sea (SCS) simultaneously, aiming at linking microbial ac-tivities under different environmental conditions to the POC export through the BP and RDOC production by the MCP, which would have an important implication in examining the CO2 outgassing scenarios in upwelling areas so as to better
understand the mechanisms and variability of the marine car-bon sink.
2 Material and methods
2.1 Study sites
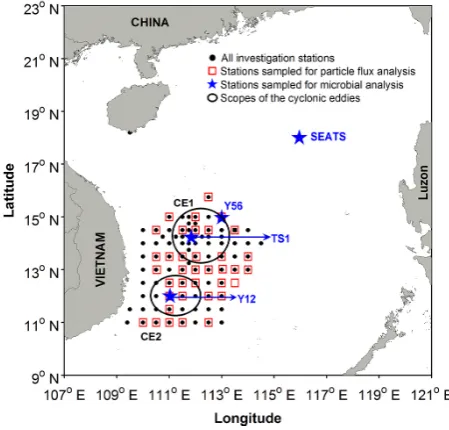
[image:2.595.314.539.64.279.2]In the study area of the western SCS, two well-developed cold-core cyclonic eddies (CE1 and CE2) were identi-fied and documented by Acoustic Doppler current profiler (ADCP) data and negative sea-level anomaly during the GOE-2 cruise (on board RV Dongfanghong #2, 14 Au-gust to 14 September 2007) (Zhang et al., 2009, 2011a; Hu et al., 2011). The satellite altimetric history (http://eddy. colorado.edu/ccar/data_viewer/index) suggested intensifica-tion of CE1 (decaying) and CE2 (young) during our sam-pling. Biogeochemical surveys (Fig. 1) were carried out to localize the eddies. For particle flux analysis, thirty-seven sites were sampled. Biological measurements and incuba-tions were conducted at four representative sites: TS1, Y12, Y56 and SEATS. TS1 and Y12 were located in the center of CE1 and CE2, respectively, and the Y56 site at the CE1
Fig. 1. Location of the study sites in the South China Sea. CE1:
cold-core cyclonic eddy #1; CE2: cold-core cyclonic eddy #2. St. SEATS represents the Southeast Asia Time Series Station.
boundary. The SEATS site is the Southeast Asia Time Se-ries Study station, which is an outside-eddy site monitoring background levels (Zhang et al., 2009) (Fig. 1).
2.2 Biogeochemical parameters
A SeaBird CTD-General Oceanic rosette sampler with Go-Flo bottles (SBE 9/17 plus, SeaBird Inc., USA) was used to record temperature and salinity and to collect water sam-ples. Samples for inorganic nutrients (nitrate+nitrite, phos-phate, silicate) were filtered through 0.45 µm cellulose ac-etate filters and measured immediately onboard using a flow injection analyzer (Tri-223 autoanalyzer) and standard spec-trophotometric methods (Su-Cheng et al., 1990). Oxygen concentrations were determined on board using the Win-kler method (Carpenter, 1965). Apparent oxygen utilization (AOU) and oxygen saturation (OS2)were estimated based on in situ O2, temperature and salinity (Garcia et al., 2006). The
2.3 Phytoplankton analysis
Samples for photosynthetic pigments analysis were collected on 0.7 µm pore-size GF/F filters (Whatman). Photosyn-thetic pigments were extracted in N,N-dimethylformamide (Furuya et al., 1998) and analyzed using reverse phase HPLC on a C8 column and a modification of the method of Mantoura and Llewellyn (1983) and Van Heukelem et al. (2001), including peridinin, fucoxanthin, 190
-but-fucoxanthin, 190-hex-fucoxanthin, neoxanthin,
prasinoxan-thin, violaxanprasinoxan-thin, alloxanprasinoxan-thin, lutein, zeaxanprasinoxan-thin, chloro-phyllb, divinyl-chlorophylla, and total chlorophylla. Based on the pigment data, phytoplankton community composi-tion was analyzed using CHEMTAX, including dinoflagel-lates, diatoms, haptophytes_4, haptophytes_3, chlorophytes, cryptophytes, Prochlorococcus, Synechococcus and prasino-phytes (Mackey et al., 1996).
2.4 234Th analysis and particle flux estimation
Total thorium-234 was determined using a small volume (2 or 4 L) MnO2co-precipitation method (Benitez-Nelson et al.,
2001; Buesseler et al., 2001; Cai et al., 2006). Beta counting of234Th was carried out using a gas-flow proportional low-level beta counter (Model GM-25-5, RISØ National Labo-ratory, Denmark). Total234Th activity was calculated after recovery calibration and corrections from decay and234Th ingrowth from dissolved238U according to Cai et al. (2006).
238U activity was calculated from the following equation: 238U(dpm L−1)=0.07081×salinity (Chen et al., 1986). (1)
Export flux of 234Th was determined through 234Th /238U disequilibria under the assumptions of steady state and no physical horizontal transport. Particle organic carbon (POC) export flux was determined according to the ratio of POC to
234Th (Buesseler et al., 2006; Savoye et al., 2006), using the
following equation:
POC flux=234Th flux×(POC/234Th) (Buesseler et al., 2006). (2)
2.5 Heterotrophic microbial abundance, production
and respiration estimates
Microbial abundance was determined by epifluorescence microscopy. Samples were stained with 40,60 -diamidino-2-phenylindole (DAPI) and counted under a Zeiss Axioplan 2 epifluorescence microscope. To determine heterotrophic microbial production, water samples were incubated with [3H]leucine (10 nM final concentration; 65 Ci mmol−1, Amersham) at in situ temperature. The disintegrations per minute (DPM) were counted in a liquid scintillation counter and converted into leucine incorporation rates (Kirchman and Wheeler, 1998).
Microbial respiration rates were estimated indirectly. As the term “bacterial respiration (BR)” is more commonly used
in research literature to refer to respiration by microbes, here we have designated BR to refer to microbial respiration. Likewise, the terms “bacterial growth rate (BG)”, “bacterial growth efficiency (BGE)” are used correspondingly. BR=(BG×ICF×CCF)(1/BGE−1) (3) (Mourinõ-Carballido, 2009),
where BG can be obtained by the [3H]-thymidine or [3 H]-leucine technique; ICF and CCF are the isotope and carbon conversion factors; here, we used the ICF reported in Pacific by Kirchman (1992) (0.108×10¹⁸ cells mol−1of incorpo-rated leucine), the CCF of 20 fg C cell−1(Lee and Fuhrman, 1987) and the BGE reported for open ocean regions (0.08; Robinson, 2008).
2.6 pCO2determination and air–sea CO2
flux estimation
Surface waterxCO2(the mole fraction concentration of CO2
in the dried sample gas flow) was measured using a LI-COR 7000 nondispersive infrared spectrometer coupled to a gas– water equilibrator according to Zhai et al. (2005). The water temperature and salinity right before the equilibration cham-ber was recorded by YSI®temperature and salinity sensors. Meteorological data was obtained from the onboard weather station. The partial pressure of CO2of the surface water at
the temperature of equilibration [pCO2 (eq), units: µatm],
the partial pressure of CO2at the in situ temperature [pCO2
(water), units: µatm], the partial pressure of CO2in the air
[pCO2(air), units: µatm] and the air–sea CO2flux were
esti-mated according to Zhai et al. (2005). Temperature corrected pCO2 were estimated according to Takahashi et al. (1993).
A positive value of air-sea CO2 flux indicates a transfer of
CO2from water to the atmosphere. Gas transfer velocity was
calculated from wind speeds. The relationship of gas transfer velocity with wind speed proposed by Sweeney (2007) was used to estimate the value of air–sea CO2flux.
2.7 Statistical analysis
Since normal distribution of the individual data sets was not met, we used the non-parametric Kruskal–Wallis test for comparison of variables between sites by SPSS software.
3 Results and discussion
3.1 Upwelling of nutrient supply to the euphotic zone and biological responses
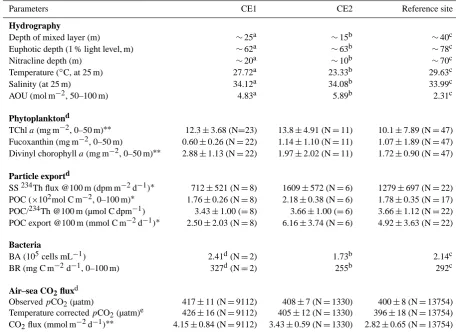
Table 1. Hydrographic characteristics, phytoplankton, particle export parameters, bacterial abundance and respiration and air–sea CO2flux in CE1, CE2 and surrounding waters. CE1: cyclonic eddy #1; CE2: cyclonic eddy #2. TChla: total chlorophylla; SS: stable state; POC: particle organic carbon; BA: bacterial abundance; BR: bacterial respiration rate. Non-parametric Kruskal–Wallis test was used for comparison of variables between sites.
Parameters CE1 CE2 Reference site
Hydrography
Depth of mixed layer (m) ∼25a ∼15b ∼40c
Euphotic depth (1 % light level, m) ∼62a ∼63b ∼78c
Nitracline depth (m) ∼20a ∼10b ∼70c
Temperature (◦C, at 25 m) 27.72a 23.33b 29.63c
Salinity (at 25 m) 34.12a 34.08b 33.99c
AOU (mol m−2, 50–100 m) 4.83a 5.89b 2.31c
Phytoplanktond
TChla(mg m−2, 0–50 m)∗∗ 12.3±3.68 (N=23) 13.8±4.91 (N=11) 10.1±7.89 (N=47) Fucoxanthin (mg m−2, 0–50 m) 0.60±0.26 (N=22) 1.14±1.10 (N=11) 1.07±1.89 (N=47) Divinyl chorophylla(mg m−2, 0–50 m)∗∗ 2.88±1.13 (N=22) 1.97±2.02 (N=11) 1.72±0.90 (N=47)
Particle exportd
SS234Th flux @100 m (dpm m−2d−1)∗ 712±521 (N=8) 1609±572 (N=6) 1279±697 (N=22) POC (×102mol C m−2, 0–100 m)∗ 1.76±0.26 (N=8) 2.18±0.38 (N=6) 1.78±0.35 (N=17) POC/234Th @100 m (µmol C dpm−1) 3.43±1.00 (=8) 3.66±1.00 (=6) 3.66±1.12 (N=22) POC export @100 m (mmol C m−2d−1)∗ 2.50±2.03 (N=8) 6.16±3.74 (N=6) 4.92±3.63 (N=22)
Bacteria
BA (105cells mL−1) 2.41d(N=2) 1.73b 2.14c
BR (mg C m−2d−1, 0–100 m) 327d(N=2) 255b 292c
Air–sea CO2fluxd
ObservedpCO2(µatm) 417±11 (N=9112) 408±7 (N=1330) 400±8 (N=13754) Temperature correctedpCO2(µatm)e 426±16 (N=9112) 405±12 (N=1330) 396±18 (N=13754) CO2flux (mmol m−2d−1)∗∗ 4.15±0.84 (N=9112) 3.43±0.59 (N=1330) 2.82±0.65 (N=13754)
aData from the CE1 center site TS1;bData from the CE2 center site Y12;cData from the reference site SEATS;dData were mean±SD (standard deviation)
from the CE1 and CE2 regions and the reference sites of surrounding waters;eNormalized to the arithmetical average of underway SST (28.716◦C);∗∗P <0.01; ∗P <0.05.
cases (Table 1; Fig. 2). Consequently, the nutrients injected into the nutrient-depleted euphotic zone effectively stimu-lated phytoplankton growth as indicated by the increase of chlorophyll a concentration (Table 1, Fig. 3a). The total chlorophylla maximum values at the eddy central sites of CE1 (TS1) and CE2 (Y12) were 0.65 and 0.75 µg L−1, re-spectively, while only 0.46 and 0.35 µg L−1at the CE1 pe-riphery site Y56 and the reference site SEATS, respectively. Interestingly, while nitrogen and phosphorus were depleted in the surface 50 m at both CE1 and CE2, silicate at CE1 seemed to be in relative abundance compared to CE2 (Fig. 2). Photosynthetic pigments analysis indicated that the domi-nant autotrophs at CE1 were cyanobacteria rather than di-atoms as occurred at CE2 (Table 1, Fig. 3b and c), suggest-ing that diatoms in CE1 were surpassed by cyanobacteria and not well developed, allowing extra silicate to be left over in the environment. Alternatively, a diatom bloom had de-cayed, and silicate was present from dissolution. Therefore,
Fig. 2. Depth profiles of nutrient concentration averaged over
[image:5.595.305.549.63.168.2]re-spective stations inside and outside the eddies and the reference site (St. SEATS). Value “0” means below the detection limit of the stan-dard spectrophotometric methods. Error bars indicate stanstan-dard de-viations.
Fig. 3. Depth profiles of phytoplankton pigments at the eddy
cen-ters (TS1 and Y12), the eddy edge (Y56) and the reference site (St. SEATS). Data are the average values over time series analysis at St. TS1 (N=6) and SEATS (N=7). Error bars indicate standard deviations. TChla: total chlorophylla.
the middle euphotic zone (50 m) occurred at varying levels of abundance among the upwelling sites (CE1 boundary>CE1 center>CE2 center) (Table 1) similar to Prochlorococcus (Fig. 3b), rather than to diatoms (Fig. 3c) (also see Sect. 3.3).
3.2 Responses of POC export flux
Total 234Th activities varied with depth ranging from 0.42±0.06 dpm L−1at 2 m to 2.78±0.08 dpm L−1at 100 m in the entire study area. The mean values of234Th activi-ties at 100 m of CE1, CE2, and surrounding non-eddy sites were 2.45, 2.41 and 2.32 dpm L−1, respectively (Fig. 4). The largest disequilibrium between234Th and its parent238U oc-curred at the upper euphotic zone of CE2, indicating it as the site of highest particle export. In contrast, the smallest ex-port signals were observed in CE1 (Fig. 4). The POC fluxes at 100 m estimated through the234Th activity showed a simi-lar pattern in that the highest and lowest POC fluxes occurred in CE2 (6.16±3.74 mmol C m−2d−1)and CE1 (2.50±2.03 (mmol C m−2d−1), respectively. Independent samples t test (p <0.05) analysis suggests that the difference in POC flux between CE1 and CE2 is significant (Table 1). Such differ-ence is consistent with the differdiffer-ence in phytoplankton
com-Fig. 4. Depth profiles of234Th and238U activities averaged over respective stations inside and outside the eddies. Error bars indicate standard deviations.
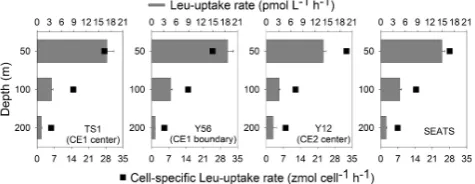
Fig. 5. Bulk leucine incorporation rates and cell-specific leucine
in-corporation rates at representative depths in the eddy centers (TS1 and Y12), the eddy edge (Y56) and the reference site (St. SEATS).
munity structure in that diatoms contribute more to POC ex-port fluxes at CE2 than at CE1.
3.3 Microbial respiration contributing to attenuation of
POC export and CO2outgassing
In order to test whether microbial activity significantly influ-enced POC export flux in the two eddy-induced upwelling ecosystems, microbial abundance and activity were investi-gated at two representative stations of CE1, one station of CE2, as well as at St. SEATS (Fig. 1). Generally, microbial abundance decreased dramatically with depth, but showed distinct differences between the four sites. At 50 m where upwelling impacts were significant, the highest abundance was observed in CE1, while the lowest abundance occurred in the center of CE2 (Table 1). Leucine uptake, as a mea-sure of microbial activity, decreased with depth by two or-ders of magnitude within 200 m (Fig. 5). As with abun-dance, microbial activities at 50 m depth were also higher at the two stations in CE1 (17.08 and 18.62 pmol L−1h−1
[image:5.595.309.547.228.320.2] [image:5.595.49.287.247.349.2]younger than CE1 as seen from the satellite altimetric his-tory. Thus, the microbial abundance in the shallow water of CE2 was likely diluted by deep water with low micro-bial abundance; however, cell activity could be stimulated by labile organic carbon which was released from enhanced phytoplankton biomass. In CE1, POC export flux was lowest whereas BR was highest, corresponding to the highest tem-perature correctedpCO2 (426±16 µatm) and air–sea CO2
flux (4.15±0.84 mmol m−2d−1)among all the investigation sites. This observation cannot be attributed to DIC release, as CE2 rather than CE1 exhibited the strongest upwelling and thus the strongest DIC release from sub-thermocline water as indicated by the mixed layer and nitracline depths (Table 1); however, the temperature corrected pCO2 (405±12 µatm)
and total CO2 outgassing (3.43±0.59 mmol m−2d−1) in
CE2 was found to be lower than CE1. That is, it was mi-crobial activity which did matter for the CO2outgassing in
this upwelling area. In fact, in CE1, the average carbon loss by microbial respiration was about eleven-fold the average POC export flux at 100 m (Table 1). The enhanced total mi-crobial activity could have consumed more organic carbon leading to lower POC export flux and higher CO2outgassing
in CE1 than the other sites (Table 1). The satellite altimetric and chlorophyll data series (http://gdata1.sci.gsfc.nasa.gov/ daac-bin/G3/batchDownload.cgi) suggested that the primary production at the initial stages of CE1 could be slightly lower than that of CE2, but this difference was not profound enough to cause the large difference in POC export between CE1 and CE2. It is most likely that upwelling induced nutrient input enhanced phytoplankton biomass and labile organic carbon release which then stimulated bacterial growth and respira-tion. Bacteria became more competent in attaching to and consuming POC and attenuating POC export flux. As for the case of CE2, a diatom-dominated community (Table 1), whose growth was induced by the nutrient supply, would be the main reason for the high POC export flux. Taken together, the intensity and age of the two eddies and the different re-sponses in phytoplankton community and microbial activity suggest that phytoplankton rapidly responded to upwelled nutrients, accumulating biomass and causing high POC ex-port at the initial intensification period (such as the case of the of CE2); bacteria were subsequently stimulated by nutri-ents and labile DOC produced by phytoplankton resulting in high respiration rates during the later intensification period (such as the case of of CE1).
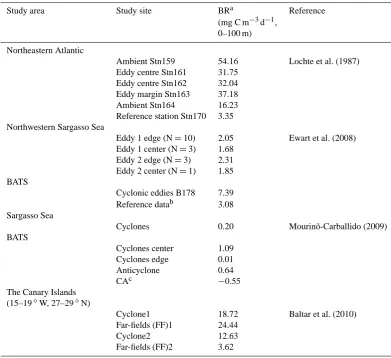
[image:6.595.312.541.62.226.2]It has also been reported that centers of cyclonic eddies in the northwestern subtropical Atlantic (Mouriño-Carballido, 2009) were associated with low net community production as the result of a noticeable increase in BR, although sev-eral observations have reported reduction in respiration rates in cyclonic eddies in the northeastern subtropical Atlantic (Gonzalez et al., 2001; Maixandeau et al., 2005). This was at-tributed to lower microbial abundance or lower maintenance respiration of heterotrophic microbes inside rather than out-side the cyclonic eddy (Gonzalez et al., 2001). Although low
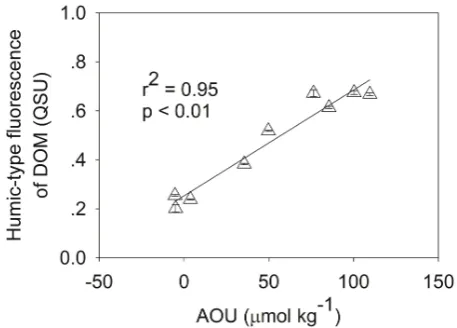
Fig. 6. Relationships between humic-type fluorescent dissolved
or-ganic matter (FDOM) and apparent oxygen utilization (AOU) in the euphotic zone of CE1. Error bars indicate standard deviations.
BR could occur at certain upwelling stages as was observed in this study in CE2, which was due to the low bacterial abundance diluted by deep water, gradually increasing BR was identified as the prevailing feature of the cyclonic eddies (Table 2).
3.4 Microbial oxygen consumption and organic carbon
transformation
AOU has been demonstrated as a useful indicator of micro-bial consumption of oxygen in the water column (Hayase and Shinozuka, 1995; Yamashita and Tanoue, 2008). In our study, data taken from both CE1 and CE2 yielded higher AOU val-ues than the reference site (Table 1). The effects of oxygen consumption are also verified by the microbial metabolic output – the fluorescence of humic-type dissolved organic matter, which was measured as an indicator of RDOC (Ya-mashita and Tanoue, 2008). Our earlier studies have shown that humic-type FDOM and the ratio of humic-like FDOM to bulk DOC concentrations were generally higher in the cy-clonic eddy centers than at the reference site St. SEATS, es-pecially at 35 to 75 m depths (Zhang et al., 2009). In our study, humic-type FDOM in the euphotic zone also displayed higher fluorescence intensity in the upwelling areas than the reference site. Furthermore, a significant positive correlation (p <0.01) between AOU and FDOM was observed in the euphotic zone of CE1 where microbial respiration was strong (Fig. 6), suggesting that FDOM was associated with micro-bial decomposition of organic matter and the consumption of oxygen.
3.5 Influence of upwelling on CO2outgassing and
carbon sequestration
Table 2. Bacterial respiration inside and outside the mesoscale features in the Atlantic.
Study area Study site BRa Reference
(mg C m−3d−1, 0–100 m)
Northeastern Atlantic
Ambient Stn159 54.16 Lochte et al. (1987) Eddy centre Stn161 31.75
Eddy centre Stn162 32.04 Eddy margin Stn163 37.18 Ambient Stn164 16.23 Reference station Stn170 3.35 Northwestern Sargasso Sea
Eddy 1 edge (N=10) 2.05 Ewart et al. (2008) Eddy 1 center (N=3) 1.68
Eddy 2 edge (N=3) 2.31 Eddy 2 center (N=1) 1.85 BATS
Cyclonic eddies B178 7.39 Reference datab 3.08 Sargasso Sea
Cyclones 0.20 Mourinõ-Carballido (2009) BATS
Cyclones center 1.09 Cyclones edge 0.01 Anticyclone 0.64
CAc −0.55
The Canary Islands (15–19◦W, 27–29◦N)
Cyclone1 18.72 Baltar et al. (2010) Far-fields (FF)1 24.44
Cyclone2 12.63
Far-fields (FF)2 3.62
aBacterial respiration rate (BR) was calculated using BR = (BG×ICF×CCF) (1/BGE – 1) according to the bacterial production derived
from the references.bReference data from the BATS summer climatology (1999–2002).cCorresponds to areas of interaction between cyclone and anticyclone eddies.
zone, a corresponding bloom in phytoplankton, such as di-atoms, would occur; meanwhile, an initial reduction in to-tal microbial respiration would also occur. These two events would consequently result in an increase of POC export flux, as demonstrated in the case of CE2. In the case that diatom blooms do not occur or picoplankton populations dominate the community, as with the case of CE1, the microbial loop develops, and microbial respiration is mobilized. This exac-erbates the attenuation of POC flux and could play a critical role for a marine upwelling area to be an outgassing area of CO2.
Taken together, POC sinking and microbial respiration suggested that the remineralization depth, a comprehen-sive parameter, can be referred to. A three-dimensional global ocean biogeochemistry model has shown that a mod-est change in remineralization depth can have a substantial impact on atmospheric CO2 concentrations (Kwon et al.,
2009). As upwelling processes influence nutrients, tempera-ture, oxygen concentration, as well as stratification and
com-munity composition, all these variables influence the depth of remineralization (Kwon et al., 2009). Therefore, upwelling scenario models should be established to better illustrate the effects of upwelling on ocean carbon uptake/outgassing dy-namics.
Based on the above consideration, two scenario models can be established (Fig. 7). When an upwelling event brings nutrients and DIC to the upper layer of the euphotic zone where light is replete, diatoms respond and bloom and con-sequently enhance POC export and excess CO2outgassing
(Burt et al., 2013; Dai et al., 2013); Meanwhile, total micro-bial respiration would be decreased due to low abundance and low temperature brought by the deep water. As a result, POC export flux exceeds respiration flux, and even could exceed total CO2 flux (Fig. 7a; instance: CE2). This would
deepen the mineralization depth and thus favor CO2uptake
31 1
[image:8.595.49.288.62.148.2]2
Figure 7. Scenario models for the effects of upwelling on ocean carbon 3
uptake/outgassing dynamics. Note the scenarios assume steady state of a water body 4
without advective exchanges at horizontal dimensions. Red arrows indicate 5
respiration flux; pink arrows indicate DIC release from deep water. 6
a, Scenario of POC export flux exceeding total CO2 flux: nutrients are injected into
7
the upper layer of the euphotic zone; diatoms are dominant; POC export exceeds CO2
8
outgassing; the biological pump is the prevailing mechanism for carbon sequestration. 9
b, Scenario of total CO2 flux exceeding POC export flux: nutrients are injected only
10
into the lower layer of the euphotic zone; Prochlorococcus are dominant; microbial 11
respiration is mobilized; CO2 outgassing exceeds POC export; the MCP is the
12
prevailing mechanism for carbon sequestration. c, A non-upwelling scenario for 13
reference. 14
15
Fig. 7. Scenario models for the effects of upwelling on ocean
car-bon uptake/outgassing dynamics. Note the scenarios assume steady state of a water body without advective exchanges at horizontal di-mensions. Red arrows indicate respiration flux; pink arrows indicate DIC release from deep water. (a) Scenario of POC export flux ex-ceeding total CO2flux: nutrients are injected into the upper layer of the euphotic zone; diatoms are dominant; POC export exceeds CO2outgassing; the biological pump is the prevailing mechanism for carbon sequestration. (b) Scenario of total CO2flux exceeding POC export flux: nutrients are injected only into the lower layer of the euphotic zone; Prochlorococcus are dominant; microbial respi-ration is mobilized; CO2outgassing exceeds POC export; the MCP is the prevailing mechanism for carbon sequestration. (c) A non-upwelling scenario for reference.
dominant, diatoms do not respond much to the upwelling due to lack of light exposure at that depth; instead, the microbial loop could be very active (Hagström et al., 1988; Azam et al., 1993). As a result, microbial respiration flux and total CO2
flux would exceed POC export flux (Fig. 7b; instance: CE1). This would result in shoaling the mineralization depth and result in a decrease in oceanic DIC capacity (Kwon et al., 2009).
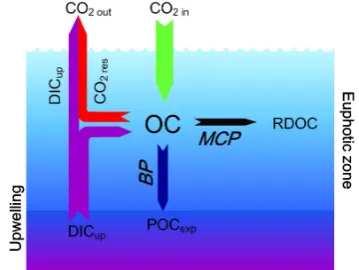
In addition, the common notion that “outgassing areas are carbon sources” needs to be revised for the case of ma-rine upwelling regions. As shown in Fig. 8, for a steady upwelling system, CO2released from DIC-rich deep water
(DICup)has to be taken into consideration in the
equilib-rium of carbon sources/sinks. Even if CO2 dissolving into
the sea from atmosphere (CO2 in) <(CO2 from respiration
(CO2 res)+DICup), it does not necessarily preclude a state of
massive carbon sequestration in the system, and sequestered carbon need not be exported out entirely as POC (POCexp).
It can be stored in dissolved form as RDOC through the MCP approach (Jiao et al., 2010). Therefore, as long as the condition (CO2 in+POCexp+RDOC)>(CO2 res+DICup)is
met, the equilibrium will favor carbon sequestration, even if it is outgassing. Upwelling areas can be CO2outgassing
[image:8.595.340.520.65.200.2]and yet export POC through BP and produce RDOC through MCP. Therefore, the adjudgment of a marine region to be a carbon sink or source should be made carefully and in consideration of the long-term balance between the amount of outgassing carbon and the sum of the outputs of the BP and the MCP, rather than simply according to momentary CO2partial pressures.
Fig. 8. A diagram showing the factors influencing CO2dynamics in an upwelling area. CO2 in: CO2dissolving into the sea from atmo-sphere; CO2 out: CO2released from the ocean; OC: organic carbon; RDOC: refractory dissolved organic carbon which could stay in the water column for long-term storage; POCexp: particulate organic carbon exported out of the euphotic zone; DICup: dissolved inor-ganic carbon in the upwelled water, which can be further released into the atmosphere when conditions permit; CO2 res: CO2from res-piration. See the text for further details. It is also shown that carbon sequestration takes place through the BP and MCP in an upwelling area even if it is outgassing.
4 Summary
The results from the present study indicate that when nutrient-rich deep water with low abundance of prokaryotes is upwelled to the upper ocean, a corresponding rapid growth of phytoplankton and an initial reduction in total bacterial respiration might result in an increase of POC export flux, as demonstrated in the case of CE2, whose age was younger and whose upwelling was stronger than that of CE1. In the case that phytoplankton blooming does not occur or pico-phytoplankton dominates the community, as in the case of CE1 during the later intensification period, the injected nu-trients and phytoplankton originated labile organic carbon could stimulate microbial respiration, which exacerbates the attenuation of POC flux.
The results further suggest that while upwelling usually enhances primary production through the injection of nu-trients into the euphotic zone, upwelled DIC-rich deep wa-ter could release CO2 and ultimately result in outgassing.
Moreover, microbial respiration could be stimulated and ac-celerated by this nutrient enhancement and subsequent phy-toplankton labile DOC, and thus result in a productive up-welling area to be a CO2outgassing area. In terms of carbon
BP is severely weakened, RDOC formation by the MCP can still work well, and carbon sequestration takes place while an upwelling area is outgassing. Given the tremendous com-plexity of the biological and biogeochemical responses to up-welling events, further high-frequency sampling and simul-taneous observations of the BP and the MCP in the field are essential for a better understanding of carbon sequestration in the ocean.
Acknowledgements. We would like to acknowledge the financial support granted by the MOST 973 program 2013CB955700, the NSFC projects 91028001, 41121091, 41176095 and 41023007, and the SOA project GASI-03-01-02-05. We thank the captain and crew of the RV Dongfanghong #2 and our colleagues who participated in the GOE-2 cruise.
Edited by: H. Thomas
References
Archer, D.: Upper ocean physics as relevant to ecosystem dynamics: a tutorial, Ecol. Appl., 5, 724–739, 1995.
Azam, F., Fenchel, T., Field, J. G., Gray, J. S., Meyer-Reil, L. A., and Thingstad, F.: The ecological role of water-column microbes in the sea, Mar. Ecol. Prog. Ser., 10, 257–263, 1983.
Azam, F., Smith, D. C., Steward, G. F., and Hagström, Å.: Bacteria-organic matter coupling and its significance for oceanic carbon cycling, Microb. Ecol., 28, 167-179, 1993.
Beaulieu, S. E.: Accumulation and fate of phytodetritus on the sea floor, Oceanogr. Mar. Biol. Annu. Rev., 40, 171–232, 2002. Benitez-Nelson, C. R., Buesseler, K. O., Van der Loeff, M. R.,
An-drews, J., Ball, L., Crossin, G., and Charette, M.: Testing a new small-volume technique for determining234Th in seawater, J. Radioan. Nucl. Ch., 248, 795–799, 2001.
Benitez-Nelson, C. R., Bidigare, R. R., Dickey, T. D., Landry, M. R., Leonard, C. L., Brown, S. L., Nencioli, F., Rii, Y. M., Maiti, K., Becker, J. W., Bibby, T. S., Black, W., Cai, W. J., Carlson, C. A., Chen, F., Kuwahara, V. S., Mahaffey, C., McAndrew, P. M., Quay, P. D., Rappe, M. S., Selph, K. E., Simmons, M. P., and Yang, E. J.: Mesoscale eddies drive increased silica export in the subtropical Pacific Ocean, Science, 316, 1017–1021, 2007. Benner, R. and Herndl, G. J.: Bacterially derived dissolved organic
matter in the microbial carbon pump, in: Microbial Carbon Pump in the Ocean, edited by: Jiao, N., Azam, F., and Sanders, S., Sci-ence/AAAS, Washington, DC, SciSci-ence/AAAS, 46–48, 2011. Boyd, P. and Newton, P.: Does planktonic community structure determine downward particulate organic carbon flux in different oceanic provinces?, Deep-Sea Res. I., 46, 63–91, 1999. Buesseler, K. O., Ball, L., Andrews, J., Cochran, J. K., Hirschberg,
D. J., Bacon, M. P., Fleer, A., and Brzezinski, M.: Upper ocean export of particulate organic carbon and biogenic silica in the Southern Ocean along 170◦W, Deep-Sea Res. II., 48, 4275– 4297, 2001.
Buesseler, K. O., Benitez-Nelson, C. R., Moran, S. B., Burd, A., Charette, M., Cochran, J. K., Coppola, L., Fisher, N. S., Fowler, S. W., and Gardner, W. D.: An assessment of particulate organic carbon to thorium-234 ratios in the ocean and their impact on the application of234Th as a POC flux proxy, Mar. Chem., 100, 213–233, 2006.
Burt, W. J., Thomas, H., and Auclair, J.-P.: Short-lived radium iso-topes on the Scotian Shelf: Unique distribution and tracers of cross-shelf CO2and nutrient transport, Mar. Chem., 156, 120– 129, 2013.
Cai, P., Dai, M., Lv, D., and Chen, W.: An improvement in the small-volume technique for determining thorium-234 in seawater, Mar. Chem., 100, 282–288, 2006.
Carpenter, J. H.: The Chesapeake Bay Institute technique for the Winkler dissolved oxygen method, Limnol. Oceanogr., 10, 141– 143, 1965.
Chen, F., Cai, W. J., Benitez-Nelson, C., and Wang, Y.: Sea surfacepCO2-SST relationships across a cold-core cyclonic eddy: Implications for understanding regional variability and air-sea gas exchange, Geophys. Res. Lett., 34, L10603, doi:10.1029/2006GL028058, 2007.
Chen, J. H., Lawrence Edwards, R., and Wasserburg, G. J.:238U, 234U and232Th in seawater, Earth. Planet. Sc. Lett., 80, 241– 251, 1986.
Dai, M., Cao, Z., Guo, X., Zhai, W., Liu, Z., Yin, Z., Xu, Y., Gan, J., Hu, J., and Du, C.: Why are some marginal seas sources of atmospheric CO2?, Geophys. Res. Lett., 40, 2154–2158, 2013. Furuya, K., Hayashi, M., and Yabushita, Y.: HPLC determination
of phytoplankton pigments using N, N-dimethylformamide, J. Oceanogr., 54, 199–203, 1998.
Garcia, H. E., Locarnini, R. A., Boyer, T. P., and Antonov, J. I.: World Ocean Atlas 2005, Vol. 3: Dissolved Oxygen, Ap-parent Oxygen Utilization, and Oxygen Saturation. S. Levitus, Ed. NOAA Atlas NESDIS 63, US Government Printing Office, Washington, DC, 342 pp., 2006.
Glover, H. E., Prézelin, B. B., Campbell, L., Wyman, M., and Gar-side, C.: A nitrate-dependent Synechococcus bloom in surface Sargasso Sea water, Nature, 331, 161–163, 1988.
Gonzalez, N., Anadón, R., Mouriño, B., Fernández, E., Sinha, B., Escánez, J., and de Armas, D.: The metabolic balance of the planktonic community in the North Atlantic Subtropical Gyre: The role of mesoscale instabilities, Limnol. Oceanogr., 46, 946– 952, 2001.
Hagström, Å., Azam, F., Andersson, A., Wikner, J., and Ras-soulzadegan, F.: Microbial loop in an oligotrophic pelagic marine ecosystem: possible roles of cyanobacteria and nanoflagellates in the organic fluxes, Mar. Ecol. Prog. Ser., 49, 171–178, 1988. Hayase, K. and Shinozuka, N.: Vertical distribution of fluorescent
organic matter along with AOU and nutrients in the equatorial Central Pacific, Mar. Chem., 48, 283–290, 1995.
Honjo, S., Dymond, J., Prell, W., and Ittekkot, V.: Monsoon-controlled export fluxes to the interior of the Arabian Sea, Deep-Sea Res. II., 46, 1859–1902, 1999.
Hu, J., Gan, J., Sun, Z., Zhu, J., and Dai, M.: Observed three-dimensional structure of a cold eddy in the south-western South China Sea, J. Geophys. Res., 116, C05016, doi:10.1029/2010JC006810, 2011.
Jiao, N., Herndl, G. J., Hansell, D. A., Benner, R., Kattner, G., Wil-helm, S. W., Kirchman, D. L., Weinbauer, M. G., Luo, T., Chen, F., and Azam, F.: Microbial production of recalcitrant dissolved organic matter: long-term carbon storage in the global ocean, Na-ture Rev. Microbiol., 8, 593–599, 2010.
Kirchman, D. L.: Incorporation of thymidine and leucine in the subarctic Pacific: Application to estimating bacterial production, Mar. Ecol. Prog. Ser., 82, 301–309, 1992.
Kirchman, D. L. and Wheeler, P. A.: Uptake of ammonium and nitrate by heterotrophic bacteria and phytoplankton in the sub-Arctic Pacific, Deep-Sea Res. I., 45, 347–365, 1998.
Kwon, E. Y., Primeau, F., and Sarmiento, J. L.: The impact of rem-ineralization depth on the air–sea carbon balance, Nat. Geosci., 2, 630–635, 2009.
Lee, S. and Fuhrman, J. A.: Relationships between biovolume and biomass of naturally derived marine bacterioplankton, Appl. En-viron. Microb., 53, 1298–1303, 1987.
Mackey, M. D., Mackey, D. J., Higgins, H. W., and Wright, S. W.: CHEMTAX a program for estimating class abundances from chemical markers: application to HPLC measurements of phyto-plankton, Mar. Ecol. Prog. Ser., 14, 265–283, 1996.
Maixandeau, A., Lefèvre, D., Karayanni, H., Christaki, U., Van Wambeke, F., Thyssen, M., Denis, M., Fernández, C. I., Uitz, J., Leblanc, K., and Queguiner, B.: Microbial community produc-tion, respiraproduc-tion, and structure of the microbial food web of an ecosystem in the northeastern Atlantic Ocean, J. Geophys. Res., 110, C07S17, doi:10.1029/2004JC002694, 2005.
Mann, K. H. and Lazier, J. R. N.: Biological-Physical Interactions in the Ocean, in: Dynamics of marine ecosystems, third edition, Blackwell Science, Cambridge, Massachusetts, 2006.
Mantoura, R. F. C. and Llewellyn, C. A.: The rapid determination of algal chlorophyll and carotenoid pigments and their breakdown products in natural waters by reverse-phase high-performance liquid chromatography, Anal. Chim. Acta., 151, 297–314, 1983. McGillicuddy, D. J., Robinson, A. R., Siegel, D. A., Jannasch, H. W., Johnson, R., Dickey, T. D., McNeil, J., Michaels, A. F., and Knap, A. H.: Influence of mesoscale eddies on new production in the Sargasso Sea, Nature, 394, 263–266, 1998.
McGillicuddy, D. J., Anderson, L. A., Doney, S. C., and Mal-trud, M. E.: Eddy-driven sources and sinks of nutrients in the upper ocean: Results from a 0.1◦ resolution model of the North Atlantic, Global. Biogeochem. Cy., 17, 1035, doi:10.1029/2002GB001987, 2003.
Michaels, A. F. and Silver, M. W.: Primary production, sinking fluxes and the microbial food web, Deep-Sea Res., 35, 473–490, 1988.
Mouriño-Carballido, B.: Eddy-driven pulses of respiration in the Sargasso Sea, Deep-Sea Res. I., 56, 1242–1250, 2009.
Newton, P. P., Lampitt, R. S., Jickells, T. D., King, P., and Boutle, C.: Temporal and spatial variability of biogenic particles fluxes during the JGOFS northeast Atlantic process studies at 47◦N, 20◦W, Deep-Sea Res. I., 41, 1617–1642, 1994.
O’Brien, M. C., Melling, H., Pedersen, T. F., and Macdonald, R. W.: The role of eddies on particle flux in the Canada Basin of the Arctic Ocean, Deep-Sea Res. I., 71, 1–20, 2013.
Oschlies, A.: Can eddies make ocean deserts bloom?, Global. Bio-geochem. Cy., 16, 53-1–53-11, 2002.
Oschlies, A. and Garçon, V.: Eddy-induced enhancement of primary production in a model of the North Atlantic Ocean, Nature, 394, 266–269, 1998.
Richardson, T. L. and Jackson, G. A.: Small phytoplankton and car-bon export from the surface ocean, Science, 315, 838–840, 2007.
Rivkin, R. B. and Legendre, L.: Biogenic carbon cycling in the up-per ocean: effects of microbial respiration, Science, 291, 2398– 2400, 2001.
Robinson, C.: Heterotrophic bacterial respiration, in: Microbial Ecology of the Oceans, 2nd edn., edited by: Kirchman, D. L., Wiley, New York, 299–334, 2008.
Robinson, C. and Williams, P. J. le B.: Respiration and its measure-ment in surface marine waters, in: Respiration in aquatic ecosys-tems, edited by: del Giorgio, P. A. and Williams, P. J. le B., Ox-ford University Press, New York, 148–181, 2005.
Rosón, G., Álvarez-Salgado, X. A., and Pérez, F. F.: Carbon cy-cling in a large coastal embayment, affected by wind-driven up-welling: short-time-scale variability and spatial differences, Mar. Ecol. Prog. Ser., 176, 215–230, 1999.
Savoye, N., Benitez-Nelson, C., Burd, A. B., Cochran, J. K., Charette, M., Buesseler, K. O., Jackson, G. A., Roy-Barman, M., Schmidt, S., and Elskens, M.:234Th sorption and export models in the water column: A review, Mar. Chem., 100, 234–249, 2006. Siegel, D. A., McGillicuddy, D. J., and Fields, E. A.: Mesoscale eddies, satellite altimetry, and new production in the Sargasso Sea, J. Geophys. Res., 104, 13359–13379, 1999.
Su-Cheng, P., Chung-Cheng, Y., and Riley, J. P.: Effects of acidity and molybdate concentration on the kinetics of the formation of the phosphoantimonylmolybdenum blue complex, Anal. Chim. Acta., 229, 115–120, 1990.
Sweeney, C., Gloor, E., Jacobson, A. R., Key, R. M., McKin-ley, G., Sarmiento, J. L., and Wanninkhof, R.: Constrain-ing global air-sea gas exchange for CO2 with recent bomb 14C measurements, Global. Biogeochem. Cy., 21, GB2015, doi:10.1029/2006GB002784, 2007.
Sweeney, E. N., McGillicuddy, D. J., and Buesseler, K. O.: Biogeo-chemical impacts due to mesoscale eddy activity in the Sargasso Sea as measured at the Bermuda Atlantic Time-series Study (BATS), Deep-Sea Res. II., 50, 3017–3039, 2003.
Takahashi, M. and Bienfang, P. K.: Size structure of phytoplankton biomass and photosynthesis in subtropical Hawaiian waters, Mar. Biol., 76, 203–211, 1983.
Takahashi, T., Olafsson, J., Goddard, J. G., Chipman, D. W., and Sutherland, S. C.: Seasonal variation of CO2and nutrients in the high-latitude surface ocean: a comparative study, Global. Bio-geochem. Cy., 7, 843–878, 1993.
Van Heukelem, L. and Thomas, C. S.: Computer-assisted high-performance liquid chromatography method development with applications to the isolation and analysis of phytoplankton pig-ments, J. Chromatogr. A., 910, 31–49, 2001.
Yamashita, Y. and Tanoue, E.: Production of bio-refractory fluo-rescent dissolved organic matter in the ocean interior, Nature Geosci., 1, 579–582, 2008.
Zhai, W., Dai, M., Cai, W., Wang, Y., and Wang, Z.: High partial pressure of carbon dioxide and its maintenance mechanism in the Pearl River estuary, China, Mar. Chem, 93, 21–32, 2005. Zhang, Y., Sintes, E., Chen, J., Zhang, Y., Dai, M., Jiao, N., and
Zhang, Y., Jiao, N., Sun, Z., Hu, A., and Zheng, Q.: Phyloge-netic diversity of bacterial communities in South China Sea mesoscale cyclonic eddy perturbations, Res. Microbiol., 162, 320–329, 2011a.