R E S E A R C H
Open Access
Validity of questionnaire-based assessment
of sedentary behaviour and physical
activity in a population-based cohort of
older men; comparisons with objectively
measured physical activity data
Barbara J. Jefferis
1,2*, Claudio Sartini
1,2, Sarah Ash
1, Lucy T. Lennon
1, S. Goya Wannamethee
1and Peter H. Whincup
3Abstract
Background:Older adults are the most inactive age group and self-reporting of activities may be complicated by age-related reductions in structured activities and misclassification or recall biases. We investigate the validity of simple questionnaires about sedentary behaviour (SB), (including the widely used proxy television (TV) viewing), and physical activity (PA) in comparison with objective measures.
Methods:Community dwelling men aged 71–93 years, from a UK population-based cohort wore a GT3X accelerometer over the right hip for 7 days and self-completed a questionnaire including information about SB (TV, reading, computer use and car use) and PA (leisure and sporting domains).
Results:1566/3137 surviving men (mean age 79 years) attended. 1377 ambulatory men provided questionnaire and accelerometer data. Questionnaires under-estimated mean daily sedentary time; 317 minutes total SB (TV, computer use, reading or driving), 176 minutes (TV) vs 619 minutes (objectively measured). Correlations between objective measures and self-reports were 0.18 (total SB) and 0.17 (TV), bothP< 0.001. Objective SB levels were similar across the lowest three quartiles of self-reported SB but raised in the highest quartile. Correlations between steps/day or moderate to vigorous PA with self-reported total PA were both 0.49,P< 0.001 and measured PA levels were progressively higher at higher levels of self-reported PA.
Conclusions:Among older men, simple SB questions performed poorly for identifying total SB time, although simple PA questions were associated with a graded increase with objectively measured PA. Future studies of health effects of SB in older men would benefit from objective measures of SB.
Keywords:Older adults, Sedentary behaviour, Physical activity, Questionnaire, Accelerometer, Cohort study
* Correspondence:[email protected]
1UCL Department of Primary Care & Population Health, UCL Medical School, Rowland Hill Street, London NW3 2PF, UK
2UCL Physical Activity Research Group, University College London, London, UK Full list of author information is available at the end of the article
Background
Both physical activity (PA) and sedentary behaviour (SB) are core determinants of health and are associated with mortality and CVD risk in prospective cohort studies [1, 2]. UK guidelines include recommendations about both PA and SB [3]. At older ages levels of PA are lowest and SB are highest [4] and burdens of PA preventable disease and disability rise steeply with age [5]. Accurate assess-ment of PA and SB is therefore essential in this age group, yet there is little data about validity of both PA and SB in the oldest old, aged up to 90 years. Until re-cently all studies relating PA and SB to morbidity and mortality used self-reports (with television (TV) viewing the most commonly used proxy for SB) [6]. TV viewing is consistently associated with elevated risks of mortality, CVD and diabetes events [7]. Yet some studies reporting detrimental association between self-reported TV time and CVD risk markers, fail to find associations with ac-celerometer measured SB [8]. This may be because TV viewing accounts for only a small part of SB and does not reflect other domains (leisure, occupational and transport) [9, 10]. Furthermore, there are concerns about questionnaire-based assessment of both PA and SB in older people, in whom misclassification bias and recall bias (which could be exacerbated by memory loss) [11] are particularly likely and who report difficulty in an-swering questions about typical SB [12]. Moreover, this age-group undertakes fewer sporting and structured ex-ercise and more light activities (including functional tasks such as walking for transport, household tasks, car-ing and gardencar-ing [13]), which may be harder to recall, or not be included in questionnaires designed for younger age groups. Sensor technology permits objective measure-ments of PA and SB in population-based studies, provid-ing estimates of time spent at different intensities of activity. In order to better understand the health effects of SB and to design effective interventions to change patterns of SB in older adults, it is important to assess the validity of commonly used instruments to measure SB in large scale studies of community-dwelling older adults. Like-wise, it is important to understand the validity of existing PA questionnaires which have been used to generate
esti-mates of PA, from which the dose–response curves
be-tween PA and clinical outcomes are estimated
This paper therefore aims first to investigate how the most widely used measure of SB (TV viewing) and a more comprehensive SB score made up of common sed-entary activities (TV viewing, computer use, reading and car driving time) are related to accelerometer-measured SB and different intensities of activities in the oldest old. Second, it aims to evaluate whether the established British Regional Heart Study (BRHS) PA questionnaire which has been used extensively to investigate health
effects of PA [14–16], can capture the“low active”older
adults who have greatest potential to benefit from activ-ity interventions, and differentiate physical activactiv-ity
levels across “high active” groups. Third, it aims to
in-vestigate the properties of a single question about rec-reational PA which could be useful in screening for low active older individuals in time or resource-poor set-tings. Additionally, it investigates associations between questionnaire and objective measures of activity in older adults (content validation) and associations with
FEV1 and heart rate as markers of fitness (construct
validation).
Methods
Measures Sample
The British Regional Heart Study is an on-going prospect-ive, population-based cohort study following up 7735 men recruited from primary care centres in 24 British towns in 1978–80 when aged 40–59 years [17]. In 2010–2012, 3137 survivors were invited to a clinic reassessment. The Na-tional Research Ethics Service (NRES) Committee London provided ethical approval. Participants provided informed
written consent to the investigation. FEV1was measured
using a Vitalograph Compact II Spirometer, with the sub-ject standing. A nurse demonstrated how to blow into the mouthpiece and then the participant completed three tests (blows). The highest of three consecutive test read-ings was selected using American Thoracic Society criteria [18] : if the best test variation was >5%, a further test was
recorded. FEV1 values were standardised to height
squared. Men also had a resting 12-lead electrocardiogram (Burdick Atria 6100 ECG Machine) recorded, during which heart rate was measured. Men lay on a bed and rested for at least 5 minutes prior to measurement. Sensi-tivity analyses of Heart Rate data excluded (i) men with atrial fibrillation or tachycardia diagnosed on ECG using Minnesota coding guidelines, and (ii) men who reported taking beta blockers, which are associated with lower heart rate. Men completed a standard study questionnaire [19, 20] about PA and SB and were fitted with an acceler-ometer to objectively measure PA and SB.
Accelerometer data
Men wore a GT3x accelerometer (Actigraph, Pensacola, Florida) over the right hip for 7 days, during waking hours, removing it for bathing or swimming. Accelerom-eter data were processed using standard methods as previ-ously described [21]. Valid wear days were defined as≥600
minutes wear time, and participants with ≥3 valid days
[25]: <100 for SB (<1.5 MET),100-1040 for light activity (1.5-3 MET) and > =1040 for MVPA,(> = 3 MET). The time spent in bouts of MVPA was labelled as MVPA1+: which is the total number of individual minutes in MVPA (irrespective of whether they occurred consecutively or not), and also as MVPA10+ which is the number of mi-nutes spent in bouts lasting 10 consecutive mimi-nutes or more (without a break).
Questionnaire data
Men completed a questionnaire including questions about how many hours per week they spent (i) watching TV, videos or DVDs (ii) reading (iii) using a computer (iv) driving or sitting in a car. A total SB score was de-rived by summing time spent in the four activities. One question about self-rated recreational and domestic
ac-tivity was asked “Compared to a man who spends two
hours on most days on activities such as walking, gar-dening, household chores, DIY (do it yourself ) projects, how physically active would you consider yourself?” (much more active/ more active/ similar/ less active /much less active). Men also completed the standard BRHS physical activity questionnaire (used since 1978); usual PA is self-reported under the headings of regular walking or cycling, recreational activity, and sporting (vigorous) activity. Regular walking and cycling relate to daily journeys. Recreational activity included gardening, pleasure walking, and do-it yourself jobs. Sporting activ-ity included running, golf, swimming, tennis, sailing and digging. A PA score (validated in relation to heart rate
and FEV1 [19, 20]) was derived for each man. Scores
were assigned for each type of activity and duration on the basis of the intensity and energy demands of the ac-tivities reported based on Minnesota intensity codes [26]. Men were categorized into six groups based on their total score. The total score for each man is not a measure of total time spent doing PA but is a relative measure of how much PA has been carried out [20].
Statistical methods
Quartiles of the number of hours per week of (i) total SB (sum of watching TV, reading, using a computer and driving or sitting in a car) and (ii) watching TV were cal-culated. The standard six category BRHS PA score was calculated for all men [20]. Spearman’s correlations be-tween total minutes/day recorded as SB by accelerom-eter and (i) total sedentary hours (sum of watching TV, reading, using a computer and driving or sitting in a car) and (ii) hours watching TV were calculated. Bland Alt-man plots compared the self-reported total SB to accel-erometer measured SB, plotting the difference between the two measures (in the same metric, minutes/day) against the average of the two measures, differences and limits of agreement were calculated. Plots were repeated
for TV viewing time. Neither the questionnaire nor ac-celerometer are gold standard measures of SB, so these plots give evidence of concurrent rather than criterion validity. Bland Altman plots were not calculated for PA measures as the questionnaire gives ranks rather than absolute PA levels and cannot therefore be compared to accelerometer PA measures on the same scale.
Within each category of self-reported TV watching (4 categories), total sedentary time (4 categories), self-reported total activity (6 categories) and self-rated recre-ational and domestic activity (5 categories), mean and 95%CI of objective measures of PA and SB were calcu-lated. The objective accelerometer measures were mean daily: (i) counts per minute (CPM) (ii) steps (iii) minutes
spent in SB (iv) sedentary 60+ (SB in bouts lasting≥60
minutes) (v) light PA (vi) MVPA 1+ (in bouts lasting≥1
minute) (vii) MVPA10+ (in bouts lasting≥10 minutes).
Random effects linear regression models estimated asso-ciations between quartiles of self-reported TV time and each of the accelerometer measures, accounting for clus-tering, with accelerometer measurement (range 3–8 days) at level 1 and person at level 2. Models were adjusted for measurement related factors; age, day order (first, second, third etc. day of wear), season, accelerometer wear time (minutes/day) and town of residence. Adjusted mean values for each objective measure of PA or SB were calcu-lated for each self-reported SB or PA measure. Complete case analysis was used. Statistical analyses were run in R version 2.15.3 and Stata version 13 [27, 28].
Results
Among 3137 men invited, 1655 attended (52.8 %), of whom 1455 (46.4 %) provided questionnaire and adequate
accelerometer data (≥600 minutes wear time on 3–7 days)
(Table 1). Analyses were restricted to 1377 independently mobile, community-dwelling men, aged on average 79
years (range 71–93), with a BMI of 27.1kg/m2
, 22.6 % of whom had pre-existing CVD. Comparing characteristics of men who did participate in the accelerometer survey to those who did not, participants were more active at previ-ous time points (59 % vs 46 % were at least moderately ac-tive at a survey 10 years previously), younger (mean age 78.5 years vs 80.1years), and less likely to smoke (7.2% vs 12.9 %) compared to men who did not participate.
1377 men met the criteria above and also had complete PA questionnaire data, of which 1257 also had data on HR
and FEV1. 1112 men had complete data on SB score (men
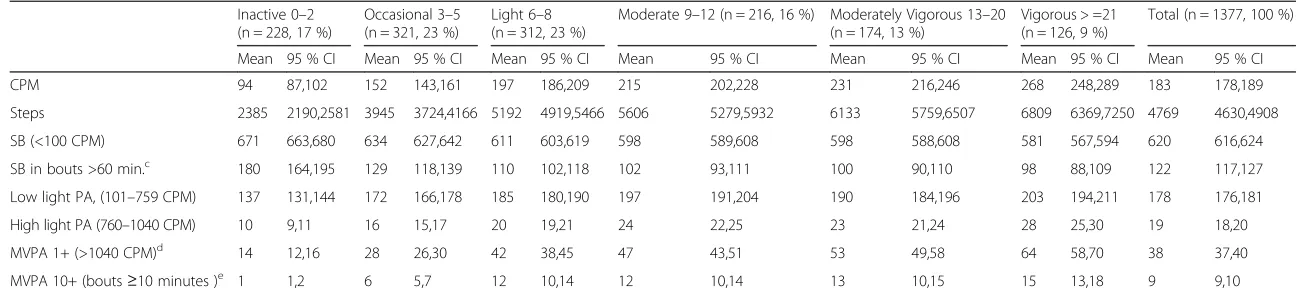
computer. 13% of men were moderately vigorously active and 9 % of men vigorously active according to the habitual PA score (Table 2). On average each day men registered 187 accelerometer counts per minute, took 4769 steps, and spent 619 minutes in SB (122 minutes in bouts lasting > =1 hour), 200 minutes in light activity and 39 minutes in MVPA. On average only 9 minutes/day were spent in bouts lasting≥10 minutes (Table 3), reflecting the fact that many men did not sustain a single 10 minute bout of MVPA per day.
Validity of self-reported sedentary behaviour: TV viewing, computer use, sitting in a car, reading
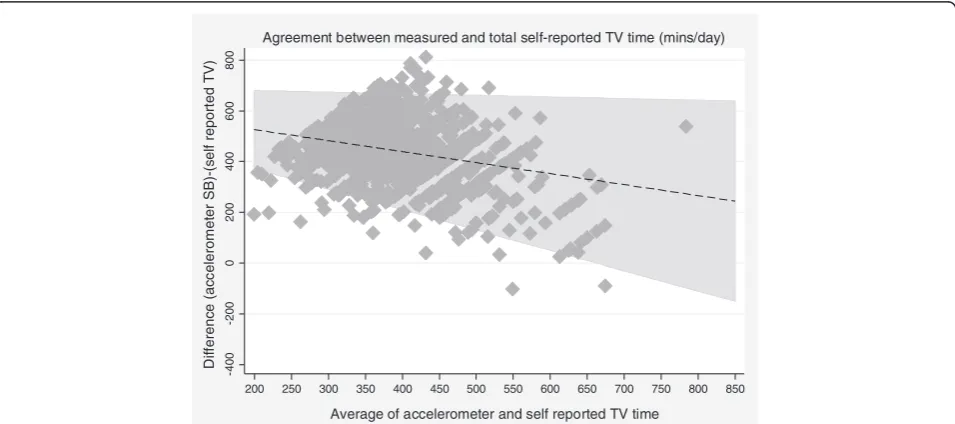
Both self-reported total SB and TV viewing time were weakly positively correlated with accelerometer SB time (Spearman’s r = 0.18 and 0.17 respectively, bothP< 0.001). Bland Altman plots showed that accelerometers re-corded higher SB time than either self-report measure (Figs. 1 and 2); 300 (95 % CI 291,309) minutes/day
(limits of agreement −6 to 607) more compared to
self-reported total SB time and 440 (95 % CI 433,447) minutes/day more (limits of agreement 193 to 687) compared to self-reported TV viewing. For both total SB time and TV time, the discrepancy between acceler-ometer and self-report TV time was greater (with par-ticipants reporting much less SB time than was measured) in the participants who were least seden-tary. In sensitivity analyses, no evidence was found that the mean differences varied by social class (manual vs non manual), presence of pre-existing CHD or stroke and presence of mobility limitations However, among men aged <80 years and > =80 respectively, accelerom-eters recorded 285(95 % CI 274,295) more minutes per day and 335(95 % CI 318, 352) more minutes per day for self-reported total SB time and equivalently 431(95 % CI
423,440) and 460(95 % CI 446,473) more minutes per day for reported TV viewing, suggesting that error in self-reported SB as particularly marked among the over 80s. Descriptive data for the total self-reported SB and PA levels stratified by age group are presented in Additional file 1: Table S1.
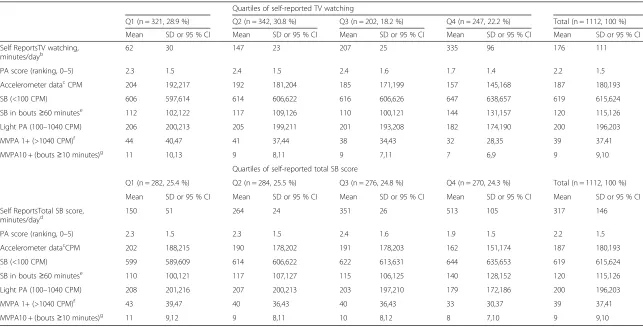
Self-reported total SB and TV viewing time were strongly correlated (Spearman’s r = 0.78, P< 0.001), so patterns of associations of each self-report measure with accelerom-eter measured SB were similar (Table 3). In both cases, men reporting highest SB levels (top quartile) had mark-edly higher measured SB than the rest, whereas measured SB was very similar across the lowest three quartiles of self-reported SB (Table 2). An inverse pattern was observed for the PA measures (CPM, steps, high light activity and MVPA). As noted above, men self-reported substantially less SB time than registered on accelerometers; data in Table 3 show that in the lowest quartile of the SB score, self-reported total SB score accounted for about 25 % of measured daily SB time, compared to 80 % in the top quar-tile of the SB score. In the lowest quarquar-tile of TV viewing, TV time accounted for about 10% of measured SB whereas it rose to 50 % in the men in the highest quartile.
Validity of self-reported physical activity
Correlations between the self-reported PA score and ac-celerometer measured CPM, steps, light and MVPA were 0.49, 0.49, 0.33 and 0.49 respectively, all P< 0.001. Self-reported PA levels were associated with higher CPM, step count, light and MVPA and lower SB in a graded, stepwise manner (Table 4). There was a larger incremental differ-ence in step count, CPM and high light activity between “inactive” and “occasional” groups than for increases in groups at higher activity levels. The gradient in activity level was stronger for step count and total MVPA than for low light activity. There was a plateau across the three highest categories of the PA scores for values of low light
PA and bouts of SB lasting≥one hour. Overall 15 % of
men achieved 150 minutes/week in bouts of≥10 minutes,
rising from 0.4 % in the“inactive”to 25.4 % in the “vigor-ously active”.
The associations between self-reported and objectively measured PA did not vary by presence of pre-existing CVD, or by age group (interactions all p > 0.2). The only exception was the presence of interactions between age group and both CPM and total MVPA minutes (likelihood
ratio test, P= 0.017 and P= 0.046 respectively). Among
younger men, the PA scores were associated with higher objectively measured CPM and MVPA minutes than among older men, and this difference was greater at the higher scores for the younger men.
Total PA score was linearly and inversely related to
rest-ing heart rate and positively related to FEV1 (Additional
file 1: Table S2).
Table 1Flow chart for men invited to accelerometer study at clinic visit
N %
Participants invited 3137 100
Agreed to participate 1655 52.8
Actigraph returned 1566 49.9
Actigraph missing/lost, n=53(1.7 %) Actigraph faulty, n=6 (0.2 %)
Actigraph returned unworn, n=30 (1.0 %)
Actigraph with a valid week 1528 48.7
With a valid questionnaire 1455 46.4
Not in residential home or in a wheelchair 1455 46.4
With PA score self-reported 1377 43.9
a) and FEV1+ Heart rate 1257 40.0
Validity of self-reported recreational activity
Responses to a single item question about how much recreational activity men did compared to other men their age were positively and linearly associated with mean CPM, daily steps, minutes of light PA and of MVPA1+ (Additional file 1: Table S3). Correlations be-tween this single item PA question and accelerometer measured CPM, steps, light and MVPA were 0.46, 0.45, 0.42 and 0.43 respectively, all P< 0.001. The prevalence of adhering to MVPA guidelines increased though flat-tened out in the two most active categories. Mean daily minutes in sedentary behaviour and long sedentary bouts decreased linearly, although again there was a plateau at higher scores. Self-reported recreational
ac-tivity was positively related to HR and FEV1(Additional
file 1: Table S2).
Discussion
In this large sample of community dwelling older men, the validity of self-reported SB was weak (either as a score with four sedentary behaviours or just TV viewing), with corre-lations of <0.2. The top quartile of the self-reported SB score identified the most sedentary men, however mea-sured SB and PA were similar across the three lower quar-tiles. Self-report SB scores had poor content validity and performed most poorly among the men aged over 80 years. In contrast, we found evidence for content and construct validity for both the PA score (a simple to administer self-report based on different domains of activity (habitual ac-tive transport; walking and cycling, recreational and sport-ing activities)) and a ssport-ingle item recreational PA question. Both were strongly positively associated both with objective measures of total MVPA and step counts, and inversely with long and short bouts of SB, demonstrating content validity and associated with measures of fitness (higher
FEV1and lower Heart Rate), demonstrating construct
val-idity. Hence both were valid for ranking PA in older adults, although they cannot necessarily identify the actual inten-sity of physical activity level.
Validity of self-reported Sedentary behaviours
As seen in other studies [29, 30], accelerometers recorded much more SB time than either the self-reported total SB score (including reading, car and computer use) or just TV score. This is partly because the scores omit some ha-bitual SBs (such as eating, sitting talking, resting). Further there may be social desirability bias (where undesirable ac-tivities are underestimated) or recall bias (that acac-tivities are systematically forgotten). However recall bias specific-ally about SB seems unlikely, given that both self-reported PA scores performed very well in relation to objective measures. The four components of our SB score are re-ported to be among the most common individual SBs in other studies of older adults examining more individual
SBs, furthermore they are among the most reliably recalled, with highest test-retest ICCs, compared to other behaviours [9, 31].
In our study, we did not observe differences in perform-ance of the SB scores by age group, presence of CVD and mobility limitations, except that the SB self-report per-formed better in the under 80s, which fits with other data showing better performance of an SB score in <75 year olds [31]. Overall, our correlations between SB scores and measured SB of <0.2 fit with data from other studies of older adults investigating the validity of self-reported TV-watching compared to objective measures which report correlations of 0.23 for >60 year olds [30] and 0.22 in 65– 92 year olds [32]–in the latter study all nine other single
SB questions were also correlated ≤0.2 with
acceler-ometer measured SB. A different single item question asking about the time spent sitting in an average day also had poor agreement with accelerometer
mea-sured SB (Kappa −0.0003) [33]. Given that TV and
the other domains of SB we asked about accounted for a smaller proportion of the total daily SB time in the lower compared to the higher quartiles of the report scores, we were interested in whether self-report SB scores derived from questionnaire instru-ments including more domains of SB might perform better. However correlations between accelerometer mea-sured SB and self-report SB were 0.3 for a 12-item instru-ment [31], 0.14 [33] and 0.12 [10] respectively for 9 and 8 item scores derived from different modifications of the SB questions on the Community Health Activities Model Program for Seniors (CHAMPS) questionnaire, and 0.3 [9] for a 7-item questionnaire designed to measure SB in older adults. A correlation of 0.35 for a 10-item instru-ment, was maximised to 0.46 by selecting a sub-set of 6 items however sleep was included in both of these self-report scores [32], so they are not directly comparable to other studies reported here, as sleep is specifically ex-cluded from definitions of SB [34]. Hence the validity of self report scores for assessing total time in SB appears to be limited in older adults, although self-reported SB ques-tionnaires may give insight into the context of behaviours. Our findings have implications for studies of self-reported SB in relation to health outcomes; the poor discrimination of the lower levels of self-reported SB time in relation to objective PA and SB may account for some of the discrep-ancies in the reported relations between cardio-metabolic markers and self-reported TV time compared to object-ively measured SB [8, 35, 36].
Validity of self-reported Physical activity
Table 2Health, demographic, physical activity and sedentary behaviour characteristics (n = 1377 men), mean (SD) or % (n)
Men with PA score self-reported and accelerometer dataa, n 1377
Region, % (n)
South 36.2 (499)
Midlands 14.9 (205)
North 39.0 (538)
Scotland 9.8 (135)
Age at baseline (years), mean (SD) 78.5 (4.6)
BMI (Kg/ m2), mean (SD) 27.1 (3.8)
Health status
Pre-existing CVD, % (n) 22.6 (345)
ECG Heart Rateb
Heart Rate, bpm, mean (SD) 64.8 (11.9)
Men without atrial fibrillation and tachycardias, % (n) 88.4 (1111)
Men who did not use beta-blockers, % (n) 71.3 (953)
Spirometryb
FEV1, L, mean (SD) 2.5 (0.6)
Men with between test variation of <3%, % (n)b,c 68.4 (858)
Men performing Lung Function test without problems, % (n) 97.5 (1226)
Physical activity score self-reported
Inactive (0–2), % (n) 17 (228)
Occasional (3–5), % (n) 23 (321)
Light (6–8), % (n) 23 (312)
Moderate (9–12), % (n) 16 (216)
Moderately Vigorous (13–20), % (n) 13 (174)
Vigorous (> = 21), % (n) 9 (126)
Sedentary behaviour self-reportedd
Watching TV/video/DVDs, minutes/day, mean (SD) 176 (111)
Total SB score: watching TV/video/DVDs, reading, using computer, driving (or sitting in) a car, minutes/day, mean (SD) 317 (146)
Men who do not report any TV/video/DVD viewing, % (n) 1.4(16)
Men who do not report any reading, % (n) 9.3 (103)
Men who do not report any PC use, % (n) 48.2 (536)
Men who do not report any driving or sitting in a car, % (n) 8.6 (96)
Objectively measured physical activity
Accelerometer number of valid days per week, mean (SD) 6.7 (0.8)
Accelerometer wear time (minutes/day), mean (SD) 854 (92)
Accelerometer wear season, % (n)
Winter (November-February) 31.2 (477)
Spring (March-May) 21.8 (333)
Summer (June-August) 23.4 (358)
Autumn (September-October) 23.6 (360)
Counts per minute, mean (95 % CI)e 183 (178,189)
a
BRHS men who met the inclusion criteria and have a self-reported PA score and a valid week of objectively measured PA b
BRHS men who met the inclusion criteria and have a self-reported PA score, a valid week of objectively measured PA, FEV1and heart rate, n = 1257 c
Men with non-missing observations for test variation (at least two spirometer blows), n = 1254 d
BRHS men who met the inclusion criteria and have a self-reported PA score, a valid week of objectively measured PA, and self-reported sedentary behaviour score, n = 1112
e
questionnaires [37]. Also, the PA score differentiated be-tween individuals performing across the range of PA levels, including at low activity levels. Hence the score could help identify low-active individuals who would most benefit from PA interventions. The PA score also differen-tiated total measured MVPA well. However the higher PA scores performed less well at identifying MVPA in bouts lasting at least 10 minutes (needed to fulfil current PA guidelines) and light physical activity; hence the question-naire may misclassify light activity levels in some of the more active adults. The total physical activity score
differentiated sedentary behaviours well: both total amount and prolonged bouts of SB declined steadily as the score increased.
Single item screening questions asking participants to rank themselves against others have been used in many large scale epidemiologic studies because they are simple to administer and have a low participant burden. They are often used to control for total amount of physical activity as a confounding variable. Our results suggested good content and construct validity of our single item question although there was a ceiling effect, so the question was
-4
0
0
-2
0
0
0
200
400
600
800
D
if
ferenc
e (ac
c
elerom
et
er)-(s
elf
report
ed) SB
200 250 300 350 400 450 500 550 600 650 700 750 800 850
Average of accelerometer and self reported sedentary time Agreement between measured and total self-reported sedentary time (mins/day)
Fig. 1Bland Altman plot for association between self-reported total SB with objectively measured SB in n=1112 men.
-4
0
0
-2
0
0
0
200
400
600
800
D
if
ferenc
e (ac
c
elerom
et
er SB)-(s
elf
report
ed T
V
)
200 250 300 350 400 450 500 550 600 650 700 750 800 850
Average of accelerometer and self reported TV time Agreement between measured and total self-reported TV time (mins/day)
Table 3Associations Between Self-Reported SB with Objectively Measured PA and SB, n = 1112 Mena
Quartiles of self-reported TV watching
Q1 (n = 321, 28.9 %) Q2 (n = 342, 30.8 %) Q3 (n = 202, 18.2 %) Q4 (n = 247, 22.2 %) Total (n = 1112, 100 %)
Mean SD or 95 % CI Mean SD or 95 % CI Mean SD or 95 % CI Mean SD or 95 % CI Mean SD or 95 % CI
Self ReportsTV watching, minutes/dayb
62 30 147 23 207 25 335 96 176 111
PA score (ranking, 0–5) 2.3 1.5 2.4 1.5 2.4 1.6 1.7 1.4 2.2 1.5
Accelerometer datacCPM 204 192,217 192 181,204 185 171,199 157 145,168 187 180,193
SB (<100 CPM) 606 597,614 614 606,622 616 606,626 647 638,657 619 615,624
SB in bouts≥60 minutese 112 102,122 117 109,126 110 100,121 144 131,157 120 115,126
Light PA (100–1040 CPM) 206 200,213 205 199,211 201 193,208 182 174,190 200 196,203
MVPA 1+ (>1040 CPM)f 44 40,47 41 37,44 38 34,43 32 28,35 39 37,41
MVPA10 + (bouts≥10 minutes)g 11 10,13 9 8,11 9 7,11 7 6,9 9 9,10
Quartiles of self-reported total SB score
Q1 (n = 282, 25.4 %) Q2 (n = 284, 25.5 %) Q3 (n = 276, 24.8 %) Q4 (n = 270, 24.3 %) Total (n = 1112, 100 %)
Mean SD or 95 % CI Mean SD or 95 % CI Mean SD or 95 % CI Mean SD or 95 % CI Mean SD or 95 % CI
Self ReportsTotal SB score,
minutes/dayd 150 51 264 24 351 26 513 105 317 146
PA score (ranking, 0–5) 2.3 1.5 2.3 1.5 2.4 1.6 1.9 1.5 2.2 1.5
Accelerometer datacCPM 202 188,215 190 178,202 191 178,203 162 151,174 187 180,193
SB (<100 CPM) 599 589,609 614 606,622 622 613,631 644 635,653 619 615,624
SB in bouts≥60 minutese 110 100,121 117 107,127 115 106,125 140 128,152 120 115,126
Light PA (100–1040 CPM) 208 201,216 207 200,213 203 197,210 179 172,186 200 196,203
MVPA 1+ (>1040 CPM)f 43 39,47 40 36,43 40 36,43 33 30,37 39 37,41
MVPA10 + (bouts≥10 minutes)g 11 9,12 9 8,11 10 8,12 8 7,10 9 9,10
PA physical activity; SB sedentary behaviour; CPM counts per minute; MVPA moderate or vigorous physical activity a
BRHS men who met the inclusion criteria: had a self-reported PA score and a valid week (≥3 days of≥600 minutes) of accelerometer data b
Mean (SD) total time watching television, min/day c
Coefficients are mean (95 % CI) minutes per day spent in each level of activity, adjusted for wear time, day order, season and region using random effects model. d
Mean (SD) total SB score (watching television + using a computer + reading + sitting in a car), min/day e
Sedentary 60+ (total number of minutes of SB in bouts lasting≥60 minutes) f
MVPA 1+ (total number of minutes of MVPA in bouts lasting≥1 minute) g
MVPA10+ (total number of minutes of MVPA in bouts lasting≥10 minutes)
Internat
ional
Journal
of
Behavioral
Nutrition
and
Physical
Activity
(2016) 13:14
Page
8
of
Table 4Associations Between Self-Reported PA Score and Components of Objectively Measured PAain n = 1337 Menb Inactive 0–2
(n = 228, 17 %)
Occasional 3–5 (n = 321, 23 %)
Light 6–8 (n = 312, 23 %)
Moderate 9–12 (n = 216, 16 %) Moderately Vigorous 13–20 (n = 174, 13 %)
Vigorous > =21 (n = 126, 9 %)
Total (n = 1377, 100 %)
Mean 95 % CI Mean 95 % CI Mean 95 % CI Mean 95 % CI Mean 95 % CI Mean 95 % CI Mean 95 % CI
CPM 94 87,102 152 143,161 197 186,209 215 202,228 231 216,246 268 248,289 183 178,189
Steps 2385 2190,2581 3945 3724,4166 5192 4919,5466 5606 5279,5932 6133 5759,6507 6809 6369,7250 4769 4630,4908
SB (<100 CPM) 671 663,680 634 627,642 611 603,619 598 589,608 598 588,608 581 567,594 620 616,624
SB in bouts >60 min.c 180 164,195 129 118,139 110 102,118 102 93,111 100 90,110 98 88,109 122 117,127
Low light PA, (101–759 CPM) 137 131,144 172 166,178 185 180,190 197 191,204 190 184,196 203 194,211 178 176,181
High light PA (760–1040 CPM) 10 9,11 16 15,17 20 19,21 24 22,25 23 21,24 28 25,30 19 18,20
MVPA 1+ (>1040 CPM)d 14 12,16 28 26,30 42 38,45 47 43,51 53 49,58 64 58,70 38 37,40
MVPA 10+ (bouts≥10 minutes )e 1 1,2 6 5,7 12 10,14 12 10,14 13 10,15 15 13,18 9 9,10
a
Coefficients are Mean (95% CI) minutes per day spent in each level of activity, adjusted for wear time, day order, season and region using a random effects model. b
BRHS men who met the inclusion criteria and have a self-reported PA score and a valid week of objectively measured PA c
Sedentary 60+ (total number of minutes of SB in bouts lasting≥60 minutes) d
MVPA 1+ (total number of minutes of MVPA in bouts lasting≥1 minute) e
MVPA10+ (total number of minutes of MVPA in bouts lasting≥10 minutes)
Internat
ional
Journal
of
Behavioral
Nutrition
and
Physical
Activity
(2016) 13:14
Page
9
of
better at ranking low-active than highly active individuals. This is important in older populations given that many other questionnaires are reported to perform more poorly in identifying low active adults. Our measure may be use-ful in population-based studies requiring a ranking of older adults’PA levels.
Strengths and limitations
We studied concurrent objectively measured and self-reported SB using commonly used activity questions and accelerometers in a large population based- sample of free-living community-dwelling older men recruited from across the UK. Whilst the cut point we used for defining MVPA from the accelerometer data are validated in rela-tion to energy expenditure in older adults (8), SB defined as <100 CPM from an Actigraph accelerometer worn over the hip could include some standing time, however aver-age CPM was <10 CPM during SB. Therefore varying the definition of SB from <100 to <50 CPM changed the total SB time recorded very little, so any biases are likely to be small. Hip-worn Actigraph-measured SB has been demon-strated to have minimal bias compared to thigh-worn Activpal measured SB and the two measures correlate r = 0.76 [38]. Accelerometer study response rates (50%) are similar or superior to other studies of older adults; in other studies valid data were obtained from 21 % [23], 43 % [22] and (in the Health Survey for England population) 37 % of women and 48 % of men over 75 years had 4 or more days with valid data [39]. Nevertheless, participants were more often younger, and had healthier behaviours than non-participants and may therefore have been more physically active and less sedentary than the general popu-lation. As this study includes only men results may not be generalizable to older women, who have different patterns of PA [21] and may have different reporting biases or re-call. Indeed it has been reported that TV time is a better indicator of SB time for women than for men [40]; future studies should investigate the properties of self-reported compared to objectively measured SB in older women.
Conclusions
Our simple PA score is useful in older adult populations for differentiating the high and low active and classifying the men across low activity levels, but may misclassify light intensity activity. The single screening question about recreational activities performed well for grading all inten-sities of PA and SB. Validity of self-reported SB was poor overall, especially at lower levels of SB, both for the single TV viewing question and for the combined 4-domain measure. This suggests that objective assessment of SB is likely to be more accurate than self-reported measures similar to those used in this study. As discussed above, more extended SB instruments used in other studies also related poorly to objective SB measures in older adults.
Given the widespread use of TV viewing as a proxy for SB in population studies, there may be implications for accur-ate estimation of the health effects of SB, particularly among individuals who watch less TV. Hence there is a need for studies examining the health effects of PA and also SB to use objective assessments.
Additional file
Additional file 1: Table S1.Physical activity and sedentary behaviour characteristics, mean (SD) or % (n), stratified by age 80 years.Table S2. Associations Between PA and SB Score and Heart Rate (Beats Per Minute) and FEV1(Litres).Table S3.Associations between self-reported recreational activity score and components of objectively measured PA (n=1337 men).1 (DOCX 21 kb)
Abbreviations
BMI:Body mass index; CHD: Coronary heart disease; CPM: Counts per minute; CVD: Cardiovascular disease; ECG: Electrocardiogram; FEV1: Forced expiratory volume in one second; HR: Heart rate; MET: Metabolic equivalent of task; MVPA: Moderate to vigorous physical activity; NRES: National research ethics service; PA: physical activity; SB: sedentary behaviour; TV: television.
Competing interests
The authors have no conflict of interest to report.
Authors’contributions
BJJ conceived and designed the study, analysed and interpreted data and drafted the manuscript. BJJ is the guarantor of the study. CS analysed and interpreted data, revised and approved of the final version of the paper, SA collected data, interpreted data and approved of the final version of the paper, LTL collected data, interpreted data and approved of the final version of the paper, SGW conceived and designed the study, interpreted data and revised and approved of the final version of the paper, PHW conceived and designed the study, collected and interpreted data and revised and approved of the final version of the paper. All authors read and approved the final manuscript.
Acknowledgements
We acknowledge the British Regional Heart Study team for data collection.
Funding information
This work was supported by a British Heart Foundation grant (PG/13/86/30546) to BJJ; a National Institute of Health Research Post-Doctoral Fellowship (2010–03–023) awarded to BJJ which also funded CS. The British Regional Heart study is supported by British Heart Foundation grants (RG/08/013/ 25942 and RG/13/16/30528). The National Institute of Health Research and British Heart Foundation had no role in the design and conduct of the study; collection, management, analysis, and interpretation of the data; preparation, review, or approval of the manuscript; and decision to submit the manuscript for publication. The views expressed in this publication are those of the author(s) and not necessarily those of the National Institute for Health Research.
Author details
1UCL Department of Primary Care & Population Health, UCL Medical School, Rowland Hill Street, London NW3 2PF, UK.2UCL Physical Activity Research Group, University College London, London, UK.3Population Health Research Institute, St George’s University of London, Cranmer Terrace, London SW17 0RE, UK.
Received: 15 August 2015 Accepted: 26 January 2016
Reference
2. Shiroma EJ, Lee IM. Physical activity and cardiovascular health: lessons learned from epidemiological studies across age, gender, and race/ethnicity. Circulation. 2010;122:743–52.
3. Chief Medical Officers of England Scotland Wales and Northern Ireland. 'Start Active, Stay Active. A report on physical activity for health from the four home countries' Chief Medical Officers. London: Crown; 2011. 4. Chaudhury M, Roth M. Physical Activity. In: Craig R, Mindell J, editors. Health
Survey for England 2006. Volume 1. Cardiovascular disease and risk factors in adults. Leeds: The Information Centre; 2008. p. 111–34.
5. Chodzko-Zajko WJ, Proctor DN, Fiatarone Singh MA, Minson CT, Nigg CR, Salem GJ, et al. American College of Sports Medicine position stand, Exercise and physical activity for older adults. Med Sci Sports Exer. 2009;41:1510–30. 6. Ford ES. Combined television viewing and computer use and mortality
from all-causes and diseases of the circulatory system among adults in the United States. BMC Public Health. 2012;12:70.
7. Wilmot EG, Edwardson CL, Achana FA, Davies MJ, Gorely T, Gray LJ, et al. Sedentary time in adults and the association with diabetes, cardiovascular disease and death: systematic review and meta-analysis. Diabetologia. 2012; 55:2895–905.
8. Stamatakis E, Hamer M, Tilling K, Lawlor DA. Sedentary time in relation to cardio-metabolic risk factors: differential associations for self-report vs accelerometry in working age adults. Int J Epidemiol. 2012;41:1328–37. 9. Gardiner PA, Clark BK, Healy GN, Eakin EG, Winkler EA, Owen N. Measuring
Older Adults' Sedentary Time: Reliability, Validity and Responsiveness. Med Sci Sports Exerc. 2011;43:2127–33.
10. Hekler EB, Buman MP, Haskell WL, Conway TL, Cain KL, Sallis JF, et al. Reliability and Validity of CHAMPS Self-Reported Sedentary-to-Vigorous Intensity Physical Activity in Older Adults. J Phys Act Health. 2012;9:225–36. 11. Cumming RG, Klineberg RJ. A Study of the Reproducibility of Long-Term
Recall in the Elderly. Epidemiology. 1994;5:116–9.
12. van Uffelen JGZ, Heesch KC, Hill RL, Brown WJ. A qualitative study of older adults' responses to sitting-time questions: do we get the information we want? BMC Public Health. 2011;11:458.
13. DiPietro L. Physical Activity in Aging: Changes in Patterns and Their Relationship to Health and Function. J Gerontol A Biol Sci Med Sci. 2001;56:13–22. 14. Wannamethee SG, Shaper AG, Walker M. Physical activity and mortality in older
men with diagnosed coronary heart disease. Circulation. 2000;102:1358–63. 15. Wannamethee SG, Shaper AG, Alberti KG. Physical activity, metabolic factors,
and the incidence of coronary heart disease and type 2 diabetes. Arch Intern Med. 2000;160:2108–16.
16. Wannamethee SG, Shaper AG, Walker M. Changes in physical activity, mortality, and incidence of coronary heart disease in older men. Lancet. 1998;351:1603–8.
17. Walker M, Whincup PH, Shaper AG. The British Regional Heart Study 1975–2004. Int J Epidemiol. 2004;33:1185–92.
18. Standardization of Spirometry, 1994 Update. American Thoracic Society. Am J Respir Crit Care Med. 1995;152:1107–36.
19. Wannamethee SG, Lowe GD, Whincup PH, Rumley A, Walker M, Lennon L. Physical activity and hemostatic and inflammatory variables in elderly men. Circulation. 2002;105:1785–90.
20. Shaper AG, Wannamethee G, Weatherall R. Physical activity and ischaemic heart disease in middle-aged British men. Br Heart J. 1991;66:384–94. 21. Jefferis BJ, Sartini C, Lee IM, Choi M, Amuzu A, Gutierrez C, et al. Adherence to
physical activity guidelines in older adults, using objectively measured physical activity in a population-based study. BMC Public Health. 2014;14:382. 22. Harris TJ, Owen CG, Victor CR, Adams R, Cook DG. What factors are
associated with physical activity in older people, assessed objectively by accelerometry? Br J Sports Med. 2009;43:442–50.
23. Davis MG, Fox KR, Hillsdon M, Sharp DJ, Coulson JC, Thompson JL. Objectively measured physical activity in a diverse sample of older urban UK adults. Med Sci Sports Exerc. 2011;43:647–54.
24. Hart TL, Swartz AM, Cashin SE, Strath SJ. How many days of monitoring predict physical activity and sedentary behaviour in older adults? Int J Behav Nutr Phys Act. 2011;8:62.
25. Copeland JL, Esliger DW. Accelerometer assessment of physical activity in active, healthy older adults. J Aging Phys Act. 2009;17:17–30.
26. Ainsworth BE, Haskell WL, Leon AS, Jacobs Jr DR, Montoye HJ, Sallis JF, et al. Compendium of physical activities: classification of energy costs of human physical activities. Med Sci Sports Exerc. 1993;25:71–80.
27. StataCorp. Stata Statistical Software: Release 13. College Station, TX: StataCorp LP; 2013.
28. R core team. R. A Language and Environment for Statistical Computing. Vienna, Austria: R Foundation for Statistical Computing; 2013.
29. Klesges RC, Eck LH, Mellon MW, Fulliton W, Somes GW, Hanson CL. The accuracy of self-reports of physical activity. Med Sci Sports Exerc. 1990;22:690–7. 30. Clark BK, Healy GN, Winkler EA, Gardiner PA, Sugiyama T, Dunstan DW, et al.
Relationship of television time with accelerometer-derived sedentary time: NHANES. Med Sci Sports Exerc. 2011;43:822–8.
31. Van Cauwenberg J, Van Holle V, De Bourdeaudhuij I, Owen N, Deforche B. Older adults' reporting of specific sedentary behaviors: validity and reliability. BMC Public Health. 2014;14:734.
32. Visser M, Koster A. Development of a questionnaire to assess sedentary time in older persons–a comparative study using accelerometry. BMC Geriatr. 2013;13:80.
33. Gennuso KP, Matthews CE, Colbert LH. Reliability and Validity of 2 Self-Report Measures to Assess Sedentary Behavior in Older Adults. J Phys Act Health. 2015;12:727–32.
34. Sedentary Behaviour Research Network. Letter to the editor: standardized use of the terms "sedentary" and "sedentary behaviours". Appl Physiol Nutr Metab. 2012;37:540–2.
35. Celis-Morales CA, Perez-Bravo F, Ibanez L, Salas C, Bailey ME, Gill JM. Objective vs. self-reported physical activity and sedentary time: effects of measurement method on relationships with risk biomarkers. PLoS One. 2012;7:e36345.
36. Atienza AA, Moser RP, Perna F, Dodd K, Ballard-Barbash R, Troiano RP, et al. Self-Reported and Objectively Measured Activity Related to Biomarkers Using NHANES. Med Sci Sports Exerc. 2011;43:815–21.
37. Prince SA, Adamo KB, Hamel ME, Hardt J, Gorber SC, Tremblay M. A comparison of direct versus self-report measures for assessing physical activity in adults: a systematic review. Int J Behav Nutr Phys Act. 2008;6:5–56. 38. Healy GN, Clark BK, Winkler EA, Gardiner PA, Brown WJ, Matthews CE.
Measurement of adults' sedentary time in population-based studies. Am J Prev Med. 2011;41:216–27.
39. Craig R, Mindell J, Hirani V. Health Survey for England 2008. Physical Activity and Fitness. Summary of Key findings. London: The Health and Social Care Information Centre; 2009.
40. Sugiyama T, Healy GN, Dunstan DW, Salmon J, Owen N. Is television viewing time a marker of a broader pattern of sedentary behavior? Ann Behav Med. 2008;35:245–50.
• We accept pre-submission inquiries
• Our selector tool helps you to find the most relevant journal
• We provide round the clock customer support
• Convenient online submission
• Thorough peer review
• Inclusion in PubMed and all major indexing services
• Maximum visibility for your research
Submit your manuscript at www.biomedcentral.com/submit