I.
Introduction
T
here are several methods available that make it possible to evaluate the user experience (UX) of a product. Well-known approaches are usability tests [1], expert reviews (for example heuristic evaluations [2]-[4] or cognitive walkthrough techniques [5][6]) and UX questionnaires [7].Usability testing and expert reviews create mainly qualitative data, while questionnaires create mainly quantitative data. In addition, due to the required effort involved in usability testing and expert reviews, these allow only to collect data from small target groups of users (typical usability tests are in the range of 10 to 15 participants) or experts (here we have rarely more than 3-5 experts involved in one evaluation).
Questionnaires on the other hand are a simple and inexpensive method (especially if they are used as online questionnaires) that allow the collection of data from larger groups of users of a product. This is especially important since the impression of a person concerning the UX of a product is highly subjective. Depending on the subject’s personality or previous experiences with the product or even similar products, the opinion of two users concerning the UX of a product can be quite different.
Assume, for example, that a new product is introduced in a company to unify certain business processes over different locations. Users in one location may have a quite difficult time to learn the new product, since concepts and handling are very different to the tools they used before the change. Users of a second location may have in contrast the impression that the new product is easy to learn or even intuitive to use, since the tools they used before were similar to the new
product concerning work flows and general user interface concepts. Concerning hedonic [8] UX aspects, for example the aesthetic impression, the users’ personal tastes or preferences also play a role. One user may find the visual design of a product appealing and interesting, while another finds it boring and unimpressive. In such situations it is quite important to collect data from a large number of individuals to get a clear and reliable view on how well the design of the product fits to the needs of the target group.
Questionnaires allow to collect data from larger samples of users and transfer the subjective impressions of those users into a numerical scale value that describes how the corresponding UX quality of the product is perceived inside the target group.
This ability to measure the user experience of a product quantitatively is quite important for several typical questions in product evaluations
[9]. First, it allows a direct comparison of different products or different design variants of a single product concerning their UX. Second, it can be used to continuously monitor the UX quality of a product over time. Third, it allows setting objective goals concerning UX by defining a threshold for the mean values of the scales of the questionnaire, which should be reached over time. Fourth, the comparison of the evaluation results of a product with a benchmark allows deciding if the UX quality of the product fulfils general user expectations [10].
User experience is a complex product characteristic [11] that results from the perception of many distinct quality aspects. These are classical task-related UX qualities, for example, efficiency of use, ease of learning, controllability, error tolerance [12], intuitive use [13], visual complexity [14], usefulness [15], or non-task related UX aspects like, fun of use [16], identity [17], aesthetics of the visual design [18], novelty of the product concept [19] or content quality [20].
However, not all of these UX aspects are of relevance for every single product [21][22]. The importance of such UX aspects can vary widely between products supporting different tasks and use cases.
Keywords
User Experience, Questionnaires, Evaluation.Abstract
Existing user experience questionnaires have a fixed number of scales. Each of these scales measures a distinct aspect of user experience. These questionnaires can be used with little effort and provide a number of useful support materials that make the application of such a questionnaire quite easy. However, in practical evaluation scenarios it can happen that none of the existing questionnaires contains all scales necessary to answer the research question. It is of course possible to combine several UX questionnaires in such cases, but due to the variations of item formats this is also not an optimal solution. In this paper, we describe the development and first validation studies of a modular framework that allows the creation of user experience questionnaires that fit perfectly to a given research question. The framework contains several scales that measure different UX aspects. These scales can be combined to cover the relevant research questions.
Design and Validation of a Framework for the
Creation of User Experience Questionnaires
Martin Schrepp
1, Jörg Thomaschewski
2*
1
SAP AG (Germany)
2
University of Applied Sciences Emden/Leer (Germany)
Received 10 May 2019 | Accepted 26 June 2019 | Published 28 June 2019
* Corresponding author.
E-mail address: [email protected]
For a simple self-service application, e.g. creating a leave request or an application to change personal data of an employee, it is crucial that it can be used intuitively, i.e. without asking for help of another person or reading a lengthy manual. Such applications are used quite infrequently, and we cannot expect that the user will remember how to use the application between two usage points. Because of the rare usage frequency, efficiency does not play a role here. An unnecessary click does not hurt much if an application is used only once in a month or even less frequently.
For a business application, for example an application to create sales orders or service requests, that is used repeatedly during a typical work day, things are completely different. Intuitive use is nice to have, but not crucial. Typically, a learning period is required for such applications to understand the use case and the mapping of real-world processes and tasks to the elements and flows of the application. Therefore, some learning is acceptable and expected by users. In addition, due to the heavy usage during a typical work day, efficiency is key for these types of applications, i.e. an unnecessary click really hurts, when it needs to be repeated 50 times a day.
The huge number of existing UX aspects and the different levels of importance for different types of products explains the high number of different UX questionnaires that are available, for example SUS [23], SUMI [24], UEQ [19], VISAWI [25], meCUE [26] or ISOMETRICS
[27], just to name a few. Each of these questionnaires realizes by its scales a different set of measured UX aspects. For example, SUS only measures overall usability and the items in this questionnaire address mainly Learnability and Efficiency of use. VISAWI measures the visual appeal of a product by 4 subscales (Simplicity, Diversity,
Colorfulness, Craftsmanship). The UEQ measures 6 distinct UX aspects (Attractiveness, Efficiency, Perspicuity, Dependability, Stimulation,
Novelty). The ISOMETRICS contains the quality aspects described in the ISO 9241 – 210 as scales. Thus, what is actually measured differs heavily between different UX questionnaires.
Of course, none of these questionnaires contains all UX aspects discussed in research literature, since this would increase the length of the questionnaire above any reasonable limit.
For a UX researcher evaluating a concrete product, this can cause some problems. If he or she has narrowed down which UX aspects are important for the users of the concrete product and should be thus measured in the evaluation, it can easily happen that no one UX questionnaire exists that contains exactly those UX aspects as scales. Sometimes, it is possible to combine several UX questionnaires to cover all relevant aspects, but usually this is also not optimal, since different questionnaires often have different item and answer formats. This makes it difficult for participants to fill out the questionnaires and makes it harder to compare the scale means obtained from different questionnaires.
In this paper, we try to address this dilemma by introducing a modular framework that allows the researcher to select the relevant UX aspects out of a larger catalogue of UX scales. All UX scales have a common item and answer format and can thus easily be combined to create a UX questionnaire fitting to the research question behind a product evaluation.
II.
Previous Work in the Field
The UEQ+ framework is based on some earlier work which we describe here shortly to make the connection transparent.
In [21][22] it is investigated how important different UX aspects (for example, Efficiency, Stimulation, Trust, Aesthetics) are for certain types of products (for example, social networks, word processing, programming tools, web sites, messengers). The study uses 16 UX
aspects extracted from research papers and from an extensive study of the scales used in existing UX questionnaires. Participants of the studies rated the importance of these UX aspects for 15 product categories. Both studies found some clear dependencies between the different product types and the importance ratings for the UX aspects.
Based on the results, it is possible to provide a recommendation on which UX aspects are important for a product category and should therefore be measured in UX evaluations of product of this type [7]. The UX aspects investigated in these studies are good candidates for a framework that should be able to help synthesize UX questionnaires.
Follow-up research [28] shows that quite similar importance ratings are obtained in the context of another culture (Indonesia). The importance of an UX aspect for a type of product thus seems to be mainly a result of the characteristics of the product and not so much by cultural aspects.
The User Experience Questionnaire (UEQ) is an established and widely used UX questionnaire. It already contains the 6 UX scales
Attractiveness, Efficiency, Perspicuity, Dependability, Stimulation and
Novelty[19]. Scales are represented by 4 items (except Attractiveness
which contains 6 items) that represent two terms with opposite meanings, for example:
difficult to learn o o o o o o o easy to learn boring o o o o o o o exciting inefficient o o o o o o o efficient
slow o o o o o o o fast
Thus, the UEQ is a semantic differential with a 7-point Likert-scale for the answers. The simple item format seems to be quite suitable to define additional scales.
This was already used by some authors to define extension scales for some special product types. In [29], a scale to measure Trust was defined. This UX aspect is, for example, highly relevant for online banking applications or web shops.
For household appliances there are also quite specialized UX requirements that strongly influence the overall impression of a product. In [30], two scales for the sounds caused by the operation of a household appliance and for the haptic feeling were developed.
Due to the item format and the fact that a number of scales in a common format already exist, it was decided to base the framework on the UEQ. To make this connection evident, the name UEQ+ was chosen for the framework.
III.
Changes in the Item Format
Due to the requirement that it should be possible to combine scales depending on the examined product type, some changes concerning the item format are necessary. We assume that the researcher can freely decide which combination of the available scales he or she wants to use. In addition, the order in which the scales appear in the final questionnaire is up to the researcher.
In the UEQ, the order of the items is randomized. This is also true for the polarization of the items, where half of the items show the positive term in the left position (fast o o o o o o o slow) and the other half in the right position (boring o o o o o o o exciting).
Some studies (currently unpublished) showed that the polarization of the items does not influence the UEQ scale means (see also [30]), so we decided to use a common scheme with the negative term left and the positive term right for the UEQ+ scales.
some context for the correct interpretation of the terms. This is done by introducing a short sentence that is shown on top of the items of a scale and that somehow set a context for the common interpretation of the items.
Thus, a scale in the UEQ+ has the following format (as an example we present the scale Efficiency):
To achieve my goals, I consider the product as slow o o o o o o o fast inefficient o o o o o o o efficient impractical o o o o o o o practical cluttered o o o o o o o organized
I consider the product property described by these terms as Completely
irrelevant o o o o o o o Very important
Thus, we have the statement that connects the items of the scale, then the 4 items with the negative term on the left and the positive term on the right and a final rating concerning the importance of the scale for the overall UX impression of the product. We describe the role of this importance rating at a later point in detail.
IV.
Creation of Additional Scales
The UEQ already contains 6 suitable scales that were simply adopted into the UEQ+ (for the scale Attractiveness, two of the 6 items were removed to have 4 items for all scales). The same is true for the already available extensions for Trust, Haptics and Acoustics.
The list of UX aspects from [21] [22] was reviewed and the following UX aspects were selected for scale creation: Aesthetics,
Adaptability, Usefulness, Intuitive Use, Value, and Content Quality. Two experts then constructed for every UX aspect a set of items in the UEQ format which describe the aspect semantically. Item suggestions were jointly discussed and consolidated.
In an empirical study, 192 subjects (students that participated on a voluntary basis) rated several products with the corresponding lists of candidate items on a 7-point Likert scale. The average age of the participants (119 male, 73 female) was 30.42 years.
The resulting data were then analysed by principal component analysis. The analysis was done by the function principal of the R package psych[32]. It was first checked if a one-dimensional solution fits well to the data (which should be the case due to the fact that all items in a candidate set describe the same UX aspect).
We show as an example the candidate set and analysis for the UX aspect Beauty. A description for the data analysis for all scales can be found in [33].
The set of candidate items was given as: ugly / beautiful, lacking style / stylish, unappealing / appealing, ugly in colour / beautiful in colour, inharmoniously / harmoniously, unpleasant / pleasant, not artistically / artistically, thoughtlessly / thought out.
The original German candidate items used in the study are: hässlich / schön, stillos / stilvoll, nicht ansprechend / ansprechend, farblich unschön / farblich schön, unharmonisch / harmonisch, unästhetisch / ästhetisch, nicht kunstvoll / kunstvoll, unüberlegt / durchdacht.
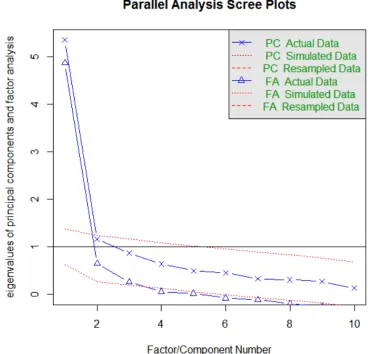
The scree plot of the principal component analysis (see Fig. 1) clearly shows that a one-dimensional solution fits the data well. Proportion of variance explained is 0.64. The fit based upon off diagonal values is 0.99 (values > 0.95 indicate a good fit).
Fig. 1. Scree plot resulting from the principal component analysis of the items for the UX aspect Beauty.
The corresponding loadings of the items on the factor are shown in Table I.
TABLE I. Loadings of the Items on the Factor
Item Loading
ugly / beautiful 0.89
lacking style / stylish 0.86
unappealing / appealing 0.88
ugly in colour / beautiful in colour 0.79
not harmoniously / harmoniously 0.84
unpleasant / pleasant 0.88
not artistically / artistically 0.63
thoughtlessly / thought out 0.51
Thus, the 4 items with the highest loadings (highlighted in bold in Table I) were selected to form the new scale Beauty.
If the one-dimensional solution fits the data well, we choose as in this example the 4 items with the highest loading on the factor as representatives for the new UEQ+ scale. This was the case for all UX aspects with the exception of Content Quality (see [33]).
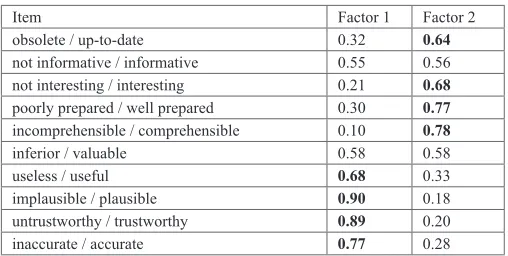
For Content Quality, a two-dimensional solution fits the data better (see Fig. 2), i.e. there are two different dimensions detected in exploratory principal component analysis. Since the two detected factors could be interpreted, we decided to split this UX aspect into two scales Trustworthiness of Content and Content Quality.
Table II shows the loadings of the candidate items for Content Quality on the two factors extracted by principal component analysis.
TABLE II. Factor loadings for the items of Content Quality
Item Factor 1 Factor 2 obsolete / up-to-date 0.32 0.64
not informative / informative 0.55 0.56 not interesting / interesting 0.21 0.68
poorly prepared / well prepared 0.30 0.77
incomprehensible / comprehensible 0.10 0.78
inferior / valuable 0.58 0.58 useless / useful 0.68 0.33 implausible / plausible 0.90 0.18 untrustworthy / trustworthy 0.89 0.20 inaccurate / accurate 0.77 0.28
The items loading high on the first factor express trust in the correctness of the provided information. Items loading on the second factor cover semantically the actuality and quality of the information. Thus, we named the two factors Trustworthiness of Content and
Content Quality.
V.
Scales Included in the UEQ+ Framework
The UEQ+ framework currently offers the following UX scales; we show here only the scale names and a short description of the semantic meaning of the scale. The items per scale are listed in Appendix 1.
• Attractiveness: Overall impression from the product. Do users like or dislike the product?
• Efficiency: Users have the impression that they can complete their tasks without unnecessary effort.
• Perspicuity: Subjective impression that it is easy to get familiar with the product. It is easy to learn how to use the product. • Dependability: The user has the impression that he or she controls
the interaction.
• Stimulation: Feeling that it is exciting and motivating to use the product.
• Novelty: Feeling that the product is innovative and creative. The product catches the interest of the user.
• Trust: Subjective impression that the data entered into the product are in safe hands and are not used to the detriment of the user. • Aesthetics: Impression that the product looks nice and appealing. • Adaptability: Subjective impression that the product can be easily
adapted to personal preferences or personal working styles. • Usefulness: Subjective impression that using the product brings
advantages, saves time or improves personal productivity.
• Intuitive Use: Subjective impression that the product can be used immediately without any training, instructions or help from other persons.
• Value: Subjective impression that the product is of high quality and professionally designed.
• Trustworthiness of Content: Subjective impression that the information provided by the product is reliable and accurate. • Quality of Content: Subjective impression if the information
provided by the product is up to date, well-prepared and interesting. • Haptics: Subjective feelings resulting from touching the product. • Acoustics: Subjective impression concerning the sound or operating
noise of the product.
VI.
Importance Rating and KPI
In some use cases it is beneficial to measure not only the means for the different scales, but to provide also a single number (a key performance indicator, or KPI) that summarizes the single scales and can be interpreted as a measure for the overall impression concerning UX.
An extension to calculate such a KPI for the UEQ is described in
[34]. The same principle is used for the calculation of a KPI for the UEQ+. The basic idea is to calculate per participant the weighted sum of the scale means with the relative importance ratings. The KPI is then the average of these values of all participants. For the exact formula of the calculation please refer to [34].
VII.
First Validation Studies
To evaluate the scale quality, the three product categories Web Shops, Video Platforms and Programming Environments were selected. Two products popular in Germany were chosen per product category (Web Shops: Otto.de, Zalando.de; Video Platforms: Netflix, Amazon Prime; Programming Environments: Eclipse, Visual Studio).
For each product category, a specialized UX questionnaire containing the scales that seemed to be most important for products of this category (see [22] for details) was constructed.
For web shops, these are the scales Attractiveness, Dependability,
Intuitive Use, Visual Aesthetics, Quality of Content, Trustworthiness of Content, Trust and Value.
For video platforms, the scales Attractiveness, Perspicuity,
Intuitive Use, Visual Aesthetics, Quality of Content, Trustworthiness of Content and Trust were used.
For programming environments, the questionnaire consists of the scales Attractiveness, Dependability, Perspicuity, Efficiency,
Usefulness, Personalization and Value.
Participants were recruited per e-mail campaigns and by links posted to web sites. Each participant had the choice to rate one product that he or she used regularly from one of the product categories, thus we have different numbers of ratings for the different products (see Table III).
TABLE III. Overview over the 6 Product Evaluations
Product N Age Sex Time [ms] Clicks
otto.de 42 34 16 m, 25 f, 1 NA 202,899 54
zalando.de 46 31 20 m, 24 f, 2 NA 187,803 53
Netflix 73 31 42 m, 27 f, 4 NA 211,112 48
Amazon Prime 57 32 36 m, 21 f 259,491 47
Eclipse 14 36 7 m, 4 f, 3 NA 368,552 42
Visual Studio 29 32 25 m, 1 f, 3 NA 225,006 50
Please note that 4 items and the importance of the scale must be rated for every scale. Thus, for 8 scales this requires 40 clicks. In addition, the overall satisfaction must be rated, and two clicks are required to state age and gender.
Thus, filling out the corresponding questionnaires seems to not require much effort from the participants. They spend around 4 minutes (= 240,000 milliseconds) in answering the questions and in addition selected answers seem to not have been changed too often afterwards. This indicates that the used terms are not problematic or difficult to understand.
TABLE IV. Scale Means, Standard Deviations and Cronbachs Alpha for the Examined Web Shops
Scale Motto.de [N = 42]STD Alpha Mzalando.de [N=46]STD Alpha
Attractiveness 1.30 1.19 0.93 1.68 1.09 0.92
Dependability 1.58 1.08 0.82 2.02 0.89 0.85
Intuitive Use 1.57 1.09 0.94 2.13 0.87 0.90
Vis. Aesthetics 0.89 1.41 0.95 1.47 1.29 0.95
Q. Content 1.35 1.13 0.89 1.91 0.96 0.78
Trustw. Content 1.33 1.15 0.86 1.73 1.02 0.81
Trust 1.28 1.20 0.90 1.26 1.19 0.93
Value 0.93 1.24 0.93 1.58 1.16 0.88
The scale means (see Table IV) are, with the exception of Trust,
lower for otto.de than for zalando.de. That there is no difference for
Trust is quite natural, since both shops are quite established shops with a longer history. The scales obviously allow to differentiate between different products.
TABLE V. Scale means, Standard Deviations and Cronbachs Alpha for the Examined Video Platforms
Scale M Netflix [N=73]STD Alpha Amazon Prime [N=57]M STD Alpha
Attractiveness 2.13 1.06 0.95 1.61 1.14 0.90
Perspicuity 2.04 1.19 0.80 1.62 1.41 0.91
Intuitive Use 1.86 1.16 0.90 1.36 1.38 0.94
Vis. Aesthetics 1.58 1.17 0.89 1.01 1.28 0.94
Q. Content 1.83 1.23 0.84 1.49 1.27 0.82
Trustw. Content 1.48 1.12 0.87 1.46 1.21 0.87
Trust 1.03 1.40 0.90 0.71 1.73 0.96
Except for Trustworthiness of Content (see Table V), the ratings are higher for Netflix than for Amazon Prime, which is not unexpected since the source of content of both tools is quite similar concerning trustworthiness. Again, the other scales differentiate between the two products.
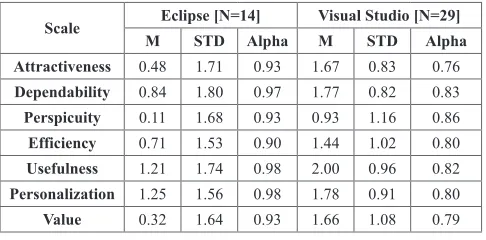
TABLE VI. Scale Means, Standard Deviations and Cronbachs Alpha for the Evaluated Programming Environments
Scale Eclipse [N=14] Visual Studio [N=29]
M STD Alpha M STD Alpha
Attractiveness 0.48 1.71 0.93 1.67 0.83 0.76
Dependability 0.84 1.80 0.97 1.77 0.82 0.83
Perspicuity 0.11 1.68 0.93 0.93 1.16 0.86
Efficiency 0.71 1.53 0.90 1.44 1.02 0.80
Usefulness 1.21 1.74 0.98 2.00 0.96 0.82
Personalization 1.25 1.56 0.98 1.78 0.91 0.80
Value 0.32 1.64 0.93 1.66 1.08 0.79
Visual Studio ratings (see Table VI) are for all scales much higher than the ratings for Eclipse. It must, however, be noted that we had only a small number of participants for programming environments, thus these results need to be interpreted with care.
In general (see Table IV, V, VI), the Cronbach Alpha values for all evaluated products are extremely high. Cronbach Alpha is an indicator for scale consistency based on the correlations of the items within a scale. Values above 0.7 are usually interpreted as reasonably high scale quality. The observed values for the scales of the UEQ+ are in all cases above this threshold.
The observed ratings for the importance of the scales confirm that the selected scales were considered as important for the evaluated products by the participants. Detailed values of the importance ratings
and some additional information concerning the scale means can be found in [33].
As described above, it is possible to calculate a KPI using the scale means and the importance ratings of the scales. This KPI is interpreted as an indicator for the overall satisfaction concerning the UX of the product. To verify this assumption, each online questionnaire contains as one last point the item:
Overall, concerning the user friendliness of <Product> I am Very dissatisfied o o o o o o o Very satisfied
Table VII shows the correlation of the ratings of this item to the calculated KPI.
TABLE VII. Satisfaction Ratings and KPI for All Studies
Product Satisfaction KPI Corr
M STD M STD
otto.de 5.48 1.24 1.27 0.90 0.71
zalando.de 5.65 0.91 1,70 0.69 0.66
Netflix 6.06 0.99 1.73 0.74 0.77
Amazon Prime 5.30 1.08 1.35 0.87 0.78
Eclipse 4.21 1.74 0.40 1.37 0.83
Visual Studio 5.55 0.97 1.59 0.57 0.71
Correlations between the satisfaction ratings and the calculated KPI are quite high. Thus, our interpretation of the KPI seems to be valid. In addition, since the correlation seems to be quite stable over different products and combinations of scales (each product category was evaluated with different sets of UEQ+ scales), it may be possible to develop a benchmark for the KPI that can be used independently of the selected scales for an evaluation.
VIII.
Advantages and Disadvantages of a Modular
Construction of UX Questionnaires
The big advantage of the UEQ+ is that it allows researchers to create UX questionnaires perfectly adapted to the research question, i.e. such a questionnaire contains exactly the scales that need to be measured. In addition, all scales follow a uniform item format, which makes it easy for the participants to answer the items.
But such a modular approach is not without its shortcomings. There are some disadvantages compared to using a standard questionnaire like the UEQ out of the box.
Obviously, the effort to set up the questionnaire is higher. An application of the UEQ+ requires that the researcher have a clear picture concerning the UX aspects that are relevant for the product and should therefore be measured. There are some recommendations available that show how important different UX aspects are for different types of products (see [22] and [7]). In addition, the UEQ+ handbook (can be downloaded from www.ueqplus.ueq-research.org) contains some detailed suggestions concerning the most relevant UEQ+ scales for several typical product categories. But of course, not all products will fall into one of the described product categories in these papers and it must be checked if there are maybe exceptions for a specific product.
Most standard questionnaires offer some tools for data analysis. Thus, it is sufficient to collect the data, drop it to the tool and not all, but many important analyses are done automatically. We also offer a data analysis tool (can be downloaded free of charge from www. ueqplus.ueq-research.org), but since the scale structure of the resulting questionnaire is not fixed, this tool only provides limited support.
mean? Is this a good, medium or bad value compared to other products? Standard questionnaires, for example the UEQ itself [19] or the SUS [23] or VISAWI [25], offer large benchmark data sets that are based on evaluation results for larger sets of different products. Thus, a simple comparison of the result obtained in an evaluation to the results in the benchmark data set offers some insights concerning the question of how good or bad the impression of users towards the product is compared to other available products.
For the scales from the UEQ, such a benchmark is available, for the newly added scales this is at the moment not the case. For some frequently used scales this situation may change, but some of the scales are obviously only relevant for special types of products, so it may take a long time until a benchmark in the quality of the UEQ benchmark will be available for all scales of the UEQ+.
IX.
When to use UEQ+?
Given the remarks concerning the advantages and disadvantages of a modular questionnaire, it is possible to give some recommendations. If you are setting out to evaluate a single product and your main research question is to get an idea about the UX quality of this product, you should use the UEQ. Even if some of the scales do not perfectly match your product or if some scales that you think are important are missing, the availability of the UEQ benchmark and the ease of use of the available material, like the data analysis tool, would clearly speak for using the UEQ.
If you are planning to evaluate the same product multiple times, for example to get an insight if the product improves over time, and if the UEQ scales do not capture most of the UX aspects you consider relevant, then opting for your own special questionnaire built with the UEQ+ is the better choice. In this scenario, the lack of a benchmark is not a big issue, since you are mainly interested in comparing multiple measurements of the same product over time. Thus, capturing the UX quality in an optimized form is more important here.
If you want to set up an UX measurement as part of your quality process for a larger suite of similar products (in the sense that the same UX aspects apply to all of them) and if the scales of the original UEQ do not fit well to your needs, then it is also recommended to set up your own questionnaire using the UEQ+. In this case the additional effort required is minor, since you do this only once and reuse it in a large number of concrete evaluations. In addition, the lack of a benchmark is not so important, since over time you will generate your own data set of evaluations that will help to interpret then the results obtained for a single product, i.e. in such a scenario you will quickly generate enough data yourself.
X.
Conclusions and Further Work
We described the development of a modular framework for the creation of UX questionnaires. This framework allows the researcher to select the UX aspects that are relevant for a certain product from a list of existing UX scales. Thus, a customized questionnaire containing exactly those UX scales that are important for the users of the product can be created.
Currently, the UEQ+ framework contains 16 scales. Of course, they do not cover the entire concept of UX. Other scales may be required for some products and new use cases and product types entering the market in the future will create the need for different, not-yet-considered UX scales. Thus, a framework like the UEQ+ is always a work in progress and at no point in time will it be truly finished. We will try to provide some additional scales in the near future and hope that other researchers will (as they did already by constructing some of
the extension scales for the UEQ) help to provide new scales, which we can then integrate into the UEQ+ framework.
Another important area of future work is the improvement of the existing benchmarks. This simply requires time to collect sufficiently large sets of data.
Six of the UEQ+ scales are concerning their items identical to the original UEQ scales. However, the item format is slightly changed. Items of a scale are grouped in the UEQ+ and the positive term is always right (in the original UEQ items appear in random order and polarity). In addition, a statement has been added that described the common meaning of all items in a scale. It is currently not fully investigated if these changes have an impact on the results, i.e. if the scale means obtained from the UEQ+ scales are fully comparable to the scale means of the corresponding UEQ scales. We expect only minor deviations, but this must be of course evaluated in further studies.
Currently, the items for the extension scales of the UEQ are available only in German and English. The six scales taken over directly from the UEQ are available in more than 20 languages (see, for example, [35][36]
for the description of the Spanish and Portuguese language versions). Of course, we hope to provide some more translations in the future.
Appendix I
In the following we present the complete list of scales and items available in the UEQ+ framework.
Attractiveness
In my opinion, the product is generally: • annoying / enjoyable
• bad / good
• unpleasant / pleasant • unfriendly / friendly
Efficiency
To achieve my goals, I consider the product as: • slow / fast
• inefficient / efficient • impractical / practical • organized / cluttered
Perspicuity
In my opinion, handling and using the product are: • not understandable / understandable
• difficult to learn / easy to learn • complicated / easy
• clear / confusing
Dependability
In my opinion, the reactions of the product to my input and command are: • unpredictable / predictable
• obstructive / supportive • not secure / secure
• does not meet expectations / meets expectations
Stimulation
In my opinion, handling and working with the product are: • inferior / valuable
• boring / exciting
• not interesting / interesting • demotivating / motivating
Novelty
• dull / creative
• conventional / inventive • common / cutting edge • conservative / innovative
Trust
Regarding the use of my personal information and data, the product is: • insecure / secure
• untrustworthy / trustworthy • unreliable / reliable • non-transparent / transparent
Aesthetics
In my opinion, the visual design of the product is: • ugly / beautiful
• lacking style / stylish • unappealing / appealing • unpleasant / pleasant
Adaptability
Regarding my personal requirements and preferences, the product is: • not adjustable / adjustable
• not changeable / changeable • inflexible / flexible • not extendable / extendable
Usefulness
I consider the possibility of using the product as: • useless / useful
• not helpful / helpful • not beneficial / beneficial • not rewarding / rewarding
Intuitive Use
In my opinion, using the product is: • difficult / easy
• illogical / logical • not plausible / plausible • inconclusive / conclusive
Value
I generally consider the design of the product as: • inferior / valuable
• not presentable / presentable • tasteless / tasteful
• not elegant / elegant
Trustworthiness of Content
In my opinion, the information and data provided by the product are: • useless / useful
• implausible / plausible • untrustworthy / trustworthy • inaccurate / accurate
Quality of Content
In my opinion, the information and data provided by the product are: • obsolete / up-to-date
• not interesting / interesting • poorly prepared / well prepared • incomprehensible / comprehensible
Acoustics
The noise during use of the product is:
• loud / quiet • dissonant / melodic • booming / dampened • piercing / soft
Haptics
In my opinion, the surface of the product is: • unstable / stable
• unpleasant to the touch / pleasant to the touch • rough / smooth
• slippery / slip-resistant
References
[1] Dumas, J. S. & Redish, J. (1999). A practical guide to usability testing. Intellect books.
[2] Nielsen, J., & Molich, R. (1990). Heuristic evaluation of user interfaces. In Proceedings of the SIGCHI conference on Human factors in computing systems, pp. 249-256. ACM.
[3] Nielsen, J. (1994). Enhancing the explanatory power of usability heuristics. In Proceedings of the SIGCHI conference on Human Factors in Computing Systems, pp. 152-158. ACM.
[4] Bader, F., Schön, E.-M., Thomaschewski, J. (2017). Heuristics Considering UX and Quality Criteria for Heuristics. International Journal of Interactive Multimedia and Artificial Intelligence, Vol. 4, No. 6, pp. 48-53. DOI: 10.9781/ijimai.2017.05.001.
[5] Wharton, C., Rieman, J., Lewis, C. & Polson, P. (1994). The cognitive walkthrough method. A practioner’s guide. In: Jakob Nielsen, Robert L. Mack (Ed.): Usability Inspection Methods, pp. 105–140. John Wiley & Sons, New York NY.
[6] Lewis, C., & Wharton, C. (1997). Cognitive walkthroughs. In Handbook of human-computer interaction, pp. 717-732. North-Holland.
[7] Schrepp, M. (2018). User Experience mit Fragebögen messen [Measure user experience with questionnaires]. Amazon Kindle Direct Publishing, ISBN: 9781986843768.
[8] Hassenzahl, M. (2001). The effect of perceived hedonic quality on product appealingness. International Journal of Human-Computer Interaction 13(4), pp. 481–499.
[9] Schrepp, M., Hinderks, A., & Thomaschewski, J. (2014). Applying the user experience questionnaire (UEQ) in different evaluation scenarios. In International Conference of Design, User Experience, and Usability, pp. 383-392. Springer, Cham.
[10] Schrepp, M., Hinderks, A., & Thomaschewski, J. (2017). Construction of a Benchmark for the User Experience Questionnaire (UEQ). International Journal of Interactive Multimedia and Artificial Intelligence, Vol. 4, No. 4, pp. 39- 45. DOI: 10.9781/ijimai.2017.445.
[11] Preece, J., Rogers, Y., Sharp, H., Benyon, D., Holland, S. & Carey, T. (1994). Human-Computer Interaction. Workinghal, Addison-Wesley.
[12] ISO 9241-210: Ergonomics of Human-System interaction – Part 210. Human centred design for interactive systems. International Organization for Standardization.
[13] Naumann, A., Hurtienne, J., Israel, J. H., Mohs, C., Kindsmüller, M. C., Meyer, H. A., & Hußlein, S. (2007). Intuitive use of user interfaces: defining a vague concept. In: International Conference on Engineering Psychology and Cognitive Ergonomics, pp. 128-136. Springer, Berlin, Heidelberg.
[14] Comber, T., & Maltby, J. R. (1997). Layout complexity: does it measure usability?. In: Human-Computer Interaction INTERACT’97, pp. 623-626. Springer, Boston, MA.
[15] Davis, F. D., Bagozzi, R. P., & Warshaw, P. R. (1989). User acceptance of computer technology: a comparison of two theoretical models. Management science, 35(8), pp. 982-1003.
[16] Hatscher, M. (2001). Joy of use-Determinanten der Freude bei der Software-Nutzung [Determinants of enjoyment during use of software]. In: Mensch & Computer [Humans & computers] 2001: 1. Fachübergreifende Konferenz [Interdisciplinary conference]. BG Teubner.
of perceived hedonic and pragmatic quality]. In: Ziegler, J. & Szwillus, G. (Ed.), Mensch & Computer [Humans & computers] 2003. Interaktion in Bewegung [Interaction in movement], S. 187-196, Stuttgart, Leipzig: B.G. Teubner.
[18] Moshagen, M., & Thielsch, M. T. (2010). Facets of visual aesthetics. International journal of human-computer studies, 68(10), pp. 689-709.
[19] Laugwitz, B.; Schrepp, M. & Held, T. (2006). Konstruktion eines Fragebogens zur Messung der User Experience von Softwareprodukten [Construction of a questionnaire for the measurement of user experience of software products]. In: A.M. Heinecke & H. Paul (Eds.): Mensch & Computer [Humans & computers] 2006 - Mensch und Computer im Strukturwandel [Humans and computers in times of change in structure]. Oldenbourg Verlag, pp. 125 – 134.
[20] Thielsch, M. T., Blotenberg, I., & Jaron, R. (2014). User evaluation of websites: From first impression to recommendation. Interacting with Computers, 26(1), pp. 89-102.
[21] Winter, D., Schrepp, M., & Thomaschewski, J. (2015). Faktoren der User Experience-Systematische Übersicht über produktrelevante UX-Qualitätsaspekte [Factors of user experience - A systematic overview of product-related UX quality aspects]. In: Mensch und Computer [Humans and computers] 2015–Usability Professionals.
[22] Winter, D., Hinderks, A., Schrepp, M., & Thomaschewski, J., (2017). Welche UX Faktoren sind für mein Produkt wichtig? [Which UX factors are important for my product?] In: Hess, S. & Fischer, H. (Ed.), Mensch und Computer [Humans and computers] 2017 - Usability Professionals. Regensburg: Gesellschaft für Informatik e.V., pp. 191 – 200.
[23] Brooke, J. (1996). SUS-A quick and dirty usability scale. Usability evaluation in industry, 189(194), pp. 4-7.
[24] Kirakowski, J., & Corbett, M. (1993). SUMI: The software usability measurement inventory. British journal of educational technology, 24(3), pp. 210-212.
[25] Thielsch, M. T., & Moshagen, M. (2011). Erfassung visueller Ästhetik mit dem VisAWI [Capture of visual aesthetics with VisAWI]. Tagungsband [Conference transcript] UP11.
[26] Minge, M. & Riedel, L. (2013). meCUE – Ein modularer Fragebogen zur Erfassung des Nutzungserlebens [meCue – A modular questionnaire for capturing the user experience]. In: S. Boll, S. Maaß & R. Malaka (Ed.): Mensch und Computer [Humans and computers] 2013: Interaktive Vielfalt [Interactive diversity], pp. 89-98. München, Oldenbourg Verlag.
[27] Gediga, G., Hamborg, K. C., & Düntsch, I. (1999). The IsoMetrics usability inventory: an operationalization of ISO 9241-10 supporting summative and formative evaluation of software systems. Behaviour & Information Technology, 18(3), pp. 151-164.
[28] Schrepp, M., & Santoso, H. (2018). Has Culture an Impact on the Importance of UX Aspects? In: Mensch und Computer [Humans and computers] 2018-Workshopband [Workshop transcript].
[29] Hinderks, A. (2016). Modifikation des User Experience Questionnaire (UEQ) zur Verbesserung der Reliabilität und Validität [Modification of the user experience (UEQ) for the improvement of reliability and validity]. Unpublished Master Thesis, University of Applied Sciences Emden/Leer.
[30] Boos, B. & Brau, H. (2017). Erweiterung des UEQ um die Dimensionen Akustik und Haptik [Extension of the UEQ by the dimensions acoustics and haptics]. In: Hess, S. & Fischer, H. (Eds.), Mensch und Computer [Humans and computers] 2017 – Usability Professionals, Regensburg: Gesellschaft für Informatik e.V., pp. 321-327.
[31] Sauro, J., & Lewis, J. R. (2011). When designing usability questionnaires, does it hurt to be positive?. In: CHI Proceedings, pp. 2215-2224.
[32] Revelle, W. (2018) psych: Procedures for Personality and Psychological Research, Northwestern University, Evanston, Illinois, USA, https:// CRAN.R-project.org/package=psych Version = 1.8.12.
[33] Schrepp, M. & Thomaschewski, J. (2019). Construction and first Validation of Extension Scales for the User Experience Questionnaire (UEQ). Research Report University of Applied Sciences Emden/Leer. DOI: 10.13140/RG.2.2.19260.08325.
[34] Hinderks, A., Schrepp, M., Domínguez Mayo, F.J., Escalona, M.J., Thomaschewski, J. (2019). Developing a UX KPI based on the User Experience Questionnaire. Computer Standards & Interfaces. DOI: 10.1016/j.csi.2019.01.007.
[35] Rauschenberger, M., Schrepp, M., Cota, M.P., Olschner, S. & Thomaschewski, J. (2013). Efficient measurement of the user experience of interactive products - How to use the User Experience Questionnaire
(UEQ). Example: Spanish Language Version. In: International Journal of Interactive Multimedia and Artificial Intelligence, Vol. 2, No. 1, pp. 39- 45. DOI: 10.9781/ijimai.2013.215.
[36] Cota, M.P.; Thomaschewski, J.; Schrepp, M. & Goncalves, R. (2013). Efficient Measurement of the User Experience- A Portuguese Version of the User Experience Questionnaire. In: Procedia Computer Science, Vol. 27, 5th International Conference on Software Development and Technologies for Enhancing Accessibility and Fighting Info-exclusion, DSAI 2013, pp. 491 – 498. DOI: 10.1016/j.procs.2014.02.053.
Martin Schrepp
Martin Schrepp has been working as a user interface
designer for SAP AG since 1994. He finished his diploma
in mathematics in 1990 at the University of Heidelberg (Germany). In 1993 he received a PhD in Psychology (also from the University of Heidelberg). His research interests are the application of psychological theories to improve the design of software interfaces, the application of Design for All principles to increase accessibility of business software, measurement of usability and user experience, and the development of general data analysis
methods. He has published several papers concerning these research fields.
Jörg Thomaschewski