264
Copyright © 2011-15. Vandana Publications. All Rights Reserved.
Volume-5, Issue-2, April-2015
International Journal of Engineering and Management Research
Page Number: 264-268
A Study on Customers’ Satisfaction towards DTH Service in
Gobichettipalayam Town
Dr. M.Sudhahar1, Ms. T. Tamilarasi2
1
Associate Professor in Commerce, Gobi Arts & Science College, Gobichetti Palayam , INDIA
2
Assistant Professor in Commerce (CA), Kongu Arts & Science College, Erode, INDIA
ABSTRACT
DTH stands for Direct- To- Home television. DTH television service is that we would not dependant on the cable operator because of their domination over the market and they have autonomy of prices and about quality of services. Though the concept of marketing has been followed by sellers, the service provider’s attitude will change after made the customers to purchase. The study has been undertaken to find out the satisfaction of customers and the quality of service provided by the service providers and how far they are providing the after sale service to the customers with regard to DTH service.
Keywords--- DTH, Direct to Home Television,
satisfaction.
I.
INTRODUCTION
The growing middle class and rising disposable income coupled with the rising number of television households over the years has assisted growth of investment in this service besides it is costlier than the cable operators. It should be said that it is worth the money because the service providers offer variety of interactive services and there is reduced service breakdown with DTH television service, signal reception would be clear without breakdown.
Hence this study has been done to know the factors consider at the time of purchasing, customer satisfaction level and the problems faced by the DTH users. The 200 sample respondents were selected and data have been collected from there by interview schedule. By the study we can come to know the expectations of the customers with regard to brands and about the quality of service in the DTH service.
II.
OBJECTIVES OF THE STUDY
The present study is undertaken with the following specific objectives:
1. To study the factors considered at the time of purchasing DTH.
2. To know the level of satisfaction of DTH users. 3. To find out the problems faced by DTH users.
III.
HYPOTHSES
Hypothesis on the basis of framed objectives of the study, the researcher’s theoretical knowledge, discussions with field experts and from other research studies, the following null hypothesis has been framed and these are subjected to appropriate statistical test.
H01
In regard to selection of sample respondents 200 DTH users from the Gobichettipalayam town have been selected on the basis of convenience sampling technique. This study is an empirical study based on survey method. : There is no significant relationship between various independent variable (Gender, Educational status, Occupation, Marital status, Family size, Decision maker of the family, Duration of having DTH mode of connection) of the DTH users and their level of awareness about DTH service.
IV.
RESEARCH DESIGN AND SAMPLE
DESIGN
265
Copyright © 2011-15. Vandana Publications. All Rights Reserved.
The primary data have been collected through the surveymethod by direct personal interview with the sample respondents.
V.
LIMITATIONS OF THE STUDY
The study is confined to Gobichettipalayam town, which may not truly present for the entire population. Hence the survey may or may not be applicable for other geographical area.
The study has been conducted for a limited period of time.
Some of the customers are not co-operating. They feel participating in this survey does not give any benefit to them. So the researcher has faced few problems to collect the data such as unwillingness of respondents.
VI.
TOOLS USED FOR DATA
ANALYSIS
After the collected data have been processed, it is necessary that this data be analyzed. There are several statistical techniques available to do this. Some of the important statistical tools used by the researcher in this study are as follows:
VII.
PERCENTAGE METHOD
Percentage method refers to a special kind of ratio. In this study, the researcher used this method for making a comparison between two or more series of data. It is used to describe relationship also.
In this research, percentages are identified through analysis.
CHI – SQUARE TEST
The chi - square analysis is mainly used to test the interdependence of two factors. In other words the chi – square analysis performed to test the signification of one factor over the other. In this study the demographic factors like age, monthly income, and educational qualification. Each of the personal factors is compared with the study factors and chi – square test was performed.
The entire test carried out with 5% percentage level of significance.
VIII. DATA ANALYSIS AND
INTERPRETATION
Table 1 shows 72% of the respondents family decision maker is father, 14% of the respondents’ family decision maker is mother, 12% of the respondents family decision maker is children and 2% of the respondents family decision maker is others.
266
Copyright © 2011-15. Vandana Publications. All Rights Reserved.
Table 3 shows that maximum (53%) of therespondents are having awareness through advertisement, 3% of the respondents are having awareness through their friends and relatives, 17% of the respondents are having awareness through internet. 5% of the respondents are having awareness through newspaper and 4% of the respondents are having through exhibition.
Table 4 shows 62% of the respondents are changing their package and 38% of the respondents are not changing their package.
Table 5 shows maximum(32%) of the respondents are changing their package during IPL and World cup Match, 22% of the respondents are changing their package during Summer holidays and8% of the respondents are changing their package for other reasons.
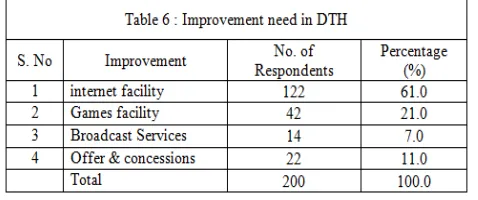
Table 6 shows maximum(61% ) of the respondent need internet facility with DTH, 21% of the respondents
said that Games facility as improvement, 11% of the respondents need more offers and concessions and 7% of the respondents said that Broadcast service as improvement.
Table 7 shows out of 200 respondents 52.7 percent of male and 53.3 percent of the female respondents have high level satisfaction. Further 47.3 percent of male and 46.7 percent of the female respondents have low satisfaction.
The calculated value of Chi-square (0.007) is less than the table value of Chi-square table value 9.488 tested at 5% level of significance. Hence the hypothesis is accepted. Thus it could be concluded that there is no significant association between the gender and the satisfaction level of sample respondents.
The table 8 shows 60 percent of the respondent under the age category of less than 25 years is highly satisfied. 36 percent of them are having low satisfaction. 50 percent of the sample respondent under the age group of 25-35 having high level satisfaction and 50% have low level satisfaction. 47.6 percent of the respondents are having high satisfaction under the age category of 36-45 and 47.6 percent of them having low satisfaction. 43 percent of the sample respondent under the age group of above 45 is having high satisfaction and 56.3 percent of them having low satisfaction.
267
Copyright © 2011-15. Vandana Publications. All Rights Reserved.
Table 9 shows 28.5 percent of Illiterate and 52percent of School level, 63 percent of graduate and 33 percent of professionals have high satisfaction. Further 71 percent of Illiterate, 48 percent of School level,37 percent of Graduate, 58 percent of Postgraduate and 64 percent of Professionals have low satisfaction.
The calculated value of Chi-square (9.587) more than the table value of 9.488 for 4 degree of freedom at 5% level of significance. Hence the hypothesis is rejected, thus it could be concluded that there is a significant association between the Occupation of the respondent and their level of satisfaction.
Table 10 shows, Signal problem in rainy season gets highest score, so it is ranked as First. Technical Problems in Setup box is assigned Second and User Cannot Change the service provider is ranked Third. Unaware about the policies regarding recharges and customer service from DTH take long time assigned the least rank i.e. Fourth and Fifth.
Hence, it is concluded that Signal problem in Rainy Season followed by Technical problems in Setup Box, user cannot change the service provider are the common problems faced by DTH users.
IX.
SUGGESTIONS
From the finding of the study, the following suggestions are made which will help the DTH service providers to make their business lucrative and favorable to the customer.
It is found that maximum (53%) of the respondents are having awareness through advertisement. Hence it is suggested that sill more effective steps should be taken by
the DTH service providers to spread the message through Advertisement.
From the analysis it is found 62% of the respondents are changing their package at the time of IPL and World cup matches and in summary holidays. Hence it is suggested that to retain these customers some sports and channels for children should be provided in all the days.
It is found that the factor which is mostly considered at the time of purchasing is Picture quality. Hence it is suggested that more importance must be given in providing picture quality to their brand.
It is found that the factor price is given second importance while purchasing the DTH. Hence it is suggested that if the price is high, few buyers purchase and if the price is low, many buyers will purchase. The service providers should offer different combinations of package with low price.
It was found that DTH service users are facing main problem as signal problem in rainy season with the mean score (2.15). Hence it is suggested that the service providers should improve their signal in the rainy season to retain the customers.
It is found that those who spent above Rs.600 have maximum (71.4) percent of low satisfaction. Hence it is suggested that the service providers should offer different package in such a way as to satisfy those customers.
It is found that illiterate users are having maximum (71) percent of low satisfaction. Hence it is suggested that advertisements are in easily understandable manner and service providers should make it easy to use set top and recharging their DTH to retain those customers and attract new customers.
X.
SCOPE FOR FURTHER RESEARCH
The present study is confined only to Gobichettipalayam town, Erode District. Hence, it is suggested to the further researchers that they may conduct the research by extending the area of the study.
This study is conducted to know the factors considered by the customers at the time of purchasing DTH and satisfaction level of DTH users for all brands. Hence it is suggested that the further researcher may conduct the study on particular brand.
The present study covered the satisfaction level of all brands. Hence it is suggested that the further researcher may conduct comparative study on the performance of various DTH brand.
XI.
CONCLUSION