IJPAR |Vol.5 | Issue 1 | Jan- Mar -2016
Journal Home page: www.ijpar.com
Research article Open Access
Development and validation of RP- HPLC method for the estimation of
dabigatran etexilate mesylate (DEM) in bulk form
N.Madhavi Latha, P.Supriya, G.V.Ramana, K.B.V.Rohith, G.Chaitanya, A.K.M Pawar*
Department of Pharmaceutical Analysis & Quality Assurance, A. U College of Pharmaceutical
Sciences, Andhra University, Visakhapatnam, Andhra Pradesh, India. 530 003
*Corresponding Author: A.K.M Pawar.
Email ID: [email protected]
ABSTRACT
The RP- HPLC method was developed and validated for the determination of Dabigatran Etexilate Mesylate (DEM) in bulk form. The chromatography was carried out on Unisol C18 (4.6 × 150 mm, 3μm) using a mobile phase of methanol and ammonium acetate buffer in the ratio of 90:10, at a flow rate of 1 ml/minute. The analytes were monitored at 226 nm using a PDA detector. The retention time of the DEM was 2.52 min. The method was linear in the concentration range of 20-100 µg/ml with a correlation coefficient of 0.999. The method was validated as per ICH guidelines.
Keywords:
HPLC, Method Validation, Dabigatran Etexilate Mesylate, ICH guidelines.INTRODUCTION
[1,2]DEM is chemically β-Alanine, N-[[2-[[[4-[[[(hexyloxy) carbonyl] amino] phenyl] amino] methyl]-1-methyl-1H-benzimidazol-5-yl]carbonyl]-N-pyridinyl-,ethyl ester,methanesulfonate. DEM is an orally available mesylate salt form of the etexilate prodrug of dabigatran and a direct thrombin inhibitor with anticoagulant activity. Thrombin, a serine protease, is responsible for the conversion of fibrinogen to fibrin in the coagulation cascade. Inhibition of thrombin consequently prevents thrombus development. Dabigatran inhibits free thrombin, fibrin-bound
thrombin and thrombin-induced platelet aggregation, which results in a prolongation of a PTT (partial thrombo plastin time), ECT (Ecarin clotting time), and TT (thrombin time). It is used in embolism associated with atrial fibrillation, cardioversion of atrial fibrillation/flutter, thromboprophylaxis in orthopaedic surgery, cerebral embolism, and treatment of acute venous thromboembolism. DEM is available in the form of Capsules with the Brand name of PRADAXA (Marketed by Boehringer Ingelheim, India) with strengths 75 & 150 mg.
Fig. 1: Structure of DEM [3]
The literature survey reveals that various analytical methods like Spectrophotometric and HPLC were reported for the determination of DEM in formulations, but there were no reported HPLC methods in bulk form. Moreover, the available HPLC methods for the determination of dabigatran in formulations were time consuming for elution and uneconomical. Hence an attempt was made to develop, a simple, precise, accurate, robust, and economical RP-HPLC method for the estimation of DEM in bulk.
MATERIALS AND METHODS
Instrumentation
HPLC Agilent 1260 Infinity - PDA detector with auto sampler, Unisol C18 (4.6 ×150mm, 3μm particle size) equipped with Open lab EZ Chrome software, Mettler Toledo ME 204 balance, Eutech pH 700 pH meter.
Chemicals and solvents
DEM was obtained as a gift sample from MSN Laboratories, Hyderabad, India and was used without further purification. All chemicals and reagents used were of HPLC grade. HPLC grade methanol, ammonium acetate and water were procured from Merck Pharmaceuticals Private Ltd., Mumbai, India. Glacial acetic acid was purchased from Qualikems, Vadodara, India.
Preparation of standard stock solution
DEM is accurately weighed (100mg) and dissolved in 100ml of HPLC grade methanol to get 1000 µg/ml stock solution. Working standard solutions were further diluted with diluent (Methanol : Acetate buffer 60:40 v/v) to get concentrations of 20-100µg/ml. Each of these drug solutions (10µl) were injected into the column, the peak area and retention times were recorded.
METHOD DEVELOPMENT
Chromatographic conditions
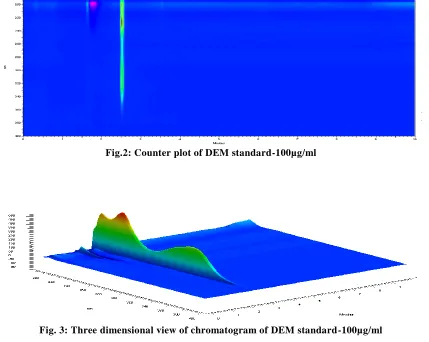
Fig.2: Counter plot of DEM standard-100µg/ml
Fig. 3: Three dimensional view of chromatogram of DEM standard-100µg/ml
Table 1: Results for regression analysis of DEM
Method validation
[4-11]The proposed method was validated for following parameters according to ICH guidelines: System suitability, Linearity, Accuracy, Specificity, Precision, Limit of Detection (LOD) and Limit of Quantitation (LOQ), Robustnes.
System suitability test
100 μL of the standard solution was injected under optimized chromatographic conditions to evaluate the suitability of the system. The system suitability test parameters were noted.
Table 2: System suitability, results for DEM Parameters Obtained value Acceptance criteria
Tailing Factor 1.07 NMT 2
Theoretical plates 8716 NMT 2000
%RSD of 6 injections 0.09 NMT 2%
S. NO Parameters Results
1 Regression equation (Y) y=20, 86,083x+ 13,21,131+ 06 2 Correlation coefficient (R) 0.999
3 Slope (m) 2086083
4 Y – intercept (c) 1321131
5 Range 20 – 100µg/mL
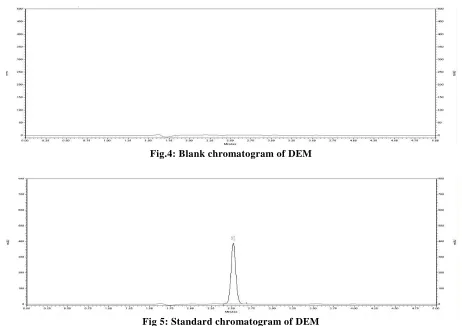
Specificity
Chromatograms of standard and blank were recorded and chromatogram of blank did not show
any peak at the retention time of analyte. This shows that the method is specific.
Fig.4: Blank chromatogram of DEM
Fig 5: Standard chromatogram of DEM
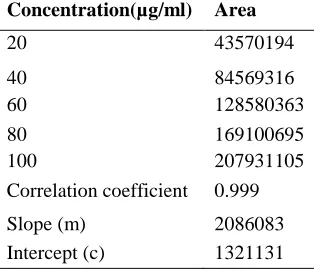
Linearity
The calibration curve was obtained with five concentrations of the standard solution (20–100 μg/ml for HPLC method and 2–10 μg/ml for UV
method). The linearity was evaluated by linear regression analysis, which was calculated by the least square regression method.
Fig. 6: Calibration curve of DEM
y = 2086083x + 1321131+06 R² = 0.999
0 20 40 60 80 100 120
P
eak
A
re
a
Table 3: Linearity results for DEM Concentration(µg/ml) Area
20 43570194
40 84569316
60 128580363
80 169100695
100 207931105
Correlation coefficient 0.999
Slope (m) 2086083
Intercept (c) 1321131
Accuracy
The accuracy of the method was evaluated by recovery study of DEM at three concentration levels (50%, 100% and 150 %). A study was carried out in triplicate at 2,4 and 6 μg/ml in UV
and 20,40 and 60µg/ml in HPLC. A fixed amount of pre-analysed sample and standard drug was added and recovery was studied for the quantification of the DEM. The percentage recovery and mean % recovery were calculated.
Table 4: Accuracy results for DEM S.NO %
Level Standard amount Spiked amount Amount found % Recovery Mean %Recovery
1. 50 %
40 20 59.81 99.68 Mean=99.26
SD = 0.5006 %RSD=0.50
40 20 59.65 99.41
40 20 59.23 98.71
2. 100 %
40 40 78.97 98.71 Mean =99. 20
SD = 0.436 %RSD=0. 44
40 40 79.51 99.38
40 40 79.63 99.53
3. 150 %
40 60 99.13 99.13 Mean =99. 03
SD =0. 087 %RSD=0. 09
40 60 98.96 98.96
40 60 99.01 99.01
Precision
The precision was determined for DEM in terms of intraday and interday. For Intraday precision evaluation, standard solution (100µg/ml for HPLC and 6 µg/ml of UV) was prepared from stock solution and injected into the system six times (n=6) at two different times in a day. The interday
precision was studied by injecting the same concentration of standard solutions into the system six times on consecutive days. The standard deviation and the relative standard deviation were reported for precision. RSD for peak areas should be NMT 2%, which indicate the precision of the developed methods.
Table 5: Intraday and Interday precision results for DEM S. No Intraday peak area Interday peak area
1 212262708 212262509
2 212438592 212438523
3 212047244 212046131
4 212008206 212007991
5 211999883 211999853
6 211926882 209925998
L
imit of detection and limit of quantitation
The limit of detection and the limit of quantitation of the developed method was studied by injecting progressively low concentrations of the standard solution using the developed HPLC method. The LOD& LOQ values were found as 1.5 and 2.5 μg/ml, which indicates the sensitivity of the method.Robustness
Robustness of the method were determined by altering slight changes in the chromatographic conditions like change in flow rate, buffer pH and mobile phase composition in HPLC and detection wavelength. It was observed that there were no marked changes in chromatograms and spectrum obtained, which demonstrated that the developed HPLC and UV methods were robust.
Table 6: Results of Robustness for DEM Parameter Conditions %RSD
(NMT 2.0)
Tailing factor (NMT 2.0)
Theoretical plates (NLT 2000) Flow Rate 0.8
1.0 1.2 0.01 0.08 0.06 1.03 0.99 1.07 9981 9147 9291
Buffer pH 4.5 5.0 5.5 0.02 0.07 0.01 1.2 0.9 1.0 9120 9244 9132 Mobile phase composition 75:25 85:15 90:10 0.02 0.01 0.44 0.9 1.07 1.02 9513 9712 9314
RESULTS AND DISCUSSION
A reverse phase liquid chromatographic method was developed and validated for the determination of DEM in bulk with UV detection at 226 nm by using Unisol C18 column with mobile phase composition methanol and ammonium acetate buffer (adjusted to pH 5.0 with glacial acetic acid) in the ratio of 90:10. The UV absorption counter plot and three dimensional view of chromatogram were shown in Fig 2 and 3. The system suitability, results were shown in table no.2. The specificity of the analytical method was established by injecting the 10µl solutions of diluent, standard individually to investigate interference from the representative chromatograms in Fig 4 and 5. The method was linear in the range of 20-100 μg/ml. The linearity results were shown in table no.3. The calibration curve was shown in Fig 6. The results of recovery studies were shown in table 4. The % RSD for intraday and interday precision were found as 0.09 and 0.44, which indicates the method is precise. The results of precision studies were shown in table 5. The LOD& LOQ values were found as 1.5 and
2.5 μg/ml, which indicates the sensitivity of the method. The robustness results were shown in table no.6.
CONCLUSION
The developed RP-HPLC method was simple, rapid, accurate, precise and sensitive for the quantification of DEM and is LC-MS compatible which can be efficiently used for further LC-MS analysis. The method rely on the use of simple working procedure, and hence this method can be routinely employed in quality control for analysis of DEM from bulk drug.
ACKNOWLEDGEMENT
REFERENCES
[1]. Rupesh A. Bagwe M. Development and validation of stability-indicating RP-hplc method for estimation of dabigatran etexilate. Journal of Advanced Scientific Research. 2014;5(3):39 -44.
[2]. http://pubchem.ncbi.nlm.nih.gov/compound/11434065 [3]. https://en.wikipedia.org/wiki/Dabigatran.
[4]. Validation of Analytical procedure, Text and methodology. International conference on Harmonization ICH Q2 (R1); 2005.
[5]. Nash R.A. Pharmaceutical process validation. 3rd Ed.
[6]. Guru deep R. Chatwal. Instrumental Methods of Chemical Analysis. 2.566 -2.699. [7]. Lloyd R. Snyder Practical HPLC Method Development. 2nd Ed.
[8]. Willard HH, Lynne L. Instrumental method of analysis. 7th ed. 1986, 580 -610.
[9]. Mallesh M. Geetharam. Validated stability-indicating liquid chromatographic method for the determination of Dabigatran Etexilate (thrombin inhibitor) in capsules. Indo American Journal of Pharmaceutical Research. 2014; 4: 2141-2150.
[10].Andreas S.L Mendezz, Martin steppe. Validation of HPLC and UV spectrophotometric methods for the determination of Meropenem in pharmaceutical dosage form. Journal of pharmaceutical and biomedical analysis. 2003; 33:947-954.
![Fig. 1: Structure of DEM [3]](https://thumb-us.123doks.com/thumbv2/123dok_us/8870074.1813368/2.612.164.461.74.208/fig-structure-of-dem.webp)