http://ijessr.com Page 57
International Journal of Education and Social Science Research
ISSN 2581-5148
Vol. 1, No. 04; 2018
EVALUATE CONSTRUCT INVARIANCE USING LR AND DFIT METHODS: AN APPLICATION TO PISA 2006
Yi Lu
Psychometrician/Research Scientist at the American Institutes for Research, America
ABSTRACT
Construct equivalence is one of the critical concepts in cross-cultural/lingual study. A construct is a theoretical representation of the underlying trait, concept, attribute, process, and/or structure that the test is designed to measure (Messick, 1989). Loosely speaking, construct equivalence implies that persons with the same underlying attribute/construct have the same expected true score at the item level, the subscale total score level, or both (Raju, Laffitte, & Byrne, 2002; van de Vijier&Tanzer, 1997). Without the establishment of construct equivalence, it is difficult to meaningfully interpret observed score difference across groups. Using Program for International Student Assessment (PISA) 2006, this paper evaluates construct equivalence in terms of measurement invariance in the framework of item response theory (IRT).
KEYWORDS: Construct invariance, cross-cultural/lingual study, differential item functioning (DIF), Item response theory (IRT), PISA 2006
INTRODUCTION
Program for International Student Assessment (PISA) is an internationally standardized test triennially undertaken by random samples of 15-year-olds students in science, reading, and mathematics. In each administration, one of the three subject areas, on a rotating basis, is chosen as the focus. As the product of collaboration between participating countries and the Organization for Economic Co-operation and Development (OECD), PISA ushered in a new era in international comparative studies because it is the first international survey that is not assess the extent to which students have mastered curriculum based subjects, rather it compares whether 15-year-olds possess the basic knowledge required for their further development and their personal success in anadvanced social environment and at the workplace (PISA 2006 Technical Reports). Therefore, it has significant impact on education policy in participating countries and beyond.
http://ijessr.com Page 58 French, and then translated into target population. Because a series of official reports based on PISA has significant impact on education policy in the participating countries, the issue of measurement invariance must be established before further investigating the comparability and validity of the cross-lingually translated/adapted measures.
To increase test validity, a good deal of research has been focused on measurement invariance. In the framework of item response theory (IRT), measurement invariance refers to the stability of parameters of the item across different cultural populations. When invariance does not hold for item parameters, the item is said to be functioning differentially. At the test level, a test functions differentially if the expected test scores differ for different cultural populations with the same theta. Differential functioning of item (DIF) present a potential threat to the validity of the instrument and may significantly interfere with efforts to equate tests (Kim & Cohen, 1998). The detection of measurement invariance has been based on different definition of DIF, that is, DIF occurs whenever the probabilities of scoring in any one of the score categories conditional on ability varies across groups, or DIF occurs when the expected item scores conditional on ability differs across groups (Bolt, 2002). The existing procedures for detecting differential functioning are defined mostly at the item level (please refer the comprehensive review of Millsap & Everson, 1993), though there are studies focus on test level (e.g., Camilli & Penfield, 1997; Shealy & Stout, 1993). Raju, van der Linden, and Fleer (1995) proposed an IRT-based measure of differential functioning of item and test (DFIT), in which both differential item functioning (DIF) and differential test functioning (DTF) can be assessed. Subsequent research extended the DFIT framework to the polytomous and multidimensional case (Flower, Oshima,&Raju, 1999; Oshima, Raju, & Flowers, 1997).
To achieve measurement invariance, detecting and eliminating DIF items from tests became a goal (Thissen, 2001). Test developers assume that the extent to which individual items are DIF free indicates test level measurement invariance (Penfield & Lam, 2000). However, items are bidirectional, that is, one item displays DIF in favor of reference group and another item display DIF in favor of the focal group, therefore, it is not necessary to eliminate all significant DIF if the combination effect of DIF items will have a cancelling effect on the overall test level. Considering item development is expensive, in this study, it would be a worthwhile investigation to compare DIF detection at item and test level, respectively, then decide which item should be eliminated.
http://ijessr.com Page 59 the item level, and applied DFIT to detect both DIF and DTF.
Material and Methods
In PISA 2006 student science survey, among various questions that ask students’ general and personal value of science, as well as their interest and value of science, plus their self-concept of their own abilities in science and whether they are motivated to use science in the future, the value subset of items was chosen for this project. The science value subscale includes 10 items, and each item is scored on a four-point response scale (1= strongly agree, 2=agree, 3=disagree, 4=strongly disagree). Please refer Appendix A for the description of those items. For convenience of analysis, a sample of 1,000 each from U.S. and Japan, respectively, was randomly drawn from the released public use PISA 2006 student science questionnaire dataset. In this study, U.S. sample served as the reference group, and Japan sample was the focal group.
the Graded response model
For the polytomously scored items, Samejima (1969) defined the conditional probabilities of a randomly chosen respondent with a latent trait selecting category k (k=1, …,m) in item i as,
P ik (Ɵ) = P*i(k -1)(Ɵ) - P*ik (Ɵ)(1)
Where P*i( k-1)is the probability of a response in category k - 1 and higher, and P*ik is the probabilitythat the response is in category k or higher. These functions are written as,
P*ik(Ɵ) =1 (2) 1+ exp|-α i (Ɵ – b ik)|
By definition, the probability of responding above threshold k = 0 is 1.0 and the probability of responding above the threshold k = m is 0.
GRM-LR
When implemented using the GRM, the Likelihood Ratio test (LR: Thissen, Steinberg, & Gerard, 1986) detects DIF through evaluating the differences in GRM item parameters. LR test starts with the compact model in which the GRM parameters for all test items (including the studied items) are constrained to be equal for the reference and focal groups, and proceed to the augmented model in which the parameters of the studied item are allowed to differ across groups (Bolt, 2002; Bolt, Hare, Vitale, & Newman, 2004). A separate G2 statistics can be computed for each model. Once the difference of the G2 between the compact and augmented model exceeds a critical χ2 at the prespecified level of α , the null hypothesis that all parameters of the studied item are equal for the reference and focal groups is rejected. The software to implement GRM- LR test is IRTLRDIFv2.0b (Thissen, 2001).
GRM-DFIT
http://ijessr.com Page 60
i
ESi =∑𝑚𝑖=1𝑃ik (Ɵ) Xik(3)
Where Xik is the score or weight for category k, m is the number of categories, and Pik is the probability of responding to category k (as defined equation 1). Summing the expected item scores across a survey instrument will result in the expected test score function
T= ∑𝑛 𝐸𝑆
𝑖=1 i(4)
Where n is the number of items in the instrument.
The DFIT starts with two sets of item parameter estimates, one for the reference group and another for the focal group (Raju et al., 1995). The reference group item parameters are then linked onto the same metric as the focal group parameters using a linear transformation. As result, a test will have two sets of item parameters. The focal group Ɵ distribution is used to calculate two ESis (as defined in equation 3). An item is considered to be functioning differentially if
ESiRESiF(5)
Where ESiRis the item expected score for an respondent in the reference group (R) with a givenƟand andESiFis the item expected score for an examinee in the focal group (F) with the same Ɵfor item i. A test functions differentially if
TR TF(6)
Where TR and TFare the expected test scores for the reference and focal group, respectively, with the same Ɵ . An overall measure of DTF across examinees may be defined as
DTF EF(TRTF )2(7)
Alternatively, to reflect the additive nature of DTF, Raju et al. (1995) defined two indices, compensatory DIF (CDIF) and non compensatory DIF (NCDIF),
CDIFicov(di, D) d D(8)
NCDIF = σ2 +2(9)
i di di
Where diESiFESiRand DTF TR
CDIF reflects the additive nature of DTF, that is
http://ijessr.com Page 61
i-1
Parameter estimation and linking
Item and theta parameters were estimated using PASCALE (Muraki & Bock, 2003). The maximummarginal likelihood procedure and EM algorithm were used to estimate the item parameters. Estimate of theta used the program’s default Bayesian procedure with normal priors. Default values were used for all estimation. Since PARSCALE does not provide the covariance information, a Fortran program (Polycov; Morris 2007) was used to calculate the item variance and covariancesfrom PARSCALE output and to create the input data file for DFIT program (DFIT8; Oshima, Kushubar, Scott, &Raju, 2009).
Linking coefficients was obtained by using IRTEQ (Han, 2007). Several researchers recommended iterative linking (Flowers, Oshima, &Raju, 1999; Oshima, Raju, Flowers, &Slinde, 1998; Raju, van der Linden, & Fleer, 1995) to improve identification of DIF items. To minimize error introduced by the equating procedure, a two-stage linking procedure was used in this study. After the initial linking with all the 10 items, a DIF analysis was performed in the DFIT program.
If items were identified as display DIF, which indicated by large CDIF index, the linking procedure was performed again without these DIF items. Finally, run DFIT for all items again using the revised linking coefficients. Note that, in accordance with the definition of DTF, the item parameters from the reference group were put on the scale of the item parameters from the focal group in this study.
Results
GRM-LR analysis
In the current study, a separate DIF analysis was conducted for the selected samples, with U.S. sample as reference group and Japan sample as focal group. For each DIF analysis, an iterative purification procedure was first used to identify anchor items. The remaining items are then tested for DIF against this anchor. Items are iteratively added to or subtracted from the anchor on the basis of whether they display DIF. The process terminates when all items on the anchor fail to display DIF and no additional items can be added without introducing DIF.
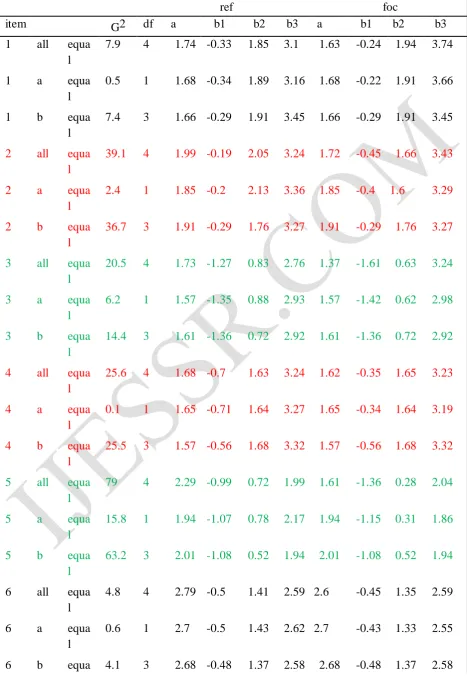
Table 1 reports estimates for the GRM-LR analysis. The results indicate that the majority of the items are DIF items, i.e., item 2, 3, 4, 5, 7, 9, 10 are all DIF items. Note that among the DIF items, item 3, 5, 7, and 10 item exhibit both “a-DIF” and “b-DIF” (non uniform DIF) while item 2, 4, and 9 exhibit “b-DIF” (uniform DIF).
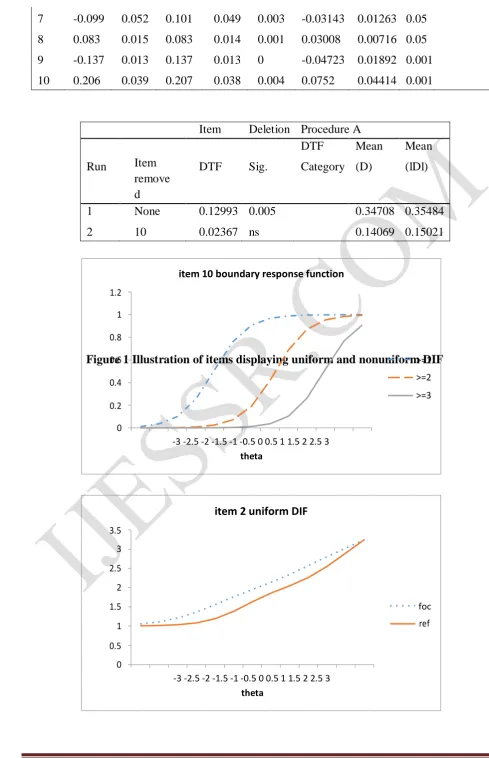
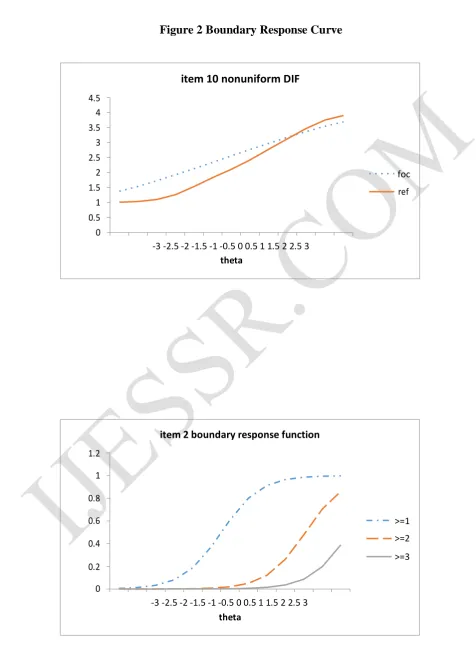
Figure 1 provides an illustration of uniform DIF and non uniform DIF. In Figure 1, Item 2 results in higher expected scores for the focal group across all levels of the latent trait, implying uniform DIF. Item 10 results in higher expected scores for the focal group than the reference group at low levels of the latent trait but produces lower expected scores for the focal group at higher levels of the latent trait, so this is a non uniform DIF. Figure 2 illustrates boundary response curve (BRC) for item 2
(aˆ11.906,bˆ10.231,bˆ22.024,bˆ33.237) and item 10(aˆ12.232,bˆ11.020,bˆ20.648,bˆ31.968)
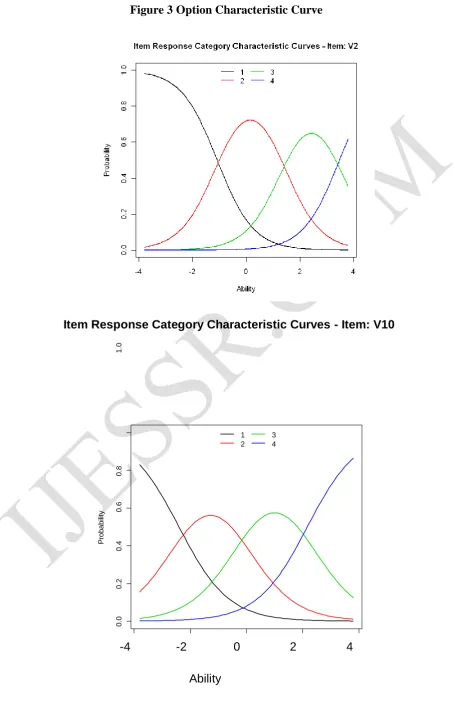
http://ijessr.com Page 62 respectively. The corresponding optioncharacteristic curves, indicating the probability of scoring in each category, are shown in Figure 3. Each curve represents the probability of a respondent selecting category k, given his/her latent trait on the underlying construct. Take item 2 for example, (<Broad science> is important for help us to understand the natural world), if a person’s estimated theta is less than -1.00, then this respondent is more likely to strongly agree with this item; likewise, if a person’s estimated theta is between -1.00 and 1.80, then this respondent is more likely to agree with this item, if the estimate theta is between 1.8 and 3.8, this respondent is more likely to disagree with this item. A person with estimated theta above 3.8 will have the greatest likelihood of strongly disagree with this item. Compared with item 2, item 10 has lower b1, b2, and b3 estimates, so respondents who have lower science value trait achieve higherscores on this item.
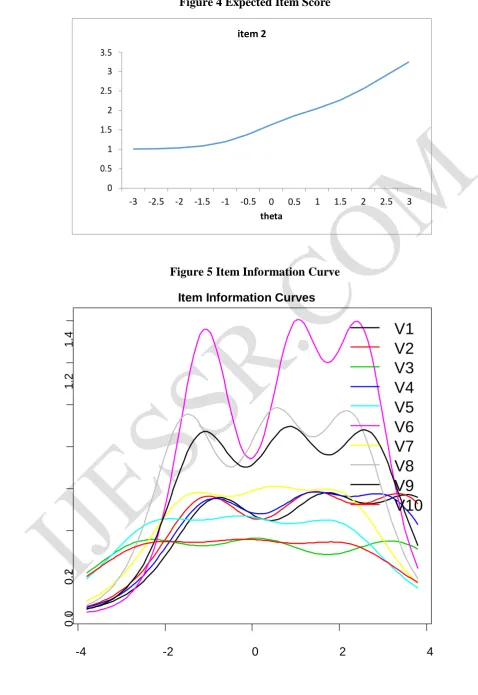
Figure 4 presents the item information curve (IIC). Comparing the two graphs in Figure 4, it also indicates that respondents with lower science value trait have higher expected response scores on item 10. Figure 5 presents the item information curve (IIC). IIC indicate which items are most useful for measuring different levels of the measured construct. Item difficulty parameter determines the location of IIC, and item discrimination parameter is a function of the height of the IIC. Figure 5 shows that item 6 (<Broad science> is valuable to society), on the theta level from -1.00 to 3.00, provides most information.
DFIT analysis
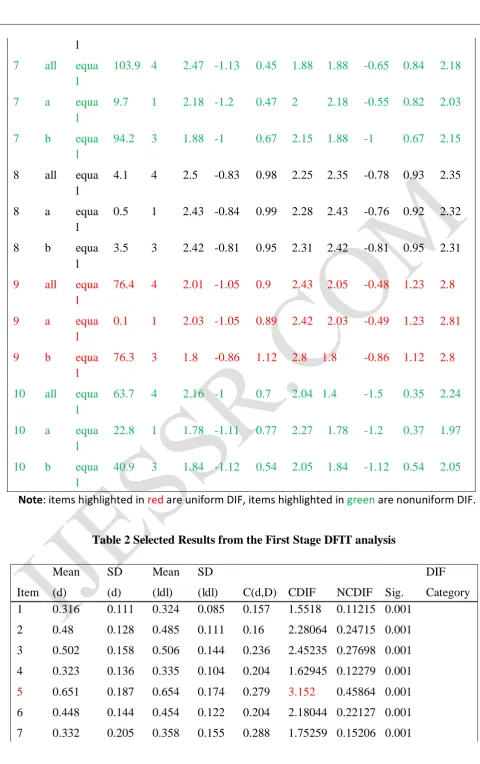
GRM-LR analysis identified 7 out of 10 items as DIF items. One extreme option regarding the DIF items is to eliminate them from the test. If the DIF items is only a small proportion of a large number of items in the test, this could be one of the options. On the other hand, if majority items flagged as DIF, such as GRM-LR result in the current study, eliminating all the DIF items would have detrimental effect on the underlying construct that is interested to measure. Rather than revising or eliminating all of the DIF items as recommended in many research, the 10 value items were reassessed in the DFIT framework to investigate the overall effect of eliminating an item from the test.
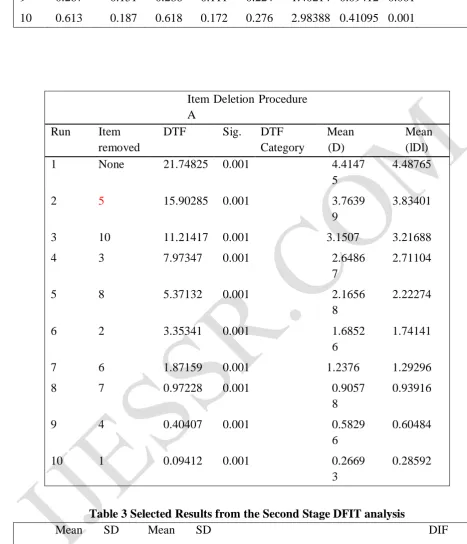
http://ijessr.com Page 63 part of Table 3 also show that the DTF is not significant any more with the remaining 9 items.
DISCUSSION
Scientific and technological advances are important influences on nearly everyone’s life. Issues of motivation and attitudes are particular relevant in science, through which we could get some implications in cognitive performance on science. However, the purpose of this article was not to evaluate the PISA 2006 student science value subscale, but rather to compare the DIF results in GRM-LR and GRM-DFIT, respectively, therefore, I refrain from any speculating as to potential causes of DIF on this particular instrument. While 70% of the science value items were identified as DIF items in the GRM-LR analysis, it does not necessary mean all the DIF items would have to be eliminated to achieve measurement invariance across different ethnic groups. The analysis in DFIT framework provided us an alternative method treating DIF items since the DTF procedure allows us to examine the overall effect of eliminating an item from the test. For practical applications, a test developer could examine the DTF, then determine which item(s) should be eliminated based on it CDIF value and its overall contribution to DTF.
This study only investigated the unidimensional polytomous case, to obtain a more comprehensive perspective on the student attitudes towards science, future research will include all the seven subscales of science instrument. Once in the multidimensional situation, some item could be flagged as DIF due to multidimensionality (Bolt & Johnson, 2009). Though multidimensional model could give us more precise theta estimation with fewer items by taking into account the correlations among the subscales, DIF analyses could become complicated in multidimensional models due to the rotation problems. Alternatively, future research could also investigate the effect of response style, such as extremely response style, acquiescent, and disacquiescent response style, on the detection of DIF/DTF (e.g., Bolt & Newton, 2011; Lu & Bolt, 2015).
REFRENCES
Bock, R. D. (1972).Estimating item parameters and latent ability when the responses are scored in two or more nominal categories.Psychometrika, 37, 29-51.
Bolt, D. M. (2002).A Monte Carlo comparison of parametric and nonparametric polytomous DIF detection methods.Applied Measurement in Education, 15, 113-141.
Bolt, D. M., Hare, R. D.,Vitale, J. E., & Newman, J. P. (2004). A multigroup item response theory analysis of the psychopathy checklist-revised. Psychological Assessment, 2, 155-168.
Bolt, D. M., & Johnson, T. R. (2009). Addressing score bias and differential item functioning due to individual differences in response style. Applied Psychological Measurement, 33,335-352.
Bolt, D. M., & Newton, J. (2011).Multiscale measurement of extreme response style. Educational and Psychological Measurement, 71, 814-833.
Camilli, G., & Penfield, D. A. (1997). Variance estimation for differential test functioning based on Mantel-Haenszel statistics. Journal of Educational Measurement, 34, 123-139.
http://ijessr.com Page 64 Flowers, C. P., Oshima, T. C., &Raju, N. S. (1999).A description and demonstration of the polytomous-DFIT framework.Applied Psychological Measurement, 23 309-326.
Han, K. T. (2007). IRTEQ: Windows application that implements IRT scaling and equating [computer program]. Amherst, MA: University of Massachusetts Amherst, Center for Educational Assessment. Available for download at http://www.umass.edu/remp/software/irteq/
Kim, S-H., & Cohen, A. S. (1998).Detection of differential item functioning under the graded response model with the likelihood ratio test.Applied Psychological Measurement, 22, 345-355.
Lu.Y., & Bolt, D. M. (2015).Examining the attitude-achievement paradox in PISA using a multilevel multidimensional IRT model for extreme response style. Large-scale Assessment in Education, 3(2), 1-18. Examining the attitude-achievement paradox in PISA using a multilevel multidimensional IRT model for extreme response style
Masters, G. N. (1982). A Rasch model for partial credit scoring.Psychometrika, 47, 149- 174.
Morris, B. S. (2008). Polycov [computer program]. Chicago: Illinois Institute of Technology.
Available for download at http://mypages.iit.edu/~morriss/polycov/polycov.html.
Muraki, E., & Bock, R.D. (2003). PARSCALE4: IRT item analysis and test scoring for rating- scale data. Scientific Software: Chicago, IL.
Oshima, T. C., Kushubar, S., Scott, J. C., &Raju, N. S. (2009). DFIT8 for window user’s manual: Differential functioning of items and tests. St. Paul MN: Assessment Systems Corporation.
Oshima, T. C., Raju, N. S., & Flowers, C. P. (1997).Development and demonstration of multidimensional IRT-based internal measures of differential functioning of items and tests. Journal of Educational Measurement, 34, 253-272.
Oshima, T. C., Raju, N. S., Flowers, C. P., &Slinde, J. A. (1998).Differential bundle functioning using the DFIT framework: Procedures for identifying possible sources of differential functioning. Applied Measurement in Education, 11, 353-369.
Penfield, R. D., & Lam, T. C. M. (2000).Assessing differential item functioning in performance assessment: Review and recommendations. Educational Measurement: Issues and Practice, 19, 5-15.
PISA 2006 Technical Report. Retrieved from OECD website:
http://www.oecd.org/document/41/0,3343,en_32252351_32236191_42025897_1_1_1_1, 00.html
Raju, N. S., van de Linden, W. J., & Fleer, P. F. (1995).IRT-based internal measure of differential functioning of items and tests.Applied Psychological Measurement, 19, 353-368.
Samejima, F. (1969). Estimation of latent ability using a response pattern of graded scores. Psychometrika Monograph, 17, 1-100.
Shealy, R. T., & Stout, W. F. (1993). A model-based standardization approach that separates true bias/DIF from group ability differences and detects test bias/DTF as well as item bias/DIF. Psycholometrika, 54, 159-194.
Thissen, D. (2001). IRTLTDIFv2.0b: Software for the computation of the statistics involved in item response theory likelihood-ration tests for differential item functioning. L.L. Thurstone Psychometric Laboratory, University of North Carolina at Chapel Hill.
Thissen, D., & Steinberg, L. (1984). A response model for multiple choice items.
Psychometrika, 11, 1-13.
http://ijessr.com Page 65 item bias. Psychological Bulletin, 99, 118-1
Table 1 GRM-LR analysis
ref foc
item G2 df a b1 b2 b3 a b1 b2 b3
1 all equa l
7.9 4 1.74 -0.33 1.85 3.1 1.63 -0.24 1.94 3.74
1 a equa
l
0.5 1 1.68 -0.34 1.89 3.16 1.68 -0.22 1.91 3.66
1 b equa
l
7.4 3 1.66 -0.29 1.91 3.45 1.66 -0.29 1.91 3.45
2 all equa
l
39.1 4 1.99 -0.19 2.05 3.24 1.72 -0.45 1.66 3.43
2 a equa
l
2.4 1 1.85 -0.2 2.13 3.36 1.85 -0.4 1.6 3.29
2 b equa
l
36.7 3 1.91 -0.29 1.76 3.27 1.91 -0.29 1.76 3.27
3 all equa
l
20.5 4 1.73 -1.27 0.83 2.76 1.37 -1.61 0.63 3.24
3 a equa
l
6.2 1 1.57 -1.35 0.88 2.93 1.57 -1.42 0.62 2.98
3 b equa
l
14.4 3 1.61 -1.36 0.72 2.92 1.61 -1.36 0.72 2.92
4 all equa
l
25.6 4 1.68 -0.7 1.63 3.24 1.62 -0.35 1.65 3.23
4 a equa
l
0.1 1 1.65 -0.71 1.64 3.27 1.65 -0.34 1.64 3.19
4 b equa
l
25.5 3 1.57 -0.56 1.68 3.32 1.57 -0.56 1.68 3.32
5 all equa
l
79 4 2.29 -0.99 0.72 1.99 1.61 -1.36 0.28 2.04
5 a equa
l
15.8 1 1.94 -1.07 0.78 2.17 1.94 -1.15 0.31 1.86
5 b equa
l
63.2 3 2.01 -1.08 0.52 1.94 2.01 -1.08 0.52 1.94
6 all equa l
4.8 4 2.79 -0.5 1.41 2.59 2.6 -0.45 1.35 2.59
6 a equa
l
0.6 1 2.7 -0.5 1.43 2.62 2.7 -0.43 1.33 2.55
http://ijessr.com Page 66 l
7 all equa
l
103.9 4 2.47 -1.13 0.45 1.88 1.88 -0.65 0.84 2.18
7 a equa
l
9.7 1 2.18 -1.2 0.47 2 2.18 -0.55 0.82 2.03
7 b equa
l
94.2 3 1.88 -1 0.67 2.15 1.88 -1 0.67 2.15
8 all equa l
4.1 4 2.5 -0.83 0.98 2.25 2.35 -0.78 0.93 2.35
8 a equa
l
0.5 1 2.43 -0.84 0.99 2.28 2.43 -0.76 0.92 2.32
8 b equa
l
3.5 3 2.42 -0.81 0.95 2.31 2.42 -0.81 0.95 2.31
9 all equa
l
76.4 4 2.01 -1.05 0.9 2.43 2.05 -0.48 1.23 2.8
9 a equa
l
0.1 1 2.03 -1.05 0.89 2.42 2.03 -0.49 1.23 2.81
9 b equa
l
76.3 3 1.8 -0.86 1.12 2.8 1.8 -0.86 1.12 2.8
10 all equa
l
63.7 4 2.16 -1 0.7 2.04 1.4 -1.5 0.35 2.24
10 a equa
l
22.8 1 1.78 -1.11 0.77 2.27 1.78 -1.2 0.37 1.97
10 b equa
l
40.9 3 1.84 -1.12 0.54 2.05 1.84 -1.12 0.54 2.05
Note: items highlighted in red are uniform DIF, items highlighted in green are nonuniform DIF.
Table 2 Selected Results from the First Stage DFIT analysis
Mean SD Mean SD DIF
Item (d) (d) (ldl) (ldl) C(d,D) CDIF NCDIF Sig. Category 1 0.316 0.111 0.324 0.085 0.157 1.5518 0.11215 0.001
2 0.48 0.128 0.485 0.111 0.16 2.28064 0.24715 0.001
3 0.502 0.158 0.506 0.144 0.236 2.45235 0.27698 0.001
4 0.323 0.136 0.335 0.104 0.204 1.62945 0.12279 0.001
5 0.651 0.187 0.654 0.174 0.279 3.152 0.45864 0.001
6 0.448 0.144 0.454 0.122 0.204 2.18044 0.22127 0.001
http://ijessr.com Page 67 8 0.483 0.154 0.489 0.135 0.231 2.36294 0.25695 0.001
9 0.267 0.151 0.286 0.111 0.224 1.40214 0.09412 0.001
10 0.613 0.187 0.618 0.172 0.276 2.98388 0.41095 0.001
Item Deletion Procedure A
Run Item removed
DTF Sig. DTF
Category
Mean (D)
Mean (lDl)
1 None 21.74825 0.001 4.4147
5
4.48765
2 5 15.90285 0.001 3.7639
9
3.83401
3 10 11.21417 0.001 3.1507 3.21688
4 3 7.97347 0.001 2.6486
7
2.71104
5 8 5.37132 0.001 2.1656
8
2.22274
6 2 3.35341 0.001 1.6852
6
1.74141
7 6 1.87159 0.001 1.2376 1.29296
8 7 0.97228 0.001 0.9057
8
0.93916
9 4 0.40407 0.001 0.5829
6
0.60484
10 1 0.09412 0.001 0.2669
3
0.28592
Table 3 Selected Results from the Second Stage DFIT analysis
Mean SD Mean SD DIF
Item (d) (d) (ldl) (ldl) C(d,D) CDIF NCDIF Sig. Category 1 -0.007 0.015 0.013 0.009 -0.001 -0.00308 0.00026 ns
2 0.164 0.028 0.164 0.028 0 0.0569 0.02777 0.001
3 0.091 0.014 0.091 0.014 0.001 0.03251 0.00839 0.05
4 -0.034 0.011 0.034 0.011 0.001 -0.01086 0.00126 ns
5
http://ijessr.com Page 68 7 -0.099 0.052 0.101 0.049 0.003 -0.03143 0.01263 0.05
8 0.083 0.015 0.083 0.014 0.001 0.03008 0.00716 0.05
9 -0.137 0.013 0.137 0.013 0 -0.04723 0.01892 0.001
10 0.206 0.039 0.207 0.038 0.004 0.0752 0.04414 0.001
Item Deletion Procedure A
DTF Mean Mean
Run Item remove d
DTF Sig. Category (D) (lDl)
1 None 0.12993 0.005 0.34708 0.35484
2 10 0.02367 ns 0.14069 0.15021
Figure 1 Illustration of items displaying uniform and nonuniform DIF
item 2 uniform DIF
3.5
3
2.5
2
1.5
1
foc
ref
0.5
0
-3 -2.5 -2 -1.5 -1 -0.5 0 0.5 1 1.5 2 2.5 3
theta
item 10 boundary response function
1.2
1
0.8
0.6
0.4
>=1
>=2
>=3 0.2
0
-3 -2.5 -2 -1.5 -1 -0.5 0 0.5 1 1.5 2 2.5 3
http://ijessr.com Page 69 Figure 2 Boundary Response Curve
item 10 nonuniform DIF
4.5 4 3.5 3 2.5 2 1.5 1 0.5 0
foc
ref
-3 -2.5 -2 -1.5 -1 -0.5 0 0.5 1 1.5 2 2.5 3
theta
item 2 boundary response function
1.2
1
0.8
0.6
0.4
>=1
>=2
>=3 0.2
0
-3 -2.5 -2 -1.5 -1 -0.5 0 0.5 1 1.5 2 2.5 3
http://ijessr.com Page 70 Figure 3 Option Characteristic Curve
Item Response Category Characteristic Curves - Item: V10
-4 -2 0 2 4
Ability
1 2
3 4
P
robab
ili
ty
0
.0
0
.2
0
.4
0
.6
0
.8
1
http://ijessr.com Page 71 Figure 4 Expected Item Score
Figure 5 Item Information Curve
Item Information Curves
-4 -2 0 2 4
0
.0
0
.2
item 2
3.5
3
2.5
2
1.5
1
0.5
0
-3 -2.5 -2 -1.5 -1 -0.5 0 0.5
theta
1 1.5 2 2.5 3
V1
V2
V3
V4
V5
V6
V7
V8
V9
V10
1
.2
1
http://ijessr.com Page 72
Ability
Appendix A
Questions on PISA survey instrument regarding Perceive Value of Science (all items score: 1=strongly agree; 2=agree;
3=disagree; 4=strongly disagree)
Item1: Advances in <broad science and technology> usually improve people’s living conditions. Item2: <Broad science> is important for helping us to understand the natural world.
Item3: some concepts in <broad science> help me see how to relate to other people. Item4: Advances in <broad science and technology> usually help improve the economy. Item5: I will use <broad science> in many ways when I am an adult.
Item6: <Broad science> is valuable to society. Item7: <Broad science> is very relevant to me.
Item8: I find that <Broad science> helps me to understand the things around me. Item9: Advances in <Broad science and technology> usually bring social benefits.
Item10: When I leave school there will be many opportunities for me to use <Broad science> .
item 10
4.5 4 3.5 3 2.5 2 1.5 1 0.5 0
-3 -2.5 -2 -1.5 -1 -0.5 0 0.5
theta