COMPUTER SCIENCE & TECHNOLOGY
www.computerscijournal.org
March 2013, Vol. 6, No. (1): Pgs. 83-92 An International Open Free Access, Peer Reviewed Research Journal
Published By: Oriental Scientific Publishing Co., India.
INTRODUCTION
A random number is a number generated by certain process, whose outcome is unpredictable. Random numbers are required to be independent, so that there is no correlation between successive numbers. Random numbers are subject to intensive investigation due to their application in simulation of random numbers, statistical sampling, cryptography, computer programming, numerical analysis, decision making and recreation1-2 .
All the sources of random numbers behave in the same way, and some are better than others for different applications. The tests are usually conducted by empirical tests and theoretical tests. Empirical tests are conducted on the sequence generated by a Random Number Generator (RNG), and require no knowledge of
Generation and Analysis of the
Random Numbers by GCC Compiler
SAKSHAM SRIVASTAVA
Department of Computer Engineering, Malaviya National Institute of Technology, Jaipur, India. (Received: February 14, 2013; Accepted: February 27, 2013)
ABSTRACT
The random numbers have been generated by the GCC compiler and tested for their randomness. The code used by the library function of GCC compiler to generate random numbers is also presented. Chi-square test, Runs test below and above median, and Reverse
arrangement test have been conducted to test the randomness. It has been shown that the Random numbers generated by GCC compiler have successfully passed these tests.
Key words: Random numbers, GCC compiler, Chi-square Test, rand() function, randomness.
how the RNG produces the sequence. Theoretical tests are better and require a knowledge of the structure of the RNG.
Computer-generated random numbers are referred as “pseudo random” numbers, on the other hand random numbers generated by physical processes are called “true random” numbers. Many algorithms have been developed to generate random numbers3-4 and also many tests to check
Among all the random number generators, the method used by the library function of GCC to generate random numbers is Linear Congruential generator.
Linear Congruential Method for generation of Random numbers
Linear congruential method1 was
originally proposed by Lehmer in 1948, but reported by Knuth in 1951. It generates the sequence of random numbers by the following formula:
Y i = (a * Yi-1 + c) % m
where Yi is the ith term of the sequence and m ≤ 0, 0 ≤ a < m, 0 ≤ c < m and 0 d” Y0 (seed) < m
For example if a=2, c=3, m =7, seed = 1, then the sequence generated by Linear Congruential generator is: 5,6,1,5,6,1...
Here, the sequence gets repeated after an interval called the period of the sequence. Therefore constants a, c, m should be chosen carefully for getting a good generator.
Random number generated by GCC compiler
The GCC compiler has an inbuilt library function rand() for generating random numbers based on the non-additive feedback5 . The GCC
compiler uses srand() function to initialise the random function by passing a seed as its argument. Mathematically, exact algorithm used by the rand() of GCC library to generate random numbers with a seed ‘s’ is given below.
The sequence with ith term denoted by Ri can be calculated as:
´ R0 = s
´ Ri = (16807 * (signed int) Ri-1) mod 2147483647 (for 1≤i≤30)
´ Ri = Ri-31 (for 31≤i≤33)
´ Ri = (Ri-3 + Ri-31) mod 4294967296 (for ie≤34)
where 2147483647 = 231 - 1 and
4294967296 = 232
The first 343 terms of this sequence are ignored, and the first term obtained by the rand()
function is equal to the 344th term of this sequence.
If the ith term obtained by rand() function be denoted by Xi , then:
Xi = Ri+344 >>1.
It is a 31-bit number and the least significant bit of Ri+344 has been ignored. The multiplication by 16807 is done in a large signed integer type so that there is no overflow before the modulo operation. Further Ri-1 is converted to a signed 32-bit value before the multiplication. Value obtained can only be negative in the case of i=1, if s ≤ 231. The modulo
operation is mathematical and result obtained is in between 0 and 2147483646. Almost linear output sequence is obtained even after ignoring the least significant bit.
The C code for generating the random numbers same as that generated by rand() can be written as:
#include <stdio.h> #define MAX 1000 #define seed 1 int main() { int r[MAX],i; r[0] = seed; for (i=1; i<31; i++) {
r[i] = (16807LL * r[i-1]) % 2147483647; if (r[i] < 0) {
r[i] += 2147483647; }
}
for (i=31; i<34; i++) { r[i] = r[i-31]; }
for (i=34; i<344; i++) { r[i] = r[i-31] + r[i-3]; }
for (i=344; i<MAX; i++) { r[i]= r[i-31] + r[i-3];
printf("%d\n",((unsigned int)r[i]) >> 1); }
return 0; }
The various different sequences can be generated by giving different initialising seed values each time to rand() of GCC. The varying seed value can be obtained by using time() function present in the time.h header file of GCC library to initialise the random function. It returns the number of seconds passed from January 1, 1970 till the current time. The GCC Library function time() can be used with srand() as follows: srand(time(NULL)) The rand() can be used to obtain numbers in any certain range by a slight modification. E.g. numbers between 0 to m can be obtained by using modulo (m+1) with the rand() . The rand() can further be modified to obtain negative values by subtracting appropriate number after modulo operation. The following C code has been used to generate first 1000 terms with values between 0-999 by rand() of GCC compiler which will be used for conducting
the randomness test, and some of the generated terms are mentioned in Table 2.
#include<stdio.h> #define seed 1 #define MAX 1000 int main()
{
int i,r[MAX]; srand(seed); for(i=0;i<MAX;i++) {
r[i] = rand()%1000; printf("%d\n",r[i]); }
return 0; }
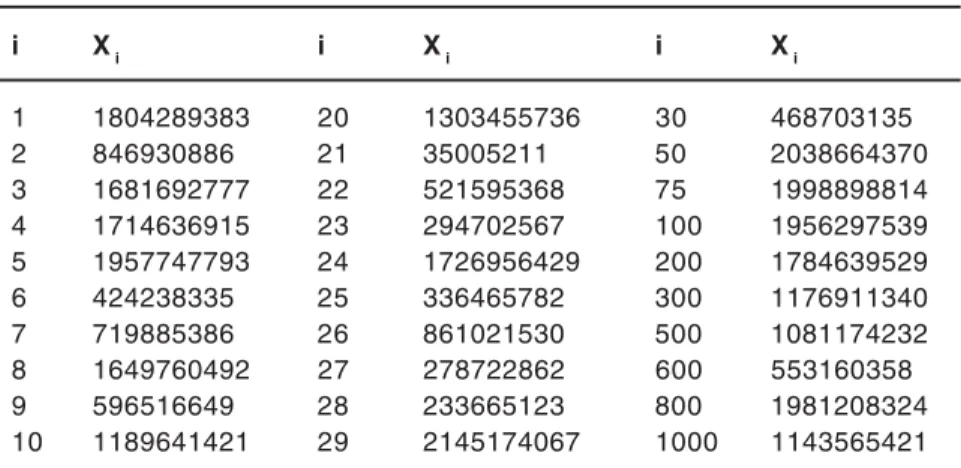
Table 1: Xi generated by the above C code
i X i i X i i X i
1 1804289383 20 1303455736 30 468703135
2 846930886 21 35005211 50 2038664370
3 1681692777 22 521595368 75 1998898814
4 1714636915 23 294702567 100 1956297539
5 1957747793 24 1726956429 200 1784639529
6 424238335 25 336465782 300 1176911340
7 719885386 26 861021530 500 1081174232
8 1649760492 27 278722862 600 553160358
9 596516649 28 233665123 800 1981208324
10 1189641421 29 2145174067 1000 1143565421
Table 2: Ti generated by the above C code
i T i i T i i T i
1 383 15 763 100 539
2 886 20 736 200 529
3 777 25 782 300 340
4 915 30 135 400 868
5 793 40 42 500 232
6 335 50 370 600 358
7 386 60 281 700 775
8 492 70 857 800 324
9 649 80 750 900 587
Statistical Overview of the data
The statistical overview of the data obtained from rand() of GCC compiler has been calculated by taking different seeds from 1 to 10. The parameter includes mean, median, maximum value, minimum value, probability of occurrence
of even numbers, number of duplicate entries and non-occurring numbers in the data set. The summary statistics for the first 1000 random numbers obtained from rand() of GCC compiler are recorded in Table 3.
Table 3: Statistical overview of the data from rand()
Seed Mean Median Max Min P(Even) No of No of
non-Duplications Occurring Values
1 499.495 497 999 0 .507 268 362
2 494.843 494.5 999 1 .471 257 367
3 504.442 496 998 2 .512 259 358
4 493.549 494 998 0 .511 258 370
5 489.946 488 999 0 .480 263 369
6 512.263 531.5 999 2 .495 266 371
7 500.201 505 999 1 .489 260 365
8 511.306 519.5 998 9 .506 266 390
9 508.331 510 998 1 .475 258 358
10 504.028 523.5 999 0 .476 270 372
Analysis of data
There are many techniques used for analysing randomness of the sequence. Out of these three have been taken for visual analysis of the randomness and are graphical in nature. Random numbers obtained by GCC compiler by taking seed one will be used for analysis.
The Run Sequence Plot
Run sequence plot is a graph of each observation against the random numbers in the sequence. Figure 1 is the run sequence plot of 1000 numbers obtained from rand() of GCC compiler which shows a random pattern. The plot fluctuates around 500, the expected mean of the numbers, and these fluctuations appear random.
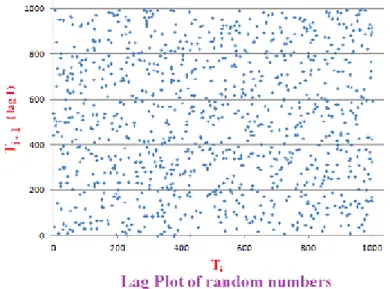
Lag plot
Lag plot is an interesting graph for detecting outliers. If there are chance outliers or significant outliers, this indicates that there may
be something wrong with the generator. Figure 2 shows no outliers and the data points are spread evenly across the whole plain. This is a good indication of randomness.
Fig. 2: Lag plot of random numbers (Ti against Ti-1)
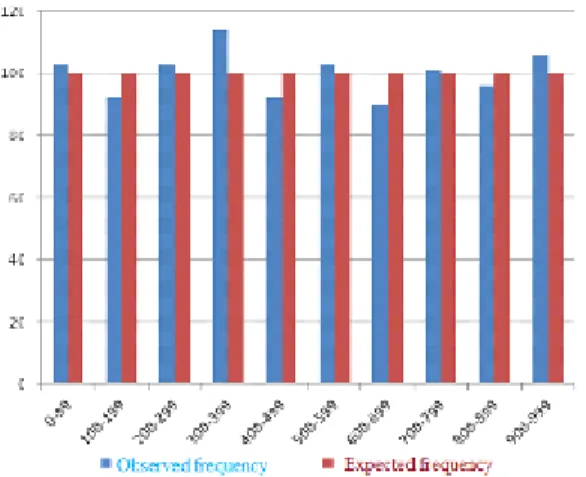
Fig. 3: Histogram of rand() The Histogram
The histogram plot is the count of observations that occur in each subgroup. The expected number of observations would be same
Theoretical test of randomness
The following three tests have been taken to test the randomness of the numbers:
Chi-square test
Chi-square test was given by Karl Pearson in 1900. It is a test of distributional accuracy. The chi-square test is a very common statistical test and is widely used in the analysis of random numbers 6-7. The given number of
observations is divided into n categories and the chi-square test (χ2 ) is given by:
where Oi is the observed frequency and E i is the expected frequency of ith observation.
The C code for determining chi-square test can be written as:
#include<stdio.h> #define MAX 1000 #define seed 1 int main() {
int i,j=0,r[1000],freq[1000]={0},count[10] ={0}; float median;
srand(seed); for(i=0;i<MAX;i++){
r[i] = rand()%1000; }
for(i=0;i<MAX;i++) { freq[r[i]]++;; }
printf("Oi are\n"); for(i=0;i<1000;i++) {
count[j] = count[j] + freq[i]; if(i%100 == 99) {
printf("%d\n",count[j]); j++;
} }
printf("\n Oi-Ei and their squares are \n"); float v=0;
for(i=0;i<=9;i++) { int y = count[i]-100; printf("%d\t %d\n",y,y*y); v= v+ (float)(y*y)/100; }
printf("value of Chi-square variable is %f\n",v); return 0;
}
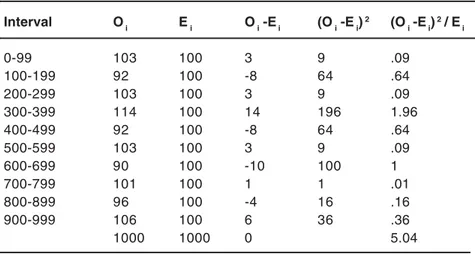
This test has been conducted by dividing the 1000 observations obtained in 10 equal categories having 100 observations in each. The expected frequency in each category of observation is 100. The results of the expected and observed frequencies are shown in Figure 4 in the form of a histogram. The value of χ2 is
calculated by the above formula and the calculations are summarised in Table 4.
The chi-square value (χ2) comes out to
be 5.04. The level of Significance (χ) is taken as 0.05. The critical value (χ2
α,n-1 = χ 2
0.05,9 = 16.92) is
determined from the Chi-square table1 . If χ2 >χ2
α ,n-1 then the given sequence fails the chi-square test.
Whereas, if χ2 ≤ χ 2
á,n-1 then the given sequence
passes the chi-square test of random numbers. Since the χ2 value is less than the critical
value so the null hypothesis is accepted at the 5% significance level. Therefore the numbers follow a uniform distribution which is one of the properties of random numbers.
Runs test above and below median
The runs test is a common, non-parametric, distribution free test. Runs test is a good test to determine any fluctuating trends in the given sequence8-9 . This test is based on the number of
runs of consecutive values above and below the median. A run is defined as a series of increasing or decreasing values. And the number of such increasing or decreasing patterns is defined as length of a run. In a random data set, the probability that the (i+1) th value is larger or smaller than the ith value follows a binomial distribution, which forms the basis of the runs test.
Those values of the given sequence which are greater than the median are assigned ‘a’, while those which are less are assigned ‘b’. Values which are equal to the median are ignored. Let the number of ‘a’s be defined as N1 and ‘b’s as
N2. The first step would be to calculate the number of runs in the sequence, and the values of N1 and N2. This can be well illustrated as:
Sequence : 25 34 45 29 37 48 median = 35.5
Values assigned : a a b a b b So the number of runs is 4 and value of N1 = 3 and
N2 = 3.
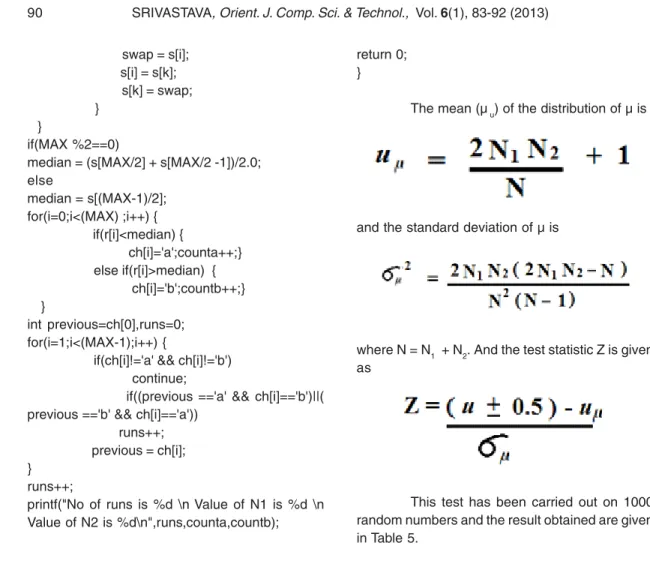
The C code to find the number of runs and the values of N1 (number of a’s) and N2 (number of b’s) for the random numbers generated by the rand() function is written as:
#include<stdio.h> #define MAX 1000 #define seed 1 int main() {
int i,k,swap,counta=0,countb=0,j,r[MAX],s[MAX]; char ch[MAX]={0};
float median; srand(seed); for(i=0;i<MAX;i++) {
r[i] = rand()%1000; s[i]=r[i];
}
for ( i = 0 ; i < ( MAX - 1 ) ; i++ ) { k = i;
for ( j = i + 1 ; j < MAX ; j++ ) { if ( s[k] > s[j] )
k = j; }
if ( k != i ) {
Table 4: Calculation of χχχχχ2 for the data
Interval O i E i O i -E i (O i -E i) 2 (O
i -E i) 2 / E
i
0-99 103 100 3 9 .09
100-199 92 100 -8 64 .64
200-299 103 100 3 9 .09
300-399 114 100 14 196 1.96
400-499 92 100 -8 64 .64
500-599 103 100 3 9 .09
600-699 90 100 -10 100 1
700-799 101 100 1 1 .01
800-899 96 100 -4 16 .16
900-999 106 100 6 36 .36
swap = s[i]; s[i] = s[k]; s[k] = swap; }
}
if(MAX %2==0)
median = (s[MAX/2] + s[MAX/2 -1])/2.0; else
median = s[(MAX-1)/2]; for(i=0;i<(MAX) ;i++) { if(r[i]<median) {
ch[i]='a';counta++;} else if(r[i]>median) { ch[i]='b';countb++;} }
int previous=ch[0],runs=0; for(i=1;i<(MAX-1);i++) {
if(ch[i]!='a' && ch[i]!='b') continue;
if((previous =='a' && ch[i]=='b')||( previous =='b' && ch[i]=='a'))
runs++; previous = ch[i]; }
runs++;
printf("No of runs is %d \n Value of N1 is %d \n Value of N2 is %d\n",runs,counta,countb);
return 0; }
The mean (µ u) of the distribution of µ is
and the standard deviation of µ is
where N = N1 + N2. And the test statistic Z is given as
This test has been carried out on 1000 random numbers and the result obtained are given in Table 5.
Table 5: Test characteristics
µ N1 N 2 µ u ì u Z
491 499 499 500 15.78 -.602
The level of significance (α) is taken as 0.05 and critical value of Zα/2 is determined from the standard table1. The sequence is only excepted
as random number, if |Z| < Zα/2.
Critical value = Zα/2 = Z0.025 = 1.96 Therefore for successfully passing the test: |Z| < Zα/2
´ -1.96 < Z <1.96 ´ -1.96<-.602<1.96
As the current value for Z lies between ±1.96 hence the null hypothesis is accepted at the 5% significant level.
Reverse arrangement test
Then,
and
First, h ij is calculated for each number and summing these h’s gives Ai. Then A i is calculated for each observation and the sum of these A i’s gives A, the total number of reverse arrangements. If the sequence of N observations are independent observations on the same random variable, then the number of reverse arrangements (A) is a random variable with a mean (µA)
and a variance
This test has been applied on first 100 terms obtained by rand() i.e. with N=100.
This test has been performed by using the C code as:
#include<stdio.h> #define MAX 100 #define seed 1 int main() { int i,h,j,r[MAX]; srand(seed);
for(i=0;i<(MAX);i++) {
r[i] = rand()%1000; }
h=0;
for ( i = 0 ; i <(MAX-1) ; i++ ) {
for ( j = i + 1 ; j <MAX ; j++ ) { if ( r[i] > r[j] ) h++; }
}
printf(“value of A is %d”,h); return 0;
}
The value of A obtained after calculation is 2501. Level of significance is taken as 0.05, and the critical values AN;(1-α/2) and AN;α/2 are obtained from the standard table1. The given sequence is
accepted as random numbers, only if the number of reverse arrangements A lies between the critical values. Hence for the sequence to pass the test: ´ AN;(1-α/2) < 2501 < AN;α/2
´ A100;0.975< 2501 < A100;0.025 ´ 2145 < 2501 < 2804
As the value for A in this experiment lies between 2145 and 2804 hence the null hypothesis is accepted at the 5% significance level. The mean and variation of the distribution are calculated by the above formula:
µA = 2475 σA
2= 27362.5
CONCLUSIONS
REFERENCES
1. Knuth, Donald E. The Art of Computer Programming. vol. 2. 2 ed. Addison-Wesley,1981.
2. Bennett, Deborah J. Randomness. Cambridge: Harvard University Press, 1998.
3. Garrett, Paul, Introduction to Cryptography. Notes. 2000.
4. Hellekalek, Peter. The p-Lab Project. <http:/ /random.mat.sbg.ac.at>.
5. Peter Selinger, Department of Mathematics and Statistics <http://www.mathstat.dal.ca/ ~selinger/random/>
6. Li, Ming and Paul Vitanyi. An Introduction to Kolmogorov Complexity and its Applications. New York: Springer-Verlag, 1993.
7. Walker, John. HotBits. 10 June 2000. <http:/ /www.fourmilab.ch/hotbits/>.
8. Louise Foley, Statistical analysis 2001, Trinity College’s Management Science and Information Systems Studies (MSISS) 9. Charmaine Kenny, Statistical analysis