Jan-Erik Lane (Correspondence)
[email protected]
+This article is published under the terms of the Creative Commons Attribution License 4.0 Author(s) retain the copyright of this article. Publication rights with Alkhaer Publications. Published at: http://www.ijsciences.com/pub/issue/2017-02/
DOI: 10.18483/ijSci.1089; Online ISSN: 2305-3925; Print ISSN: 2410-4477
Emissions and Energy: A Catch 22?
Jan-Erik Lane
1
1Fellow at Public Policy Institute, Belgrade ( 10 Charles Humbert, Geneva )
Abstract: The COP21 process targets decarbonisation in three steps during the 21rst century. First the augmentation of CO2:s is to be halted. Next the 40 per cent reduction is to be implemented somehow until 2030. Finally, there is a hope for a carbon free economy at the end of this century. But how about energy? When we speak about the anthropocentric emissions of greenhouse gases, then we are in reality referring to the production and consumption of energy. Energy in a wide sense is vital for the operations of social systems, as energy is the capacity to do work. Without energy, no economic output or GDP. The COP21 Agreement calls for an energy revolution during this century, replacing traditional renewables and fossil fuels with modern renewables that are carbon free. But how could this be achieved in the many poor countries in the world?
Keywords: COP21, global energy transformation, GHG or CO2, implementation of COP21, Superfund (Stern), traditional and modern renewables, fossil fuel dependency.
INTRODUCTION
Energy is necessary for economic development. It is crucial in all the sectors of the economy: transportation, industry, heating, housing, agricultutr, construction,etc.
a) Energy and affluence
The larger the GDP, the more energy is consumed (Figure 1).
Figure 1. Energy and GDP
Figure 1 shows that reaching a higher level of affluence or leaving dismal poverty requires energy – and a lot of it. Third world countries push economic development in order to catch-up with the First World. “Catching-up” requires access to energy in some form or another, The priority given to economic growth by almost all stakeholders except the environmentalists implies an enormous weight rendered to energy, by companies, financial institutions and finance ministers.
During the last twenty years, economic growth in the world economy has been much driven by the consumption of energy. Figure 2 displays the incredible increase in energy consumption per capita since 1990.
Figure 1. Energy per person and GDP
http://www.ijSciences.com
Volume 6
– February
2017 (02
)
2
b) The Catch 22Thus, energy makes people and nations more powerful, but it some with a cost, namely the GHG emissions in general and CO2:s in particular. When the emission of greenhouse gases becomes too much, climate changes in a negative fashion for social systems as well as biological ones. Too much CO2:s would reduce affluence and even hurt the health of human beings to the possible brink of annihilation.
The means of CO2 reduction in the short run and total decarbonisation in the long run are to further the goal of halting climate change, given one major restriction. Global warming policy-making must not lead to economic decline, i.e. negative economic growth of the absence of economic development. Thus, the COP21 believes in the possibility of economic growth without emissions growth, breaking the pattern set for a long time (Figure 3).
FIGURE 3. GDP-GHC Globally: y=0.85x, R2=0.80
There is a clear and almost linear relation between economic development (GDP) and GHG:s or CO2:s. The huge task is to bring forth technology that breaks this relationship now.
c) Decarbonisaton
Logically speaking, the CO2:s can only be reduced through decarbonisation of the economy in a wide, which can be promoted through:
- A zero growth economy or “sustainable economy”, but it is not likely to occur, as this concept is opaque;
- A massive transition to solar, wind and nuclear power, which would require enormous new investments. Large scale solar and wind power needs huge space and are vulnerable to sabotage;
- A reduction in global output, meaning recessions. It will be avoided by governments by all means necessary;
- A global introduction of carbon sequestration technology, which is truly expensive.
The link between economic growth and environmental protection has been much debated in public policy and environmental economics. One may identify four positions:
- Positive: growth makes environmental protection feasible – rapid growth promotes environmental care;
- Negative: economic development uses up environmental resources or assets – zero growth economy;
- Contingency: it depends upon the particular project whether the impact is positive or negative; - Trade-off: often development projects result in some economic gains against some environmental losses.
One can find examples of all four types of combination between growth and environment in all countries: e.g. huge Indian solar panel parks, Chengdu Park for pandas, big Jakarta harbour protection wall, opening up coal mines in tiger sanctuaries in India, burning down the rain forest in Kalimantan for agriculture, building the enormous dam – Three Gorges Dam in China, etc. But, as Indian expert Ramesh (2015) underlines, the question of emissions, energy and economic development involves somehow a trade-off between environment and growth. One may certainly fear that many governments will renege upon COP21, when faced with a choice between economic growth and green sustainability.
Interestingly, renowned economist Sachs has launched a coherent call for the world to move towards sustainable development, based on decarbonisation of the energy systems of countries
(http://jeffsachs.org/2015/08/sustainable-development-for-humanitys-future/). He has correctly emphasized the close link between economic development or growth and the massive use of fossil fuels as energy sources during the last 20 years, resulting in the enormous expansion of GHG emissions in line with GDP. I believe it is more likely that global warming will simply proceed before people are willing to accept a sustainable economy, meaning total decarbonisation with loss of economic output, i.e. income.
TYPES OF ENERGY AND EMISSION
CONSEQUENCES
http://www.ijSciences.com
Volume 6
– February
2017 (02
)
3
decarbonisation at 40% or 90-100% entails that this link is broken. Economic progress would be possible without carbon related energy sources and thus have carbon neutral emissions. Is this a figment of the hard core environmentalist’s imagination, or practically achievable in a very short time span?
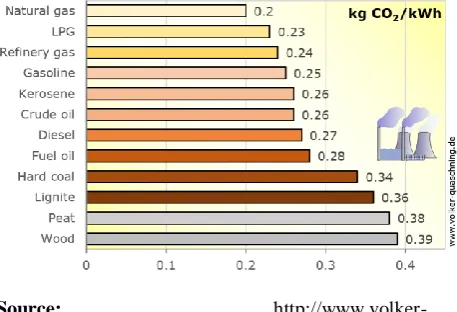
Energy consumption occurs in all sectors of the economy in a wide sense. And most of the anthropogenic CO2:s result from this energy consumption – see Figure 4.
FIGURE 4. Specific Carbon Dioxide Emissions of Various Fuels
Source:
http://www.volker-quaschning.de/datserv/CO2-spez/index_e.php
Now, the COP21 process serves the purpose of decarbonisation, meaning decreasing country CO2 emissions, first by 40% until 2030 and later up to 90-100% by the end of this century. Whether a country can accomplish this depends upon two factors: its GDP-CO2 link and its actual energy mix. Note in Figure 4 that wood and charcoal is very harmful in terms of CO2 – traditional renewables.
The COP21 process will prove very demanding for any government and its society, both in the short-run and in the long-term perspective. As a matter of fact, a few continents are today experiencing fast population growth and rising demands for higher quality of life and public services. Of particular importance to ordinary people is the access to electricity. But electricity is often produced by burning the fossil fuels, resulting in CO2 emission. Now, the greenhouse gases must be reduced considerably, despite rising demands. How?
MODEL OF CLIMATE CHANGE POLICY-MAKING
To understand the logic climate change policy-making in a country, one needs to know two essential things in model 1:
(1) <GDP-COP (GHG) link, Energy mix> Where the first tells you how dependent the country economy is right now of emissions, and the second
element informs you about the energy alternatives that are feasible for this country.
Generally speaking, one may wish to argue that:
- The closer the link between GDP and CO2 is positively, the more costly it will be to halt and reduce the rise in emissions;
- If this link is linear, then reductions in CO2:s may come at the cost of recession or economic decline;
- The fewer the alternative energy sources are, the most costly will be the implementation of an energy policy resting upon renewables;
- Countries that are poor tend to rely heavily upon some fossil fuels and will require massive help from the Superfund in the COP21;
- There is a blatant risk of reneging on the part of several countries, meaning the occurrence of implementation failure.
The concept of implementation failure was introduced into policy analysis and public administration by the late Aaron Wildavsky, underlining the profound distinction between policy and outcome, programs and results, as well as promises and reality (Pressman and Wildavsky, 1973, 1984). Implementation being the process of carrying a policy into effect may fail, as the objectives stated do not surface in social life. Instead, polices may lead to irrelevant or even opposite outcome, when judges by the goals.
Successful implementation can only occur when a government has:
- Clear objectives
- Knowledge of the means
- Support from bureaucracy and society – “advocacy coalitions” with Paul Sabatier (1988, 1989).
I would like to state that decarbonisation policy-making does not fulfill these three essential and necessary requirements. Let me mention a few country examples where decarbonisation will prove difficult.
COAL
http://www.ijSciences.com
Volume 6
– February
2017 (02
)
4
FIGURE 5. China: GDP-CO2: y = 0,70x, R² = 0,97Chinese energy policy must of course start from the actual situation with regard to its energy mix. It relies heavily upon fossil fuels, especially coal – Figure 6.
FIGURE 6. China’s energy mix
It is true that China’s leaders have understood that the energy mix above is completely sustainable. Thus, a frenetic activity has been initiated to increase modern renewables: solar, wind and hydro power besides massive investments in atomic power. Old coal mines have been shut down. Yet, does all of this add up to diminish the CO2:s? Perhaps halting the increase in CO2:s, but hardly a decrease of 40%, as required by 2030.
China cannot allow economic growth to go down towards zero, meaning that it must find new energy sources that are carbon neutral to continue its magic economic advances. China may wish to invest in carbon capture and sequestration, or even venture into carbon sucking projects. The new energy policies will be costly for China!
It should be pointed out that transparency is lacking about the real outcomes of China’s new ambitions. If many coal mines are in fact shut down, then how many new ones are opened or planned? Sometime, China says its ambition to halt or decrease CO2:s are relative (to GDP) and not in absolute numbers. This would make all talk about COP21 implementation ambiguous or opaque.
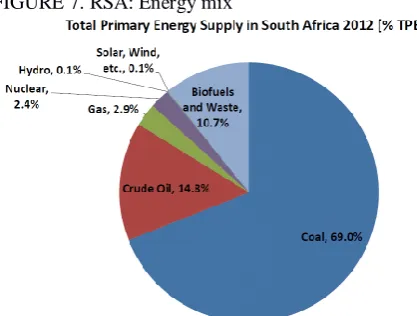
A nation relying almost exclusive upon coal is South Africa. Its energy mix appears in Figure 7.
FIGURE 7. RSA: Energy mix
One may suspect that biomass as almost always on the African continent include lots of charcoal and dung, which brings the coal dependency over 70%. Modern renewables are employed much too little to let South Africa comply with the COP21. Although the country is plentiful of coal, it must turn towards solar energy, which also would come plentiful.
OIL AND GAS
When countries are heavily dependent upon fossil fuels, it may actually not be coal that is the largest source, but oil and gas. To verify this, we go to the north of Africa, the Maghreb.
FIGURE 8. Egypt: Energy mix
http://www.ijSciences.com
Volume 6
– February
2017 (02
)
5
Oil producing countries tend to rely exclusively upon petrol and gas. Here, we offer Mexico and Saudi Arabia as examples.
FIGURE 9.Mexico: Energy mix
With this pattern of energy consumption, Mexico is the largest emitter of CO2 with Brazil in Latin America. Comply with COP21, it has to reduce oil and gas, moving towards solar power and perhaps atomic power.
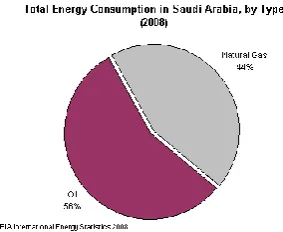
In the Gulf, the reliance upon fossil fuels oil and gas is 100%. CO2 emissions are quite substantial, or on a per capita basis the biggest world-wide (Figure 9).
Figure 9. Saudi Arabia: Energy
The Gulf states employ fossil fuels for generating electricity for their conspicuous consumption, paranoiac building projects (cement) and maintaining high standards in transportation. Some of them have started to invest in nuclear power and modern renewables so that they can sell oil and gas on the world markets. The advanced Gulf States are also introducing solar power, but the scale of these renewable energy experiments does not much reduce their fossil fuel dependency. Iran displays the same energy mix, and they eagerly want access to market to sell oil and gas, to be replaced with atomic power, hopefully.
Countries may rely upon petroleum and gas mainly – see Iran (Figure 10). CO2 emissions have generally followed economic development in this giant country, although there seems to be a planning out recently, perhaps due to the international sanctions against its economy.
FIGURE 10. Iran: GDP-CO2 (y = 1,2229x - 4,91; R² = 0,98)
Iran is together with Russia and Qatar the largest owner of natural gas deposits. But despite using coal in very small amounts, its CO2 emissions are high. Natural gas pollute less than oil and coal, but if released unburned it is very dangerous as a greenhouse gas. Iran relies upon its enormous resources of gas and oil (Figure11).
FIGURE 11. Iran: Energy mix
Iran needs foreign exchange to pay for all its imports of goods and services. Using nuclear power at home and exporting more oil and gas would no doubt be profitable for the country.
http://www.ijSciences.com
Volume 6
– February
2017 (02
)
6
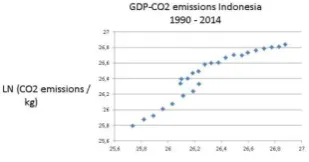
was true of China and South East Asian countries. Let us look at three more examples, like e.g. giant Indonesia – now the fourth largest emitter of CO2:s in the world (Figure 12).
Figure 12. INDONESIA: LN (CO2 / Kg and LN (GDP / Constant Value 2005 USD)
Indonesia is a coming giant, both economically and sadly in terms of pollution. Figure 9 reminds of the upward trend for East Asia. However, matters are even worse for Indonesia, as the burning of the rain forests on Kalimantan and Sumatra augments the CO2 emissions very much. Figure 13 presents the energy mix for this huge country in terms of population and territory.
FIGURE 13. INDONESIA: Energy mix
Source: (http://missrifka.com/energy-issue/recent-energy-status-in-indonesia.html)
Only 4 per cent comes from hydro power with 70 per cent from fossil fuels and the remaining 27 per cent from biomass, which alas also pollutes. One can be sure that it is mostly a question of tradition renewables – wood, charcoal – and they pollute a lot.
TRADITIONAL RENEWABLES
A general teent in the climate change debate is that renewables should be preferred over non-renewables. Yet, this statement must be strictly modified, as there are two fundamentally different renewables:
- Traditional renewables: wood, charcoal and dung. They are not carbon neutral. On the contrary, employing these renewables
results in severe pollution, not only outside but also insidea household;
- New renewables: solar, wind, geo-thermal and wave energy that are indeed carbon neutral, at least at the stage of functioning. In the poor African countries with about half the population in agriculture and small villages, traditional renewables constitute the major source of energy.
FIGURE 14. DR KONGO
Source: Democratic Republic of Congo - Energy Outlook, Kungliga Tekniska Hoskolan
One notes in Figure 14 how little of hydro power has been turned into electricity in Kongo, but economic development and political instability, civil war and anarchy do not go together normally. At the same, one may argue that an extensive build-up of hydro power stations would pose a severe challenge to the fragile environment in the centre of Africa. Kongo can now move directly to modern renewabes like solar power.
The energy consumption of Sudan reflects this situation – Figure 15. The countries that rely upon traditional renewables to an extent upto 50 per cent or higher will have to reflec upon how to bring these figures with modern renewables. Iit is an entirely different task than that of countriess with too much fossil fuel dependency.
http://www.ijSciences.com
Volume 6
– February
2017 (02
)
7
FIGURE 15.
http://500wordsmag.com/science-and-technology/the-case-of-photovoltaics-in-sudan/
The reliance upon traditonal renewables is so high in neighbouring Ethiopia that electrification must be very difficult to accomplish over the large land area. Figure 16 displays a unique predicament.
FIGURE 16. ETHIOPIA: Energy mix
Is there any advantages with such a skewed energy mix? No, becausee even mainly rural Ethiopia works with lots of CO2: - see Figure 17.
FIGURE 17. Ethiopia: GDP and CO2:y = 0,90x, R² = 0,88
The zest with which Ethiopia is pursuing its control over water resources becocomes flly understandable, when Figure 17 is consulted. Whar we aee is the
same smooth linear function plotting CO2:s upon GDP, as is obvious in countries based upon fossil fuels – see below. For Ethiopia, to comple with COP21 goals is goint to pose major challenges, especially if economic development is not going to be reduced. The country needs massive help, both finacially ad technologically.
DEEP ELECTRIFICATION
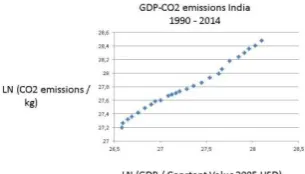
The global agreement on cutting down CO2 emissions comes at a point in time when several nations hope for the first time to offer the convenience of electric power to all its citizens. If a country possesses much coal, then burning it gives much electricity in a cheap manner. But the COP21 commitment eliminates this alternative. Look at India in Figure 18 with enormous CO2 emissions.
FIGURE 18. India: GDP-CO2: y = 0,7702x + 6,79; R² = 0,99
India needs cheap energy for its industries, transportation, housing and heating as well as much more electrification. From where will it come? India has water power and nuclear energy, but relies most upon coal, oil and gas as power source. It has strong ambitions for the future expansion of energy, but how is it to be generated, the world asks. India actually has one of smallest numbers for energy per capita, although it produces much energy totally.
Growth-ecology trade-off
Ramesh (2015) is a remarkable Indian publication, comprising more official documents than written own analysis. Author Ramesh has published documents from his period as Minister of Environment in the federal government, where we find all sorts of materials: speeches, public letters, administrative decisions, etc. This means that the Reader has to work hard with texts, as the short comments by the Author are rather general in tone. However, this is interesting and highly relevant reading.
http://www.ijSciences.com
Volume 6
– February
2017 (02
)
8
roles, academically and politically. Highly relevant for understanding the conditions for ecological policy-making in the largest country in the world very soon ate the materials concerning the following themes;
1) India's coal dependency
2) The immense need for electricity
3) The implementation gap of environmental legislation and decrees
4) The clash between economic growth and environmental protection
6) India' large vulnerability ecologically to global warming and environmental degradation
7) The drying up of rivers for hydro generation and the loss of land to sea level rise.
Interestingly, Ramesh emerged from the growth lobby but turned ecologically friendly when faces with all the demands for clearances for ecological interference. No wonder he was controversial as minister, considered both growth advocate and the
NO GO man. He is well entrenched in the global discussions concerning climate change policy-making, claiming that India has a major contribution to render in the debate about the necessary growth-ecology trade off.
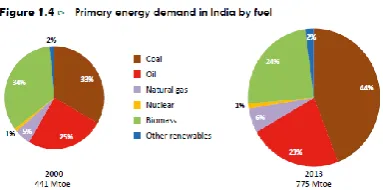
FIGURE 19.India’s energy mix
India needs especially electricity, as 300 million inhabitants lack access to it. The country is heavily dependent upon fossil fuels (70 per cent), although to a less extent than China. Electricity can be generated by hydro power and nuclear power, both of which India employs. Yet, global warming reduces the capacity of hydro power and nuclear power meets with political resistance. Interestingly, India uses much biomass – wood, charcoal and dung – as well as waste for electricity production, which does not always reduce GHG emissions – quite the contrary actually. India’s energy policy will be closely watched by other governments and NGO:s after 2018. And the country needs massive financial support from Stern’s fund in order start using modern renewables and atomic power.
WATER POWER
Water is a powerful source of energy, though not comparable to atomic power of course. It is
absolutely carbon free, except in construction. It may or may not damage the environment, but it adds crucially to country independence from international oil and gas markets. Look at Latin America where water from the Andes is plentiful.
FIGURE 20. Brazil: Energy mix
Hydroelectric power is massive in Brazil and capacity has grown steadily since 1965. However, hydro production has been down owing to late and light rains. Brazil is one of the few countries in the world where liquid biofuel production is significant: ethanol. Gas production in Brazil is significant, but Brazil has very little of coal production. In 2006, the discovery of vast oil resources in the sub-salt strata of the Santos Basin promised petroleum bonanza, but deep water and sub-salt setting has posed technical challenges and high costs. Brazil has 3 nuclear reactors, but nuclear provides merely 1% of primary energy.
One can hardly say that it will easy for Brazil to live up to its COP21 commitments, despite its comparatively low dependence upon fossil fuels. Its large hydro power supply is vulnerable to draught, as rivers dry up. And then one must add the political difficulties in managing the oil and gas reserves properly in giant enterprise Petrobas. The huge Mato Grosso could be used for renewable energy generation, wind and solar power.
Energy is an interesting aspect of this nation, which is now in turmois because of the lack of it, despite the immense oil and gas resources of this country. Just as with otheroil producing countries, one expects the CO2:s to be quite substantial. Figure 21 confirms thiss expectation, but one may note many yearly ups and downs in reWhy this link is not a smooth one may be explained both by the energy mix and the volatile politics of Venezuela.
http://www.ijSciences.com
Volume 6
– February
2017 (02
)
9
FIGURE 22. Venezuela: Energy mixThe dependency upon fossil fuels is high in Venezuela, but the country differens from Mexico in that it disposes of considerable hydro power. Typical of Latin America is that several countries make use of hydro power to mitigate their dependency upon fossil fuels, mainly oil and natural gas. In the case of Venezuela, it is the water resources that have failed, causing enormous electricity chaos, resulting in huge loss of output and work. Evidently, no Venezuelan government has not taken precautionary action, building for instance some sets of back up generators based upon its massive oil and gas reserves.
NUCLEAR POWER
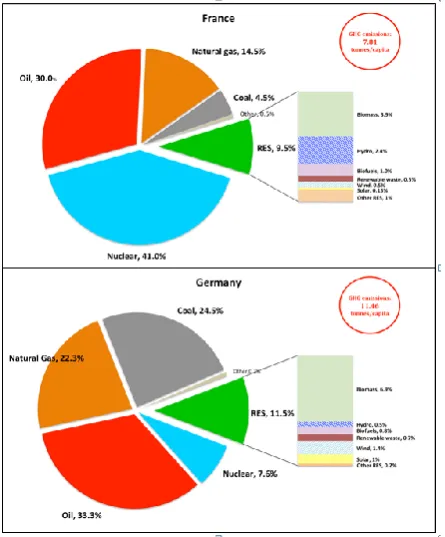
Interestingly, also France has like Germany managed decarbonisation to some extent (Figure 23). It reflects its unique energy mix, relying much upon nuclear power in a comparatively unique way.
Source: http://blog.iass-potsdam.de/2015/05/energy-transition-france-following-in-germanys-footsteps/ Yet, France has decided to diminish its reliance upon nuclear power. But how will it be replaced by other sources of energy? Figure 23 infroms about the considerable reliance upon fossil fuels in Germany and France too. France and a few other countries deviate from the global patters, as the curve for GDP-CO2 is sloping somewhat down recently (Figure 24).
FIGURE 20. France (y = -0,13x + 30,4; R² = 0,08)
http://www.ijSciences.com
Volume 6
– February
2017 (02
)
10
European Green Movement cannot have it both ways: shutting down nuclear power and elimination fossil fuels?
CONCLUSION
Scholars who argue that we can have both decarbonisation and economic growth bet upon the arrival of both more energy efficient technologies and technological innovations that lead to more energy but have little emissions of greenhouse gases. Thus, nuclear power plants can be built in such a way that the risk of a melt-down is excluded. And solar power gets all the time cheaper and more reliable.
Yet, in relation to the COP21 Agreement there is cause for much pessimism. It is true that small changes are feasible, replacing fossil fuels with renewables, but we are talking about the need for large scale transformation. See a standard prediction for energy demand in Figure 24.
FIGURE 24. Stylised energy projections
Source: https://therationalpessimist.com/tag/bp-energy-outlook-2030/
These projections for 2030, the year of COP21, are completely outside of its objectives of a 40% reduction of CO2 emissions.
The CO2:s can only be reduced through decarbonisation of the economy in a wide, which can be promoted through:
- A zero growth economy or “sustainable economy” with Sachs, but it is not likely to occur;
- A massive transition to solar, wind and nuclear power, which would require enormous new investments. Large scale solar and wind power needs huge space and are vulnerable to sabotage;
- A reduction in global output, meaning recessions. It will be avoided by governments by all means necessary.
Here is the catch 22: affluence needs energy more and more, but energy comes with emissions, and the more of emissions, the higher the costs to humanity.
REFERENCES
GDP sources:
1. World Bank national accounts data - data.worldbank.org
OECD National Accounts data files
GHG sources:
2. World Resources Institute CAIT Climate Data Explorer - cait.wri.org
3. EU Joint Research Centre Emission Database for Global Atmospheric
Research - http://edgar.jrc.ec.europa.eu/overview.php 4. UN Framework Convention on Climate Change - http://unfccc.int/ghg_data/ghg_data_unfccc/time_series_annex_i/it ems/3814.php
5. International Energy Agency. Paris. Energy Information Administration. Washington, DC. 6. BP Energy Outlook 2016.
7. IEA – Key World Energy Statistics
Literatur
8. Heller, J. Catch 22 (1961) New York: Simon and Schuster.
9. Mazmanian, D.A. and P. A. Sabatier (1989) Implementation and Public Policy. Lanham, MD: UPA.
10. Pressman, J. and A. Wildavsky (1973, 1984) Implementation. Berkeley: University of Cal Press.
Ramesh, J. (2015) Green Signals: Ecology, Growth and Democracy in India (2015). Oxford : Oxford University Press. 11. Sabatier, P.A. (1988) “An advocacy coalition framework of policy cha nge and the role of policy-oriented learning therein”, in Policy Sciences, Volume 21: 129-168. 12. Sachs, J. (August 10th, 2015) “Sustainable Development for Humanity’s Future” (http://jeffsachs.org/2015/08/sustainable-development-for-humanitys-future/)
13. Stern, N. (2007) The Economics of Climate Change. Oxford: OUP.