Improvement of QR Code Recognition Based on Pillbox Filter Analysis
Jia-Shing Sheu
1,*1Department of Computer Science, National Taipei University of Education, Taipei, Taiwan, ROC.
, Kai-Chung Teng
1Received 15 January 2013; received in revised form 10 February 2013; accepted 09 March 2013
Abstract
The objective of this paper is to perform the innovation design for improving the recognition of a captured QR
code image with blur through the Pillbox filter analysis. QR code images can be captured by digital video cameras.
Many factors contribute to QR code decoding failure, such as the low quality of the image. Focus is an important
factor that affects the quality of the image. This study discusses the out-of-focus QR code image and aims to improve
the recognition of the contents in the QR code image. Many studies have used the pillbox filter (circular averaging
filter) method to simulate an out-of-focus image. This method is also used in this investigation to improve the
recognition of a captured QR code image. A blurred QR code image is separated into nine levels. In the experiment,
four different quantitative approaches are used to reconstruct and decode an out-of-focus QR code image. These nine
reconstructed QR code images using methods are then compared. The final experimental results indicate
improvements in identification.
Keywords: QR code, pillbox filter, recognition
1.
Introduction
In the recognition of the QR code, the information stored within the QR code can be easily retrieved by a decoding
process that utilizes an image-capturing device with at least 300,000 pixels combined with the application of decoding software.
The decoding is also not restrained by the angle of the image because the captured image can be rotated to the correct angle
before performing the decoding. Given this flexibility, the QR code can be widely used in various trades and fields [1-3]. The
QR code has 40 versions, from No.1 to No. 40. The higher the version number, the more data it stores and the larger the size of
the image. Using the same equipment to obtain a version with a higher number under the same environmental conditions, the
results will be happened in an out-of-focus image. Before decoding the QR code, the coded image should be first obtained. The
quality of the image determines the success rate of the decoding; factors that influence image quality include the characteristics
of the image-capturing device [4], the characteristics of the media containing the QR code, and out-of-focus blurriness due to
the distance to the QR code image [5-8].
Although an out-of-focus QR code image is one of the main factors contributing to decoding failure, very few
investigations on decoding out-of-focus QR code images have been conducted. The aim of this paper is to investigate into the
characteristics of out-of-focus blurry QR code images. Four reconstruction methods are proposed to reconstruct nine new QR
code simulations that have different degrees of blurriness. To find a reconstruction method with the best recognition ability, the
discrepancies between the original QR code image and reconstructed QR code image were investigated to check whether
decoding can be conducted [9-12].
*Corresponding author. E-mail address: [email protected]
The hypothesis of this paper is based on whether the positions on the QR code can be fully determined and the diagram is
absolutely clear and correct. Nine out-of-focus QR code images with different degrees of blurriness are reconstructed using the
following methods to obtain a clear QR code: average reconstruction, center-point reconstruction, adjacent pixel reference, and
adjacent pixel–center-point reference. The obtained QR codes are then compared against the original QR code. The pillbox
filter method is used to simulate blurry images, which are then applied to the QR code image. The pillbox method, which is used
to conduct distorting simulation of the QR code image, not only creates an out-of-focus blurry phenomenon visually but also
simulates out-of-focus situations, as shown by many imaging-related studies. Therefore, this study also used the pillbox filter to
simulate out-of-focus situations. Using different degrees of blurriness and different reconstruction methods, the change in the
interpreted values of the QR code are analyzed to find a better recognition method. This study primarily investigates
out-of-focus QR code images and proposes four types of reconstruction methods for finding a high-performance recognition
reconstruction algorithm.
2.
QR Code Property
A complete QR code assembly includes an encoding region and function patterns. The encoding region is used to store
data, and the function patterns are used to determine the alignment of the QR code. Function patterns include position detection
patterns, separators for position detection patterns, timing patterns, and alignment patterns. A two-dimensional array is used to
represent the QR code dot matrix. The boundaries for the size n×n array is (0 to (n-1), 0 to (n -1)). The binary value 1 denotes
the totally black module, and 0 denotes the totally white module. The QR Size denotes the number of modules in the horizontal
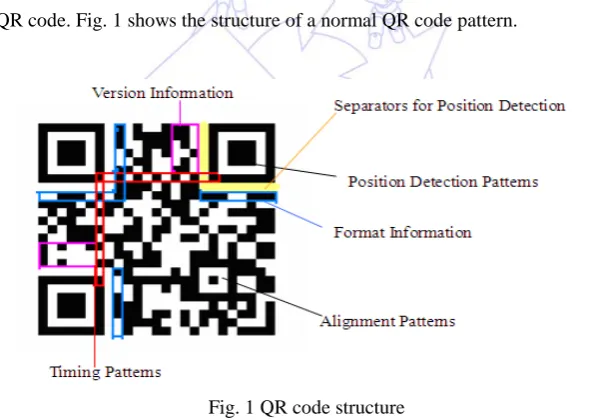
and vertical axes of the QR code. Fig. 1 shows the structure of a normal QR code pattern.
Fig. 1 QR code structure
Position detection patterns are used to define the boundary of the entire QR code on the entire diagram. Each individual
QR code has three positioning symbols that are incorporated into the QR code during the initial encoding and are individually
distributed on the top left, bottom left, and top right of the QR code boundary. The separators for the position detection patterns
are used to divide the positioning symbol and data symbol regions with widths of 1- to 0-bit and positioned individually at three
locations: top left, top right, and bottom left. Timing patterns are used to determine the version information, as well as the
alignment and density of the bit coordinates. Alignment patterns are used to reconstruct the corresponding bit coordinates of the
concurrent image, thereby reducing the influences caused by the distorted image. The encoding region contains the data and QR
Code formatting information, version information and the data, and error correction keys. The format information stores the QR
code error correction level and applies encoded masking information and is a symbol required by the QR code decoding. The
version information stores the QR code-encoded version information. The QR code must meet the encoded versions 7 to 40.
of error correction code uses the Bose-Chaudhuri-Hocquenghem(BCH) code. It uses 5 bits on behalf of the version number.
And it also uses 10 bits to present the version information of error correction code. Here, it will be used the form as BCH(15,5).
The format of the information to the left 5 bits displacement 10 bit divides by G x( )=x1 +x08+x5+x4+ +x 1. The result of 10 bits remainder is the error correction code bits. The error correction level indicators are shown in Table 1.
Table 1 Error correction level indicators
Error correction level Indication bits encoded value Number of error corrections (%)
L 01 7
M 00 15
Q 11 25
H 10 30
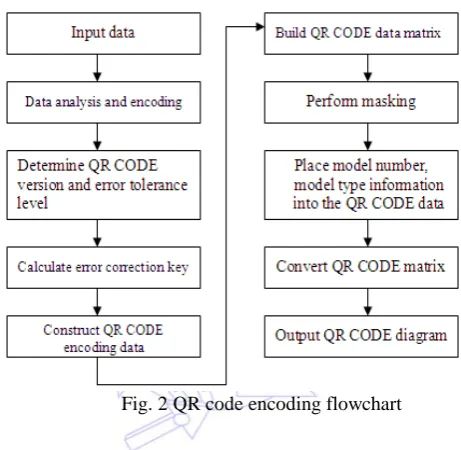
2.1. Encoding the QR code [13]
The QR code encoding process includes the inputting of the encoded data up to the generation of the QR code diagram.
Fig. 2 shows the procedure for the standard QR code encoding.
Fig. 2 QR code encoding flowchart
2.2. Decoding the QR code
The QR code decoding includes determining the region of the QR code up to obtaining the encoded character string. Fig.
3 shows the decoding process of the standard QR code decoding.
2.3. Pillbox filter [14][15]
The Pillbox filter is used to simulate the out-of-focus blurred algorithm. The definition of the Pillbox filter is shown in
equation (1).
(1)
Where R represents the radius for the blurred radius. Both x and y are representative of target position. Fig. 4 shows the
diffusion function diagram for the R=1.
Fig. 4 The diffusion function diagram for the Pillbox filter radius R=1
3.
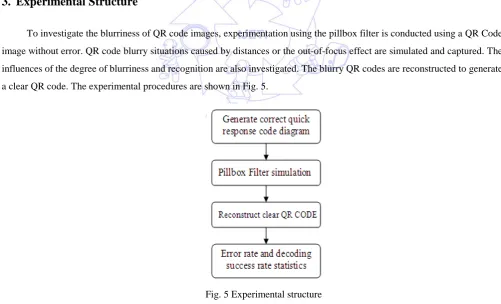
Experimental Structure
To investigate the blurriness of QR code images, experimentation using the pillbox filter is conducted using a QR Code
image without error. QR code blurry situations caused by distances or the out-of-focus effect are simulated and captured. The
influences of the degree of blurriness and recognition are also investigated. The blurry QR codes are reconstructed to generate
a clear QR code. The experimental procedures are shown in Fig. 5.
Fig. 5 Experimental structure
Fully correct sets of the QR code are generated, and the decoding is verified by the third-party software to confirm if the
Fig. 6 Encoding structure
The QR code version generated at this stage is 7, and the correction level is H. The length and width of each module is 10
px, as shown in Fig. 7.
Fig. 7 QR code (version: 7, error correction level: H)
The pillbox filter is an algorithm used to simulate out-of-focus blurriness [14]. This experiment uses the pillbox filter to
simulate blurry QR code situations caused by the out-of-focus effect to evaluate the value of each QR code module under
out-of-focus circumstances. A fully correct and clear QR code is used to create nine sets of QR code images with different
degrees of blurriness. The corresponding out-of-focus ratios are 10%, 20%, 30%, 40%, 50%, 60%, 70%, 80%, and 90%. The
“out-of-focus ratio” in this experiment refers to the ratio of the length of the radius of the pillbox filter to the length of a single
boundary of an individual QR code module, which denotes the degree of blurriness. When using a QR code bit single boundary
length of 10 px and a pillbox filter radius of 5 px to perform the blurring, the out-of-focus ratio is 50%.
Four reconstruction methods are used as follows: average reconstruction, center-point reconstruction, adjacent pixel
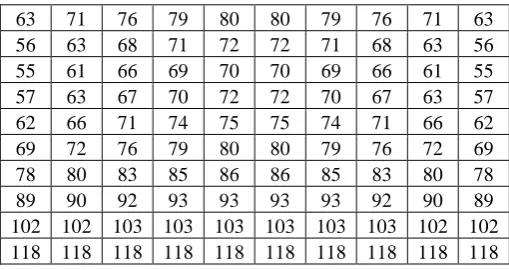
reference, and adjacent pixel–center-point reference. The module size of the QR code is 10px ×10px, as shown in Fig. 8. Before
performing the reconstruction, the pixels within the boundaries of the module are first converted to grayscale for the evaluation
for reconstruction, as shown in Table 2.
Table 2 Single bit (Module) grayscale 10px×10px
63 71 76 79 80 80 79 76 71 63 56 63 68 71 72 72 71 68 63 56 55 61 66 69 70 70 69 66 61 55 57 63 67 70 72 72 70 67 63 57 62 66 71 74 75 75 74 71 66 62 69 72 76 79 80 80 79 76 72 69 78 80 83 85 86 86 85 83 80 78 89 90 92 93 93 93 93 92 90 89 102 102 103 103 103 103 103 103 102 102 118 118 118 118 118 118 118 118 118 118
In the average reconstruction method, the average grayscale value for each corresponding boundary of the QR code
module in the diagram is obtained. The grayscale value of 127 is set as the threshold. A value greater than 127 is defined as 0-bit,
and a value less than or equal to 127 is defined as 1-bit. For example, when the average grayscale value of 80.9 is evaluated as
1-bit because it is less than 127 as shown in Table 2.
In the center-point reconstruction method, the grayscale value of the pixel at the center point for each corresponding
boundary of the QR code module in the diagram is obtained. The grayscale value of 127 is set as the threshold. A value greater
than 127 is defined as 0-bit, and a value less than or equal to 127 is defined as 1-bit. For example, the center-point grayscale
value of 75 is evaluated as 1-bit because it is less than 127 as shown in Table 2.
In the adjacent pixels reference method, the average grayscale value for each corresponding boundary of the QR code
module in the diagram is obtained. Different grayscale values are set as thresholds. A value greater than 170 is defined as 0-bit,
and a value less than or equal to 80 is defined as 1-bit. Codes with these apparent characteristics are processed first. For codes
with grayscale values between 80 to 170, the change trend of the eight boundaries of the QR code bit (Module) (top, bottom, left,
right, top left, top right, bottom left, and bottom right) in the diagram is evaluated which are. If the grayscale value from the
interior toward the exterior of the boundary shows signs of increasing, then the bit is defined as a 1-bit inclination. If four or
more boundaries indicate 1-bit inclinations, then the bit is evaluated as 1-bit. If less than four boundaries indicate 1-bit
inclinations, then the bit is evaluated as 0-bit. As shown in the Table 2, the average grayscale value is 80.9, which is not within
the apparent characteristics of boundary. Hence, the change trend of the eight -boundaries should be evaluated. Four 1-bit
inclinations are observed in the diagram. The result of the adjacent pixel reference method is 1-bit.
The adjacent pixels–center-point reference method is a minor modification of the adjacent pixel reference method. First,
the average grayscale value for each corresponding boundary of the QR code bit (module) in the diagram is obtained. Different
grayscale values are set as thresholds. A value greater than 170 is defined as 0-bit, and a value less than or equal to 80 is defined
as 1-bit. Codes with these apparent characteristics are processed first. For codes with grayscale values between 80 to 170, the
change trend of the eight boundaries of the QR code bit (module) (top, bottom, left, right, top left, top right, bottom left, and
bottom right) in the diagram is evaluated. If the grayscale value from the interior toward the exterior of the boundary shows
signs of increasing, the bit is defined as a 1-bit inclination. If six or more boundaries show 1-bit inclinations, the bit is evaluated
as 1-bit. If only two or less boundaries show 1-bit inclination, the bit is evaluated as 0-bit. If three to five boundaries exhibit 1-bit
inclinations, the center-point reconstruction method is used to evaluate the bit value. As shown in the Table 2, the average
grayscale value is 80.9, which is not within the apparent characteristics boundary. Therefore, the change trend of the eight
boundaries is evaluated. Four 1-bit inclinations are observed in the diagram, which is within the range of 3 to 5. The result of the
3.1. Assessing the advantages and disadvantages of the reconstruction methods
The experimentation shows that the adjacent pixel center-point reference method, which is a consolidation of the other
three methods (average reconstruction, center-point reconstruction, and adjacent pixel reference methods), is the best
reconstruction method. Below is an assessment of the advantages and disadvantages of the three reconstruction methods.
Although the average reconstruction method shows the highest percentage of errors after reconstruction, this
reconstruction method can still be used for initial evaluation of the more apparent 1- or 0-bits of the out-of-focus QR code.
In the center-point reconstruction method, the decoding success rate is higher than that of the more adjacent pixel
reference method when reconstructing a QR code with blurriness ratio of 80%. However, when the blurriness ratio is higher than
80%, the reconstruction error rapidly increases.
The adjacent pixels reference method enhances the reconstruction ability of the less apparent 1- or 0-bit characteristics
during the average reconstruction method of a blurry QR code image. Therefore, for less apparent characteristics, this method is
more suitable for the evaluation of the trend changes of the eight boundaries, thereby improving the accuracy of the
reconstruction.
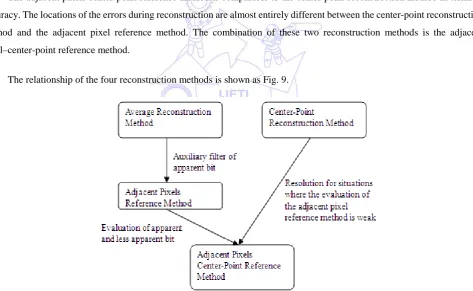
The adjacent pixels center-point reference method is comparable to the center-point reconstruction method in terms of
accuracy. The locations of the errors during reconstruction are almost entirely different between the center-point reconstruction
method and the adjacent pixel reference method. The combination of these two reconstruction methods is the adjacent
pixel–center-point reference method.
The relationship of the four reconstruction methods is shown as Fig. 9.
Fig. 9 Relationship among the four reconstruction methods
4.
Experiment Results and Analysis
A set of 10%~90% out-of-focus QR code pictures produce using a correct and clear QR code picture. The Pillbox filter
Fig. 10 Blurriness ratio of 10% QR Fig. 11 Blurriness ratio of 20% QR
Fig. 12 Blurriness ratio of 30% QR Fig. 13 Blurriness ratio of 40% QR
Fig. 14 Blurriness ratio of 50% QR Fig. 15 Blurriness ratio of 60% QR
Fig. 16 Blurriness ratio of 70% QR Fig. 17 Blurriness ratio of 80% QR
The purpose of this paper enhance QR CODE identification rate comparing the four reconstruction methods when the QR
code is out-of-focus and blur. The four methods are the average reconstruction method, the center-point reconstruction method,
the adjacent pixels reference method, and the adjacent pixels–center-point reference method. Among these methods, the
adjacent pixels–center-point reference method is better than others. Table3 to Table 5 are shown the reconstruction
effectiveness for 3 different blurriness ratios.
Table 3 Reconstruction effectiveness for blurriness ratio of 70%
The average reconstruction method
The center-point reconstruction method
The adjacent pixels reference method
The adjacent pixels–center-point
reference method
Experimental pictures 300pictures 300pictures 300pictures 300pictures
Average Codeword error rate for each QR
code picture
4.05% 0.00% 0.00% 0.00%
Decoding success rate 100.00% 100.00% 100.00% 100.00%
Table 4 Reconstruction effectiveness for blurriness ratio of 80%
The average reconstruction method
The center-point reconstruction method
The adjacent pixels reference method
The adjacent pixels–center-point
reference method
Experimental pictures 300pictures 300pictures 300pictures 300pictures
Average Codeword error rate for each QR
code picture
39.77% 7.39% 4.76% 0.00%
Decoding success rate 5.33% 100.00% 100.00% 100.00%
Table 5 Reconstruction effectiveness for blurriness ratio of 90%
The average reconstruction method
The center-point reconstruction method
The adjacent pixels reference method
The adjacent pixels–center-point
reference method
Experimental pictures 300pictures 300pictures 300pictures 300pictures
Average Codeword error rate for each QR
code picture
47.04% 36.41% 65.14% 28.56%
Decoding success rate 0.00% 1.00% 0.00% 33.33%
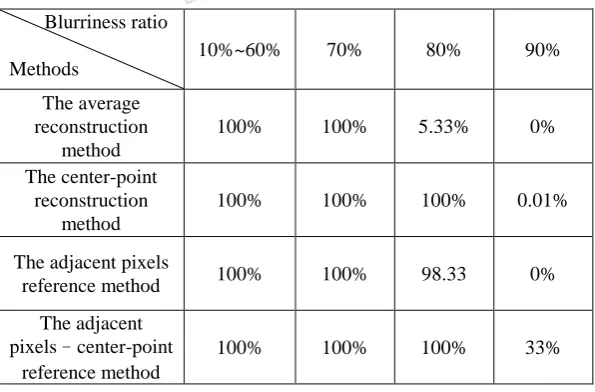
Also, the comparison of all reconstruction decoding success rate is shown in Table 6.
Table 6 Comparison of all reconstruction decoding success rate
Blurriness ratio
Methods
10%~60% 70% 80% 90%
The average reconstruction
method
100% 100% 5.33% 0%
The center-point reconstruction
method
100% 100% 100% 0.01%
The adjacent pixels
reference method 100% 100% 98.33 0%
The adjacent pixels–center-point
reference method
The conclusions on the blurriness ratios and effectiveness of the reconstruction methods are as follows:
(i) Effectiveness of the different blurriness ratios
(a) Images with ratios under 60% can be fully reconstructed into correct QR code diagrams.
(b) The number of modules cannot be reconstructed increases with the increase in blurriness ratio.
(c) After reconstruction, the decoding success rate decreases with the increase in blurriness ratio.
(ii) Effectiveness of the different reconstruction methods
(a) The average reconstruction method is the most ineffective among the four methods and is only suitable for obtaining apparent characteristics.
(b) The result of the center-point reconstruction method is satisfactory.
(c) The result of the adjacent pixels reference method is also satisfactory.
(d) The adjacent pixels–center-point reference method produces the best result.
5.
Conclusions
When using an image-capturing device to obtain the QR code, many factors generally affect the degradation of image
quality, such as blurriness caused by the trembling of the hands, severe distortion caused by the angle of shot, and loss of
authenticity due to the different environments. Examples of these include QR codes that are added to the external packaging of
the product, which suffer from various distortions caused by the packaging material. The image restorations for these images are
being studied by other researchers.
This paper focuses on out-of-focus QR codes and aims to find the best reconstruction method, which may be used as a
reference for future research on the quality of QR code images.
References
[1]C. W. Chiang, “The Application of QR Code to Indoor Cross-Floor Automatic Route Planning,” Master Thesis, Dept. Computer Science and Engineering, Tatung University, 2009.
[2]J. F. Weng, “The Study of RSA Algorithm on QR CODE Design, Master Thesis,” Dept. Computer Science and Engineering, Tatung University, 2008.
[3]C. H. Lin, F. Y. Tsai, W. L. Tsai, H. W. Wen, and M. L. Hu., “The feasibility of QR-code prescription in Taiwan,” Journal of Clinical Pharmacy and Therapeutics, May 2012.
[4]C. C. Lin, “A General Scheme for QR-code Image Denoising on the Camera Phone,” Master Thesis, Dept. Communication Engineering, National Taiwan University, 2009.
[5]Espejel-Trujillo A., Castillo-Camacho I., Nakano-Miyatake M., Perez-Meana H., “Identity Document Authentication Based on VSS and QR Codes,” Procedia Technology, vol. 3, pp. 241-250, 2012.
[6]F. C. Chen, “Designing Personalized Mobile Shopping System for Cell Phones by QR Code,” Master Thesis, Dept. Computer Science and Engineering, Tatung University, 2007.
[7]J. F. Weng, “The Study of RSA Algorithm on QR Code Design, Master Thesis,” Dept. Computer Science and Engineering, Tatung University, 2008.
[8]W. H. Lee, “A Novel User Authentication Scheme Based on QR-Code, Master Thesis,” Dept. Applied Informatics and Multimedia, Asia University, Taiwan, 2010.
[9]C. Y. Lai, “Extracting QR CODE from a on-uniform Background Image in Embedded Mobile Phones,” Master Thesis, Dept. Networking and Multimedia, National Taiwan University, 2007.
[11] Y. L. Pan, “Extracting 2D Barcodes from Images with Spatial Distortion,” Master Thesis, Dept. Networking and
Multimedia, National Taiwan University, 2008.
[12] Tor Helleseth, “Legendre sums and codes related to QR Codes,” Discrete Applied Mathematics, vol. 35, pp. 107-113, January 1992.
[13] ISO/IEC 18004:2000. Information technology-Automatic identification and data capture techniques-Bar code
Symbology-QR CODE, 2000.
[14] J. Biemond, R. L. Lagendijk, and R. M. Mersereau, “Iterative methods for image deblurring,” Proc. IEEE, vol. 78, May 1990, pp. 856-883,.
[15] C. H. Chiu, “Automatic Ringing Artifact Detection in Restoring Blurred Face Images,” Master Thesis, Dept. Applied