SHIV SHAKTI
International Journal in Multidisciplinary and Academic
Research (SSIJMAR)
Vol. 6, No. 4, August 2017 (ISSN 2278 – 5973)
Morphometric Analysis of Upper Part of Betwa River Watershed Using Remote
Sensing and Geographical Information System
1
Shobharam Ahirwar, 2J.P.Shukla
1
Research Scholar, 2Principal Scientist,CSIR-Advanced Materials and Processes Research Institute, Bhopal (M.P.) - 462026
Corresponding author email: [email protected]
Impact Factor = 3.133 (Scientific Journal Impact Factor Value for 2012 by Inno Space Scientific Journal
Impact Factor)
Global Impact Factor (2013)= 0.326 (By GIF)
Indexing:
Abstract
In the study morphmetric analysis of upper Betwa river watershed has been carried out. Drainage map of the watershed have been prepared by digitizing the drainages from survey of India (SOI) toposheets No. 55 E/8, 12, 55 F/5, 9 of scale 1:50,000 to determine drainage characteristics. The watershed is exhibiting dendritic drainage pattern. The drainage density of the study area varies from 1.05 to 2.35 km/km2. Bifurcation ratio varies from 2.88-4.90 and the elongation ratio vary from 0.15-1. The watershed has been divided in to 6 sub-watersheds. The results of mrphometric analysis reveals that sub-watershed 4 have lower drainage density (1.05) and Stream Frequency (0.56), while sub-watershed 7 shows low value of compactness constant and sub-watershed 3 lower value of circulatory Ratio of (0.05). In sub watershed 2 Form factor is low (0.05). In relief aspects lower relief was seen in sub-watershed 2 and the higher in sub sub-watershed 1. Morphometric analysis characterizes the drainage characteristics of a watershed basin and it helps in understanding the hydrological behavior of the Watershed.
Introduction
Water is one of the essential substances for sustenance of life. All living beings are depending on water, without water no life exists on the earth. Our Earth contains plentiful water resources, but most of it is unfit for living beings use and consumption. The study of the watershed morphometric analysis provides the useful parameters for the assessment of the ground water potential zones, identification of sites for water harvesting structures, water resource management, runoff and geographic characteristics of the drainage system. Morphometry is the measurement and mathematical analysis of the configuration of the earth's surface, shape, dimension of its landforms (Clarke, 1966). The Morphometric analysis consists of linear, Aerial and relief aspects. Morphometric analysis is refers as the quantitative evaluation of form characteristic of the earth surface and any landform unit. This is the most common technique used in basin analysis. The composition of the stream system of a drainage basin in expressed quantitatively with stream order, drainage density, bifurcation ration and stream length ratio (Horton, 1945). It incorporates quantitative study of the various components such as, stream segments, basin length, basin parameters, basin area, altitude, volume, slope, profiles of the land which indicates the nature of development of the basin.
Study area:
The area taken under investigation comprises of upper parts of Betwa River with geographical area of 683 km2. The study area falls in survey of India (SOI) toposheet No. 55 E/8, 12, 55 F/5, 9 and lies between 22° 51' to 23° 64' North latitude and between 77° 20' to 77° 45' East longitudes. The watershed farming the upper part of Betwa river, hence it is named as upper Betwa watershed. Betwa river is originated from village Jhiri, Barkheda setu Panchayat, Raisen district, M.P. rising at an elevation of about 576 m. The watershed covering the part of Obedullahganj block of the Raisen district of M.P, which is highly industrialized and the water resources may be contaminated due to improper disposal of municipal, urban and industrial wastage.
Fig.1: Location Map of the Study area
Material and Methods
Fig.2: Contour Map of Study area
Morphometric Analysis
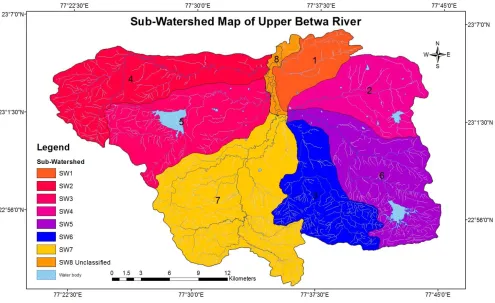
With the help of ArcGIS software possessing of morphometric analysis of watershed has been carried out. In morphometric analysis we have first divided the whole watershed into seven sub-watersheds namely as SW-1, SW-2, SW-3, SW-4, SW-5, SW-6 & SW-7 and SW-8 (Fig.3). Among these watersheds the watershed 8 is unclassified, because of not development of drainages in this sub-watershed. The names of sub-watershed are as follows:
i. Bhojpur (SW-1) ii. Betwa River (SW-2) iii. Bengana Nala (SW-3) iv. Gerwa Nala (SW-4)
Table 1: Methods of Calculating Morphometric Parameters of Drainage Watershed
Morphometric parameters
Formula Reference
Stream Order (u) Hierarchical order Strahler, 1964
Stream Length (Lu) Length of the stream Horton, 1945
Mean Stream Length(Lsm)
Lsm= Lu/Nu
Where, Lsm= Mean stream length Lu= Total stream length of Order u
Nu= Total number of stream segment of order u
Strahler, 1964
Bifurcation ratio (Rb) Rb= Nu/Nu+1
Where, Rb= Bifurcation Ratio
Nu= Total number of stream segment of order
u Nu+1= Number of stream segment of next higher order
Schumn, 1956
Mean Bifurcation ratio (Rbm)
Rbm= average of bifurcation ratio of all orders Strahler, 1964
Basin length (Lb) Lb= 1.312*A0.568
Where,Lb= length of basin (km),A= area of Basin (km2)
Nookaratnam et.al, 2005
Drainage Density (Dd)
Dd= Lu/A
Where, Dd= Drainage density
Lu= Total stream length of all order,A= Area of the basin
Horton, 1945
Stream Frequency (Fs)
Fs= Nu/A
Where, Nu= Total number of stream of all order A= Area of the basin (km2)
Texture Ratio (T) T= Nu/P
Where, Nu= Total number of stream of all order P= Perimeter (km)
Horton, 1945
Form Factor (Rf) Rf= A/Lb2
Where, Rf= Form factor
A= area of the basin (km2),Lb2= Square of the basin length
Horton, 1945
Circulatory Ratio (Rc) Rc= 4πA/P2
Where, Rc= Circularity ratio,A= Area of the basin (km2) P= Perimeter (km), π=3.14
Miller, 1953
Elongation Ratio (Re) Re= (2/Lb)*(A/π)0.5
Where, Re= Elongation Ratio,Lb= length of basin (km) A= Area of the basin (km2), π=3.14
Schumn, 1956
Compactness Constant (Cc)
Cc= 0.2821P/A0.5
Where,Cc= Compactness Ratio,A= Area of the basin (km2), P= Perimeter of the basin (km)
Horton, 1945
Basin relief (Bh) Vertical distance between the lowest and highest points of watershed.
Schumn, 1956
Relief ratio (Rh) Rh=Bh/Lb; Where, Bh=Basin relief;Lb=Basin length Schumn,1956
Ruggedness number (Rn)
Rn= Bh × Dd Where, Bh =Basin relief; Dd=Drainage density Schumn, 1956
Results and Discussion
With the help of the standard formulas various morphometric parameters of the Upper Betwa Watershed were determined and are summarized in Tables 2.
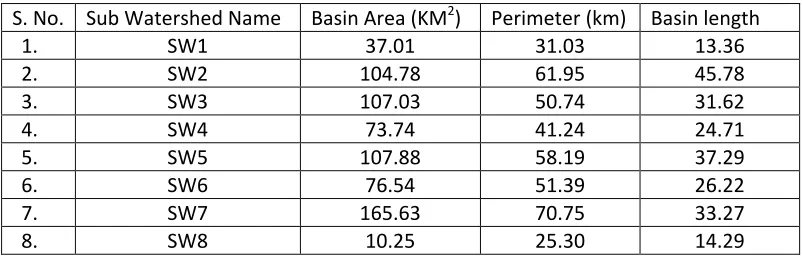
Table 2: Basic Parameter of the Upper Betwa River Watershed Catchment
S. No. Sub Watershed Name Basin Area (KM2) Perimeter (km) Basin length
1. SW1 37.01 31.03 13.36
2. SW2 104.78 61.95 45.78
3. SW3 107.03 50.74 31.62
4. SW4 73.74 41.24 24.71
5. SW5 107.88 58.19 37.29
6. SW6 76.54 51.39 26.22
7. SW7 165.63 70.75 33.27
8. SW8 10.25 25.30 14.29
Linear Aspects
The linear aspects include the stream order (u) stream number, stream length and bifurcation ratio (Rb) was determined and results are presented in Table 3.
11.2.4. 2. Stream Order (u)
first order stream. When two stream of first order join an order 2nd stream is created and so on. The watershed contains six order streams are Sub-watershed (SW8 & SW7) and streams of Fifth order is seen SW5, SW6 and SW7 and fourth order of streams is seen in (SW1, SW2, SW3,SW4,SW5,SW6 and SW7).
Fig.4: Drainage Map of Upper Betwa River Basin
Stream Number
Stream number represents the stream segment of various orders and is inversely proportional to the stream order. In our analysis the number of the stream segments decreases with increasing stream orders. The densely streams are indicating impermeable formations and less infiltration. It is predicted from the results shown in Table 4 that the maximum frequency is in case of first order streams. It is also noticed in the watershed, decreasing of stream frequency as the stream order increases.
Stream Length (Lu)
Table 3:
linear aspects
of
watershed
Sub Watershed Stream Order Mean
Bifurcation Ratio (Rb)
I II III IV V VI Sub Watershed-1
No. of Stream 22 4 2 - - - 3.75
Stream Length (km) 13.03 15.58 10.02 - - -
Sub Watershed-2
No. of Stream 107 27 4 1 - - 4.90
Stream Length 94.82 28.63 20.99 40.19 - -
Sub Watershed-3
No. of Stream 93 22 5 2 - - 3.71
Stream Length 79.37 27.82 26.62 20.41 - -
Sub Watershed-4
No. of Stream 30 9 1 1 - - 4.44
Stream Length 38.77 21.29 8.10 8.94 - -
Sub Watershed-5
No. of Stream 197 41 8 3 1 - 3.90
Stream Length 121.89 44.08 17.46 17.039 14.46 -
Bifurcation Ratio (Rb)
It is the ratio of the number of streams of given order u to the number of streams of higher order u+1. The value of Rb is also indicative of shape of the basin. An elongated basin is likely to have high Rb,
where as a circular basin is likely to have a low Rb. It is observed from our results showing the Table 3,
the Bifurcation ratio varies from one sub watershed to other sub watershed. The mean bifurcation ratio (Rb) varies from 2.88 to 4.90.
Areal Aspects
Area of a basin (A) and perimeter (P) are the important parameters in quantitative geomorphology. The area of the basin is defined as the total area projected upon a horizontal plane. Perimeter is defined as the length of the boundary of the basin. Also the areal aspects include different morphometric parameters, like drainage density (Dd), stream frequency (Fs), form factor (Rf), circulatory ratio (Rc)
and elongation ratio (Re). The values of these parameters were calculated during the study and the
results are given in Table 4.
Drainage Density (Dd)
No. of Stream 146 31 5 1 1 - 4.22
Stream Length 94.49 40.86 22.83 18.67 3.26 -
Sub Watershed-7
No. of Stream 315 72 17 6 3 1 2.88
Drainage density is one of the important indicators of the linear scale of land form in stream eroded topography. Drainage density is defined as the ratio of total length of the streams of all order of watershed to the total area of watershed. Drainage density also gives an idea of the physical properties of the underlying rocks of watershed. Drainage density of watershed varies between 1.05 to 2.32 and is indicating low drainage density (Table-3). According to Nag (1998), low drainage density generally results in the areas of highly resistant on permeable subsoil material, dense vegetation, low relief and coarse drainage texture. High drainage density is resultant of weak or impermeable subsurface material, sparse vegetation, mountainous relief and fine drainage texture.
Stream frequency /Drainage Frequency (Fs)
Stream frequency is the number of streams per unit area of the basin. It mainly depends upon the lithology of the basin and reflects the texture of the drainage network. In the watershed low value 0.56 observed in sub watershed 4 while high value of 3.27 in sub watershed 5.
Form Factor (Rf)
It is the ratio of basin area A, to the square of maximum length of the basin Lb. It is dimensionless
property and is use as a quantitative expression of the shape of basin form. In the watershed lower values of form factor are observed in sub watershed 2 & 1.
Circulatory Ratio (Rc)
It is the ratio of the watershed area and the area of circle of watershed perimeter (Pr). Values of
circulatory ratio of all sub watersheds are presented in Table 4. The sub-watershed-3 is showing minimum value of 0.05, while sub-watershed-4 has maximum value 0.54.
Elongation Ratio (Re)
It is defined as the ratio between the diameter of a circle with the same area that of the basin to the maximum length of the basin. The elongation ratio ranges from 0.15 to 0.31 in the watershed. The lowest values of 0.15 (sub-watershed-2) and highest value of 0.31 (sub-watershed-1) indicate high relief and steep slopes.
Table.4: Areal Aspect of Upper Betwa River Watershed
Sub-Water
shed
Drainage Density
(Dd)
Stream Frequency
(Fs)
Circulatory Ratio (Rc)
Form Factor
(Rf)
Elongation Ratio (Re)
Texture Ratio
(T)
Compactne ss Constant
(Cc)
1. 1.27 0.76 0.48 0.21 0.31 0.90 0.26
2. 1.35 1.33 0.34 0.05 0.15 2.24 0.22
3. 1.16 1.14 0.05 0.11 0.19 2.40 0.19
4. 1.05 0.56 0.54 0.12 0.22 0.99 0.21
5. 2.01 3.27 0.40 0.08 0.17 4.30 0.21
6. 2.32 2.40 0.36 0.11 0.23 3.58 0.23
7. 2.24 2.49 0.42 0.15 0.20 5.85 0.18
Relief aspects of drainage basin relate to the three dimensional features of the basin involving area, volume and altitude of vertical dimension of landforms wherein different morphometric methods were used to analyze terrain characteristics. In this study, the relief aspect determined includes the analysis of average slope, relative reliefs, etc.
Relief Ratio (Rh)
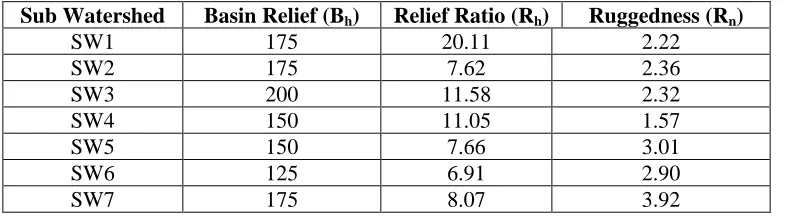
The relief ratio is the ratio of maximum relief to horizontal distance along the longest dimension of the basin parallel to the principal drainage line is termed as relief ratio (Schumm, 1956). In our watershed the values of relief ratio vary from 6.91-11.58 shown in table 5.
Ruggedness number (Rn)
It is the product of maximum basin relief (Bh) and drainage density (Dd), where both parameters are in
the same unit. An extreme high value of ruggedness number occurs when both variables are large and slope is not only steep, but long as well (Strahler, 1956). Ruggedness of the watershed varies from 1.57-3.92 shown in table 5. Thus the water basin is moderately rugged.
Table 5: Relief Aspect of the Upper Betwa River Watershed
Sub Watershed Basin Relief (Bh) Relief Ratio (Rh) Ruggedness (Rn)
SW1 175 20.11 2.22
SW2 175 7.62 2.36
SW3 200 11.58 2.32 SW4 150 11.05 1.57
SW5 150 7.66 3.01
SW6 125 6.91 2.90
SW7 175 8.07 3.92
Discussion:
In the study, morphometric analysis of upper Betwa watershed has been done using satellite imagery and topographic maps on scale map of 1:50,000. Analyzing the morphmetric parameters the drainage characteristics of the watershed basin has been predicted. Morphometric study is very beneficial for the evaluation of the water resources of a region, identification of sites for water harvesting structures, runoff and geographic characteristics of the drainage system. Morphometery is the measurement and mathematical analysis of the configuration of the earth’s surface, shape, dimension of its landforms viz; stream order (u), stream length (Lu), Bifurcation ratio (Rb), Basin length (Lb),
References
Agarwal, C.S. (1998), Study of drainage pattern through aerial data in Naugarh area of Varanasi district, U.P, Journal of Indian Society of Remote Sensing, 26, 169-175.
ArcGIS, GIS software, version 9.2 (2006), Environmental Systems Research Institute (ESRI), New York.
Biswas, S., Sudhakar, S., and Desai, V.R. (1999), Prioritisation of sub-watersheds based on Morphometric analysis of drainage basin-a remote sensing and GIS approach, Journal of Indian Society of Remote Sensing, 27,155-166.
Chorley, R.J., Donald, E.G., Malm. and Pogorzelski, H.A. (1957), A new standard for estimating drainage basin shape, American Journal Science, 225, 138-141.
Chow, V.T. (1964), Handbook of Applied Hydrology. McGraw-Hill, New York,.
Das, A. K. Mukherjee, Saumitra (2005), Drainage morphometry satellite data and GIS in Raigad District, Maharashtra, Journal of Geological Society of India, 65, 577-586.
ERDAS IMAGINE, (2008), Digital Image Processing Software, Version 9.2, Leica Geosystems & GIS Mapping, Atlanta, U.S.A.
Gajbhiye, S., Mishra, S.K. (2012), Application of NRSC-SCS Curve Number Model in Runoff Estimation Using RS & GIS, IEEE-International Conference on Advances in Engineering Science and Management (ICAESM -2012) March 30-31, pp 346-352.
Gajbhiye, S., Mishra, S.K., andey, A. (2013a), Prioritization of Shakkar River catchment through Morphometric Analysis using Remote Sensing and GIS techniques. Journal of Emerging Technology in Mechanical Science and Engineering, 4(2), 129-142.
Gajbhiye, S., Mishra, S.K. and Pandey, A. (2013b), Effect of seasonal/monthly variation on runoff Curve Number for selected watersheds of Narmada Basin. International Journal of Environmental Sciences, 3(6), 2019-2030.
Gajbhiye, S., Mishra, S.K. and Pandey, A. (2013c), Prioritizing erosion-prone area through morphometric analysis: an RS and GIS perspective. Applied Water Science, 4(1), 51-61.
Gajbhiye, S., Mishra, S.K. and Pandey, A. (2014c), Hypsometric Analysis of Shakkar River Catchment through Geographical Information System. Journal of the Geological Society of India, 84, 192-196.
Gajbhiye, S., Sharma, S.K. and Meshram, C. (2014d), Prioritization of Watershed through Sediment Yield Index Using RS and GIS Approach. International Journal of u- and e- Service, Science and Technology, 7(6), 47-60.
Horton, R.E. (1932), Drainage basin characteristics, Transactions of American Geophysical Association, 13, 350-361.
Horton, R.E. (1945), Erosional development of streams and their drainage basins: Hydrophysical approach to quantitative morphology, Geological society of America Bulletin, 5, 275-370.
Jensen, J.R. (2006), Remote Sensing of the Environment, Dorling Kindersley (India) Pvt. Ltd., New Delhi, 1st edition.
Langbein, W.B. (1947), Topographic characteristics of drainage basins, U.S. Geol. Survey, Water-Supply paper, 986(C), 157-159.
Miller, V.C. (1953), A quantitative geomorphic study of drainage basin characteristics in the Clinch Mountain area, Varginia and Tennessee, Project NR 389042, Tech. Rept.3., Columbia University, Department of Geology, ONR, Geography Branch, New York.
Mishra, S.K., Gajbhiye, S., Pandey, A. (2013), Estimation of design runoff curve numbers for Narmada watersheds (India), Journal of Applied Water Engineering and Research, 1(1), 69-79. Nag, S.K. (1998), Morphometric analysis using remote sensing techniques in the Chaka sub-basin Purulia district, West Bengal, Journal of Indian Society of Remote Sensing, 26, 69-76.
Gajbhiye, S. (2015). Morphometric Analysis of a Shakkar River Catchment Using RS and GIS, 8(2), 11–24.