http://www.sciencepublishinggroup.com/j/mcs doi: 10.11648/j.mcs.20170206.15
ISSN: 2575-6036 (Print); ISSN: 2575-6028 (Online)
Analysis of the First Cracks Generating Between Two
Holes Under Incremental Static Loading with an Innovation
Method by Numerical Modelling
Shobeir Arshadnejad
Department of Mining Engineering, Islamic Azad University, Mahallat Branch, Iran
Email address:
To cite this article:
Shobeir Arshadnejad. Analysis of the First Cracks Generating Between Two Holes Under Incremental Static Loading with an Innovation Method by Numerical Modelling. Mathematics and Computer Science. Vol. 2, No. 6, 2017, pp. 120-129. doi: 10.11648/j.mcs.20170206.15
Received: June 8, 2017; Accepted: October 23, 2017; Published: December 3, 2017
Abstract:
The application of Non-Explosive Expansion Materials (NEEM) has recently been increased in hard rock quarry mining, especially in granitic rocks. The most important mention in the quarry mining methods is determination of hole pattern, because it relates to cost of exploitation of the rock blocks, directly. It needs to predict the rock fracture process which it depends on the length of the first cracks and the growing to join together. A new algorithm has been suggested to evaluate of the first crack length by the linear elastic fracture mechanics (LEFM) theory. It requires determining a stress concentration factor which an experimental model has been utilized. A case study has been selected to verify of the numerical results which it is a granite mine in Iran. Numerical modeling has been applied to illustrate of rock fracture process and crack path and the results showed if the size of elements near the crack tip equal to grain size of the rock material or the ratio of the element length per diameter of the hole is selected about one per fifty, accuracy of the crack path prediction can be acceptable. On the other hand selection of an adequate rock slip criterion for crack planes is important, because of friction between two planes of a crack, plays an important role to predict of the crack growth. Also this research showed that Mohr-Coulomb criterion without cohesion is a suitable model for crack’s elements and Hoek-Brown failure criterion is an adequate model for rock substance.Keywords: Finite Element Method, Stress Concentration, Crack Growth, Rock, Hole
1. Introduction
One of the main methods in quarry mining, especially in hard rocks, is the controlled fracture method that is carried out by the introduction of a slowly advancing crack by Non-Explosive Expansion Material (NEEM). The application of NEEM in hard rock quarry mining has recently been increased [2, 14, 32]. The method of rock breakage is without noise and vibrations and its operation, compared to blasting method, is more controllable, very safe and easy and without extra undesirable cracks in the rock block.
In this method, some circular holes are drilled closely with equal length, diameter and spacing (center-to-center distance) in a rock block. Subsequently, the holes are filled by the NEEM, which it can be expanded and generates an incremental static load into the holes after about two to four hours [12, 22]. If the spacing of the holes to be adequate, it will create a crack between two neighboring holes, and the
rock will fracture along the high-stress concentration path between the holes. If the material of the medium to be brittle such as hard rocks (e. g. granite and quartzite) it can be neglected the yield point and a little plastic behavior before failure of the material [16, 25-26]. Thus, the material can be considered to behave in a linear elastic mode until onset of the failure.
2. Experimental Data and a Case Study
A granite quarry mine was selected as a case study entitled “Ahrar” which it has located near to Natanz in Iran (Figure 1). Some laboratory tests have been done on the granite specimens for measuring of some rock mechanics’ properties such as uniaxial compressive strength, Brazilian tensile strength, Young’s modulus, Poisson’s ratio, specific gravity and fracture toughness. Process of rock fracture by the NEEM has been shown in figures 1 and 2. The drill holes were 38 mm and the average of the hole’s spacing was 12 cm in the mine.
(a) Drilling of a rock block.
(b) Pouring of the NEEM into the holes.
Figure 1. Drilling of a rock block in the granite mine.
(a) Crack generating after 15 hours.
(b) Crack openning after one day.
Figure 2. Process of rock fracture by the NEEM after 24 hours.
Uniaxial compressive strength and Brazilian tensile strength, Young’s modulus, Poisson’s ratio, specific gravity and fracture toughness [7] of the rock have been done under ISRM standard methods. There is a summary of the results in table 1.
Table 1. Mechanical properties of the granite.
Paramters MPa MPa GPa / √
Ave. value 131.6 7.2 70.6 0.25 26.4 1.3 Standard dev. 3.2 0.42 2.3 0.011 0.31 0.08
3. Stress Distribution Around the Holes
When there are two neighboring holes in a plate loaded internally, stress concentration will occur between the holes. The maximum elastic stresses (stress concentration) were examined by several methods, such as photoelastic analysis
in bipolar coordinates in an infinite plate with two circular holes has been done by Jeffrey [23]. Howland [19] investigated the stress distribution around an infinite row of equal size circular holes spaced equally in an infinite elastic plate. The plate had subjected to a uniaxial stress field. Howland and Knight [20] presented stress functions for the problem involving equal size circular holes. Ling [27] developed a solution (in bipolar coordinates) for the stresses in a plate containing two equal circular holes when variable are distance between them. He considered three stress fields: uniaxial stress parallel and perpendicular to the line of hole’s centers and equal stresses in all directions [10]. Haddon [13] presented a solution for stresses around two unequal circular holes in an infinite plate by using of the conformal mapping and complex variable techniques. The plate was subjected to a uniaxial stress field with a variable inclination to the line of holes centers [10]. Obert and Duvall [31] have studied the stress distribution around pillars (rock columns) between two parallel circular excavations subjected to uniaxial compressive external loading by photoelasticity method. If the type of external loading is tensile in biaxial, two empirical models were developed by Schulz [34] and Peterson [33]. Ling and Tsai [28] presented an analytical solution for the stress distribution in a thick plate of infinite size containing a spherical inclusion or cavity eccentrically located between the surfaces. The plate had subjected to a stress system symmetrical about the axis of revolution of the plate while the surfaces were stress-free. Gerçek [8-9] presented a solution for boundary stresses for two parallel circular tunnels located in a biaxial in situ stress field. It was obtained by superposing the solutions developed by Ling [27]. Zimmerman [40-41] suggested approximate equations for stress concentrations in an infinite elastic plate containing two circular holes. Arshadnejad and his colleagues [1] suggested two empirical models to determine of stress concentration factors (tangential and radial stresses) between two neighboring holes by numerical modeling. Tangential stress distribution between two holes can be calculated by equation 1 and the stress concentration factor in the equation can be evaluated by relation 2.
. (1)
1.1715 ! ".# $%&"." ' (2)
Where σθ is the tangential stress, Cθ is the stress concentration factor, r is the radial distance of the considered point from the hole center, d is the diameter of holes (m)and S is the edge-to-edge distance between two neighboring holes (hole spacing) (m),
υ
is Poisson’s ratio of rock, P is the internal pressure of the hole (pressure of the NEEM) (MPa). There is an experimental model for evaluation of NEEM’s pressure which it has been developed by some experimental measurements based on a usual type of the NEEM [11]. Determination of the internal pressure and stress concentration is necessary to calculate of the first crack length and its location.4. Birth of the First Crack
Internal pressure of a hole can be divided to two components which they are tangential and radial stresses in the rock block. The tangential component is a tensile stress and the radial component is a compressive stress. If the tangential stress obtains a value equal to tensile strength of the rock, first cracks will be born on the line passing through the center of the holes in both sides of the holes. The process can be repeated by the time and also with new and higher internal pressure and then each new curve shift up. Figure 3 shows a graph which it states tangential stress distribution and tensile strength as a limiter value in different times around a hole. Each of the pressure’s value is related to a time step, for example the P1 is the pressure of the hole at the time of t1 without consideration of the tensile strength value. In fact the graph shows that the tensile strength of rock controls the internal pressure to a specified value (Pi).
Figure 3. Tangential stress and tensile strength limitation.
When there is a crack in a solid, stress intensity factor can controls the process of crack growing based on the LEFM. But evaluation of the first crack length is very important which it needs to calculate the stress intensity factor (in mode I) for this special geometry. There is an experimental relation for determining of the stress intensity factor as follow [36].
() *+,-′/. √01 (3)
Where KI is the stress intensity factor in mode I (2 1√3),
P is the internal pressure of the hole (MPa), a is the crack length (m), Fλ (S’) is a geometric function, 4 is a parameter
of normalized thickness of the plate, S’ is a parameter of normalized crack length, R is the radius of the hole (m) and t’ is the thickness of the plate (m) which it is considered one meter, usually.
*+,-′/ ,1 5 4/*",-6/ 7 4*#,-6/ (4)
*" ,1 5 -6/80.637 7 0.485,1 5 -6/ 7 0.4-6 ,1 5 -6/> (5)
*# 1 7 ,1 5 -6/80.5 7 0.743,1 5 -6/ > (6)
-6 ?
@A? (7)
4 [email protected]? D (8)
Relation 3 can be rewritten in a new form for calculating of the crack length. But it is clear that there is parameter a in both sides of the equation, then it needs to solve by a close loop such as a flowchart which has been shown in figure 5 (a’ is the calculated value of a in each step).
Figure 5. Flowchart for calculating of the crack length.
1 E# FGH
IJ,!D/KL (9)
Where KIC is the maximum stress intensity factor or
fracture toughness of the rock (2 1√3), Pi is the minimum
pressure of the hole which it needs to generate the first crack. Therefore the tangential stress on edge of the hole has to equal to the tensile strength of the rock ( C). The parameter can be calculated by apply of the stress concentration factor (relation 2).
M. C (10)
M 0.854 C !
&".# $
%"." ' (11)
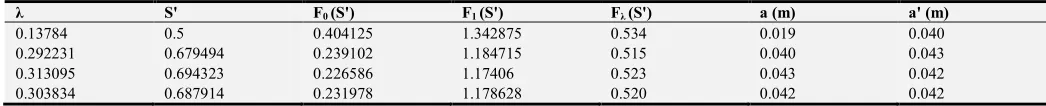
Therefore length of the first crack has been calculated with using of the flowchart by the relations and the results are in table 2. The minimum pressure of the hole which it needs to generate the first crack in this case was 6.85 MPa based on the data from table 1 and relation 11. The crack length is 42 mm and it is close to result of numerical modeling and experimental data from the mine.
Determination of the crack growth process can be done after calculation of the first crack length and its location (Primary cracks). The process of crack growing is important to ensure of joining the two neighboring cracks and making a uniform fractured surface between the two holes.
Table 2. Calculation of the first crack length.
λ S' F0 (S') F1 (S') Fλ (S') a (m) a' (m) 0.13784 0.5 0.404125 1.342875 0.534 0.019 0.040 0.292231 0.679494 0.239102 1.184715 0.515 0.040 0.043 0.313095 0.694323 0.226586 1.17406 0.523 0.043 0.042 0.303834 0.687914 0.231978 1.178628 0.520 0.042 0.042
5. Crack Growth by Numerical Modeling
When there are two primary cracks between the two neighboring holes, the LEFM can be applied to analyze of the process. Then if the stress intensity factor is equal to the rock fracture toughness, cracks can be grown. Subsequently, the crack will grow however as the crack length increases, the stresses on the crack tip decreases, due to distancing from the hole, thus decreases the stress concentration.
Nevertheless, by increasing the stress induced from the hole due to application of NEEM, in due time, the stress intensity on the crack tip will again increase up to the level of rock fracture toughness. Thus, again the crack will grow farther and this cycle of events will repeat until the maximum pressure of the NEEM.
and the model geometry and the parameters were selected based on real conditions of the case study. Stress analysis for predicting of crack propagation can be carried out using available numerical method software. The crack has been modeled by a discontinuity element (no-tension) within an isoparametric six-node triangular FEM mesh. Mohr-Coulomb criterion was selected for predicting of mechanical behavior of the crack planes without cohesion (c = 0) and at 30 degrees friction angle. Mesh density on crack tip and its around is higher than other points which they are located far from crack and crack tip. Experience in this research shows that the average length of the elements at the crack tip need to be less than one third of each part of discontinuity element’s length. Last version of Hoek-Brown criterion [17] has been employed for evaluating of behavior of the rock at
failure point and the internal loads have been increased incrementally for each model. Rock condition has been considered as an intact rock, because there was not any natural joints and discontinuities between and around of each holes. Consequently, the second constant of the Hoek-Brown criterion was one (s = 1).
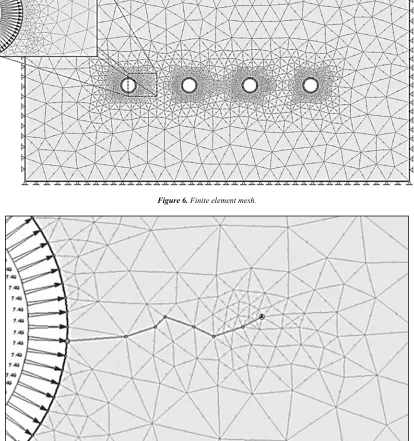
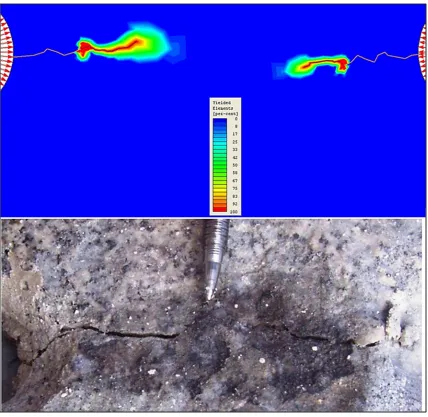
At each stage the crack was extended according to the size of failure zone at vicinity of the crack tip. After that another model is made by the new extended crack length and orientation of the crack tip and increased load. Figure 6 and 7 show the finite element model and its mesh density and crack model. Figure 8 shows the first cracks due to stress concentration between two neighboring holes and figure 9 and 10 show the crack growth between the holes.
Figure 6. Finite element mesh.
Figure 8. First cracks generate by the stress concentration (Step 1).
Figure 10. Crack growth by FEM and a picture from the case study (Step 3).
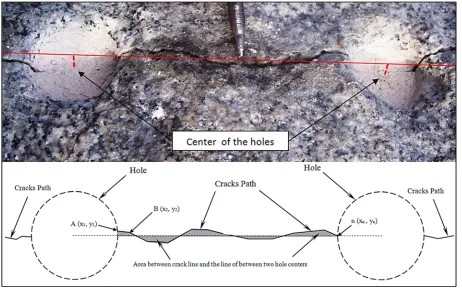
Five crack growing process have been observed in the case study and they have been mapped with more than 15 points for each one (field data). Then a spreadsheet file has been prepared for calculation of the area between the crack line and the straight line among of the two holes centers (hatched area). Relations 12 and 13 [4] have been written for
calculating the hatched area and its parameters which have been shown in figure 11. xi and yi is the Cartesian
coordinates and ABS is the Absolute value. The formula is called shoelace formula or Gauss's area formula which is a mathematical algorithm to determine the area of a simple polygon in the plane.
NOP1 0.5 Q NR-|8,T#U 7 T UV7 ⋯ 7 TX&#UX7 TXU#/ 5 ,T#UX7 TXUX ⋯ 7 T U#/>|
(12)
Figure 11. Crack path coordinates between two holes and hatched area.
Figure 12 shows the ratio of hatched area (A’) per hole’s cross section (A) versus the spacing of the holes. The figure illustrates when the hole’s spacing increases the ratio will be increased. There are two curves from the field data and the numerical modeling (FEM) in the graph and it seems this approach is a suitable for showing a quantitative comparison between crack path from numerical or theoretical result and physical fractured line. The results of finite element models were good agreement with real condition.
Figure 12. Ratio of hatched area per hole’s cross section against hole’s spacing.
A sensitive analysis of the method has been appeared that the rock fracture toughness and next the pressure of the NEEM are the most important parameters to determine of the first crack length. Also there are other sensitive parameters
d/S (0.25 to 0.50) was effected about 6 percent and it was about 3 percent for Poisson’s ratio (0.1 to 0.3) on the variation of stress concentration value. On the other hand there is a mention must be considered in sensitive analysis of rock fracture toughness and that is the parameter relates to tensile strength of the rock, concurrently [37]. It means that when the tensile strength is increased the fracture toughness will be increased and also the requirement pressure for creating the first crack will be increased and then the crack length will be decreased. Therefore variation of the fracture toughness (0.5 to 22 1√3) was effected about 7 times on increasing the pressure (2 to 13.6 MPa) and about three times on decreasing the crack length (80 to 27 mm).
6. Conclusions
Design of hole pattern in quarry mining is very important, because of it relates to cost of exploitation of the rock blocks. If two neighboring holes are enough close together, stress concentration will occur and it will cause to generation of first cracks. Length of the cracks depends to tangential stress due to pressure of the NEEM and tensile strength and fracture toughness of the rock. The results show that the suggested equation and algorithm for calculation of the first crack length had an adequate accuracy. There was a case study in a granite mine in Iran and many measurements were recorded there. Results of numerical simulations by finite element method showed that if size of elements near the crack tip equal to grain size of the rock material or the ratio of the element length per diameter of the hole is selected about one per fifty, accuracy of the crack path prediction can be acceptable. On the other hand selection of adequate slip criterion for crack planes is important. Because geometry of the crack path isn’t like to an ideal straight line and friction of the two planes of crack can be played an important role to predict of the crack growth. This research shows that Mohr-Coulomb criterion without cohesion is a suitable model for crack’s elements and Hoek-Brown failure criterion is adequate model for rock substance.
References
[1] Sh. Arshadnejad, K. Goshtasbi, J. Aghazadeh, Stress concentration analysis between two neighboring circular holes under internal pressure of a non-explosive expansion material, J. Yerbilimleri 30 (3) (2009) 259-270.
[2] Sh. Arshadnejad, A model for analysis of rock fracture in granite due to non-explosive expansion material, PhD Thesis, Azad University, Science and Research branch, Iran, 2010. [3] Z. P. Bazant, Crack band model for fracture and geomaterials,
in: Numerical Methods in Geomechanics, Edmonton (1982) 1137-1152.
[4] B. Braden, The Surveyor’s Area Formula, The College Mathematics J. 17 (4) (1986) 326-337.
[5] K. P. Chong, J. S. Harkins, D. M. Kuruppu, A. I. L. Leskinen, Strain rate dependent mechanical properties of western oil
shale, in: 28th US Symposium on Rock Mechanics (1987) 157-164.
[6] M. M. Forcht, Factors of stress concentration photoelastically determined, Transactions of ASME, Applied Mechanics (1935) A-57, A-67.
[7] R. J. Fowell, Suggested method for determining Mode I fracture toughness using cracked chevron notched Brazilian disc (CCNBD) specimens, ISRM Commission on Testing Methods, Int. J. Rock Mech. & Mining Sciences 32 (1) (1995) 57-64.
[8] H. Gerçek, Interaction of parallel tunnels or roadways, Madencilik 27 (1) (1988) 39-49.
[9] H. Gerçek, Special elastic solutions for underground openings, in: Milestones in Rock Engineering, Balkema, Rotterdam (1996) 275- 290.
[10] H. Gerçek, Interaction between parallel underground openings, in: 19th Int. Mining Cong. & Fair of Turkey, IMCEV (2005) 73-81.
[11] M. Gholinejad, Sh. Arshadnejad, An experimental approach to determine the hole-pressure under expansion load, The Southern African Inst. of Mining & Metallurgy, SAIMM 112 (2012) 631-635.
[12] K. Goto, K. Kojima, K. Watabe, The mechanism of expansive pressure and blow-out of static demolition agent, in: Demolition & Reuse of Concrete and Masonry (RILEM), Nihon University, Japan 1 (1988) 116-125.
[13] A. W. Haddon, Stresses in an infinite plate with two unequal circular holes, Quarterly J. Mech. & App. Math. 20 (1967) 277-291.
[14] H. Hayashi, K. Soeda, T. Hida, M. Kanbayashi, Non-explosive demolition agent in Japan, in: Demolition and Reuse of Concrete (RILEM), London, (1994) 231-241.
[15] E. Hoek, Z. T. Bieniawski, Application of the photoelastic coating technique to the study of the stress redistribution associated with plastic flow around notches, South African Mech. Eng. 12 (8) (1963) 22-226.
[16] E. Hoek, Z. T. Bieniawski, Brittle rock fracture propagation in rock under compression, Int. J. Fracture Mech. 1 (3) (1965) 137-155.
[17] E. Hoek, C. Carranza-Torres, B. Corkum, Hoek–Brown failure criterion – 2002 edition, in: NARMS-TAC, University of Toronto Press, (2002) 267–273.
[18] R. C. J. Howland, On the stress in the neighborhood of a circular hole in a strip under tension, Transaction of Royal Society, London, Series A (1929) 229.
[19] R. C. J. Howland, Stresses in a plate containing an infinite row of holes, Philosophy Transaction of Royal Society, Series A 148 (1935) 471-491.
[20] R. C. J. Howland, R. C. Knight, Stress functions for a plate containing groups of circular holes, Philosophy Transaction of Royal Society, Series A 238 (1939) 357-392.
[22] S. Jana, Non-explosive expanding agent – an aid for reducing environmental pollution in mines, Indian Mining & Eng. J. 1 (1991) 31-35.
[23] G. B. Jeffrey, Plane stress and plane strain in bipolar coordinates, Transaction of Royal Society, Series A 221 (1920) 265- 293.
[24] GH. D. Joussineau, J. P. Petit, B. D. M. Gauthier, Photoelastic and numerical investigation of stress distributions around fault models under biaxial compressive loading conditions, Tectonophysics 363 (2003) 19-43.
[25] E. Z. Lajtai, Effect of tensile stress gradient on brittle fracture initiation, Int. J. Rock Mech. & Mining Sci. 9 (1972) 569-578. [26] B. R. Lawn, T. R. Wilshaw, Fracture of Brittle Solids,
Cambridge University Press, 1975.
[27] Ch. B. Ling, On stresses in a plate containing two circular holes, J. App. Physics 19 (1948) 77-82.
[28] Ch. B. Ling, Ch. P., Tsai, Stresses in a thick plate containing an eccentric spherical inclusion or cavity, Part I. Acta Mechanica 7 (1969) 169-186.
[29] Ch. Lipson, R. Juvinall, Handbook of Stress and Strength Design and Material Applications, The Macmillan Company, New York, 1963.
[30] V. Nesetova, E. Z. Lajtai, Fracture from compressive stress concentrations around elastic flaws, Int. J. Rock Mech. & Mining Sciences 10 (1973) 265-284.
[31] L. Obert, W. I. Duvall, Rock Mechanics and the Design of Structures in Rock, John Wiley & Sons, New York, 1967. [32] P. Pal Roy, Rock Blasting Effects and Operations, A. A.
Balkema, Leiden, Netherlands, 2005.
[33] R. E. Peterson, Stress Concentration Design Factors, John Wiley & Sons, New York, 1974.
[34] K. J. Schulz, On the state of stress in perforated strips and plates, in: Neth. Royal Academic Sciences (1942) 45-48. [35] T. Szwedzicki, Draft ISRM suggested method for determining
the indentation hardness index of rock materials, Int. J. Rock Mech. & Mining Sciences 35 (6) (1998) 831-835.
[36] H. Tada, P. C. Paris, G. R. Irwin, The stress analysis of cracks Handbook, Third Edition, The American Society of Mechanical Engineers, Professional Engineering Publishing Limited, 2000.
[37] B. N. Whittaker, R. N. Singh, G. Sun, Rock fracture mechanics, principles, design and applications, Elsevier, Netherlands, 1992.
[38] S. Yağız, Assessment of brittleness using rock strength and density with punch penetration test, Tunnelling & Underground Space Tech. 24 (2009) 66-74.
[39] X. Yan, Rectangular tensile sheet with single edge crack or edge half-circular-hole crack, J. Eng. Failure Analysis 14 (2007) 1406-1410.
[40] R. W. Zimmerman, Stress concentration around a pair of circular holes in a hydrostatically stressed elastic sheet, J. App. Mech. 55 (1988) 487-488.