International Journal of Current Research in
Biosciences and Plant Biology
ISSN: 2349-8080 Volume 2 Number 1 (January 2015) pp. 62-83
www.ijcrbp.com
Original Research Article
A Survey of
Allium cepa
L. Chromosome Damage in Slovenian Environmental
Water, Soil and Rainfall Samples
Peter Firbas*
Private Laboratory for Plant Cytogenetics, Ljubljanska c. 74, SI – 1230 Domzale, Slovenija
*Corresponding author.
A b s t r a c t
K e y w o r d s
Present study covers many sources of drinking water in Slovenia (SI) , surface waters, and waters during the period from 1998 to 2013. The freshwater samples studied are grouped into six main categories: waters used for drinking, standing surface waters, flowing surface waters, waters surrounding the earth particles, rainfall waters, waste waters before entering the water cleaning plants (WCP) and waste waters after being processed by the WCP and constructed wetlands (CW). With Allium cepa L. test the study proved the potential cytotoxical, and genotoxical substances in the samples taken from the environment. The biomarkers in this Allium metaphase (M) test are the metaphasic chromosomes damages (CsD) in the root cells of the test plant A. cepa L. The comparison between the uncontaminated environmental samples and the negative control is not statistically significant (p = 0.7709 >0.05). The highly contaminated environmental samples and the positive control (PC) are statistically significantly different (p = 0.0059 < 0.01), while the moderately contaminated environmental samples do not significantly differ from the positive control (p = 0.1412 > 0.05). A great difference takes place between the inputs into the water cleaning plants and their cleaned output water (p = 3.1e-11 < 0.0001). The Fisher's Exact Test is used for statistical calculations of the research results. In the 2×2 frequency tables, the p-value determines the statistical characteristics or non-characteristics of two categorical patterns.
Allium M test
Cleaned effluent
Soil
Wastewater
Water
Introduction
The aquatic, soil, air environment plays a vital role in functioning of ecosystem. However, industrialization, urbanization and non-sustainable developments are posing serious threat to the aquatic and other system. Water bodies like rivers, lakes and ponds are polluted due to the discharge of
industrial effluents, agricultural runoff, traffic and domestic wastes into them (Egito et al., 2007; Walia et al., 2013; Bacare et al., 2013).
making imposible to assess the hazard only from the chemical indicators of water quality. Complex chemical mixtures may be released into the environmental from a variety of sources including hazardeous waste sites (Gillespie, 2006). Most industrial and municipal wastewater can be characterized as extremely complex mixtures containing numerous inorganic as well as organic compounds (Nielsen and Rank, 1994).
Study of the mutagenic potential of air, soil and water ecosystem contaminated by human activities is important not only for the quality of life found in the air, soil and water environmental, but also for man himself since these environments are a surce of human exposure to xenobiotics (Al-Sabti, 1989). Xenobiotics such as: (i) Aliphatic hydrocarbous and derivates, (ii) Chalogened Aliphatic componends (iii) Aromatic hydrocarbons and derivates (iv) Polycyclic aromatic hydrocarbons (PAHs), (v) Chalogened aromatic camponends (vi) AZO dye (componends with nitro groups), (vii) Organophosphates, (viii) Metals componends (Carita and Marin-Morales, 2008; Kaur et al., 2010; Cabaravdic, 2010; Abu and Mba, 2011; Evans and Furlong, 2010; Katnoria et al., 2011; Mazzeo et al., 2011; Oriaku et al., 2011).
Aquatic pollutants produce multiple consequences at organism, population, community and ecosystem level, affecting organ function, reproductive status, population size, species survival and thus biodiversity (Bolognesi and Hayashi, 2011). It is not enough only to know what affects us, but also how dangerous this is. Just the physical and chemical measurements are not sufficient; knowing the biological consequences of these complex cocktails of chemicals that surround us is also needed. Therefore there is a need to know more about the ways these chemicals are processed in our organisms (Altenburger et al., 2012; Martin 2007).
Toxicological and genotoxicological investigation of complex mixtures is one of the main focus of the recent research in toxicology. Testing complex mixtures present a formidable scientific problem since most recently available toxicological data has obtained from single substance studies and is not simply transferable to mixtures of chemical (Muller et al., 2002). Contrary to human toxicity studies which focus on the fate of the individual, ecogenototoxicology evaluates the consequences of
genotoxicants for population sizes and structure, but applies the principles of genetic toxicology in hazard and risk assessment (Akpoilih, 2012).
The measured biological effects of some water samples appeared related to the physicochemical characteristics. Therefore, mutagenicity/ genotoxicity assays should be included, along with conventional chemical analysis, in water quality monitoring programs. Their use would allow the quantification of mutagenic hazards in surface and wastewaters (Radic et al., 2010). Wastewater treatment is considered as a water use becouse it is so interconected with the other uses of water. Much of the water used by homes, industries, and businesses must be treated before it is released back to the environmental. Some pollutants show xenobiotic, carcinogenic or genotoxical effects, sometimes they also provoke hormonal disorders (Grant and Salamone, 1994; Sumpter, 2005; Hayes et al. 2006).
The surface waters are nowadays more and more used as a source for drinking water while at the same time they often contain genotoxical and/or carcinogenic substances which sometimes occur also in the bushes (Vujosevic et al., 2008; Barberio et al., 2009). Drinking water reservoirs, lakes, rivers are often also the containers for different industrial, urban and other possibility dangerous substances. Smaller water containers typically serve as the source for drinking water while larger ones are used for irrigation and sports. Genotoxical substances in water give rise to various illnesses, cancer diseases and the symptoms of decreased fertility in young people (Majer et al., 2005).
An increased frequency of cancer diseases occurs in organisms living in the areas where the concentration of genotoxical substances has been increased (Silberhom et al., 1990; Tchounwou et al., 1996). There is also a very important study showing the process of extinction of some organisms living in the contaminated ecosystems (Ricciardi and Rasmussen, 1999).
able to reduce microbial water pollution, bat also produce genotoxic and toxic compounds. The major clorination by-products that have been the object of intensive evaluation are the trihalomethanes, chalogenated acetic acid and chlorinated furanones, dioxine, sodium hypochlorite most of which are know carcinogens (Komulainen, 2004; Monarca et al., 2002; Monarca et al., 2003; Monarca et al., 2005).
Higher plants are recognized as excellent genetics models to detect environmental mutagens and are frequently used in monitoring studies (Leme and Marin-Morales, 2009). The Allium cepa test, which is considered one of the efficient approaches to assess toxic effects of environmental chemical, was selected to aveluate the potencial risks of these ubiquitous pollutants (Herrero et al., 2012). Biomonitors, like Allium cepa L., wich is one of the most used plant species when monitoring effluent genotoxicity, have been used to alert the world population about environmental contamination and genotoxic chemical emissions (Bagatini et al., 2009).
Onion (Allium cepa L.) is very suitable for genotoxic studies because:
(i) the root growth dynamics is very sensitive to the pollutants,
(ii) the mitotic phases are very clear in the onion,
(iii) a stable chromosome number,
(iv) diversity in the chromosome morphology, (v) stable karyotype
(vi) clear and fast response to the genotoxic substances and
(vii) spontaneous chromosomal damages occur rarely.
Therefore this test has become well established for the determination of the genotoxic substances in various environments. The purpose of this work was to investigate water and air-borne carcinogens and/or mutagens in relation to water, soil and air quality. The Allium M test was used as a means of monitoring the environment for the presence or absence of mutagens and/or carcinogens which would give some indication of the efficiency of disposal of industrial, traffic, agriculture waste product.
Materials and methods
Sample
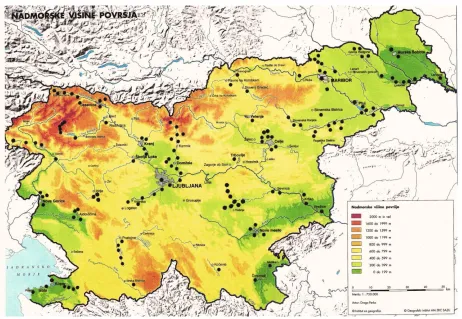
Drinking water, Surface water, Spring, Rainfall, Soil, wastewater (WW), final cleaning effluent (FCE), Leachate (Table 1 and Fig. 1).
Allium metaphase (M) test
The tests were done with the Allium M test and show the degree of genotoxicity by observing the aberrations of the metaphasic chromosomes of the plant Allium cepa L. that are evoked by genotoxic substances in the polluted water (Firbas and Amon, 2013).
Onion preparation for the test
Small onion (Allium cepa L.) bulbs of the same uniform size, weighing about 3 – 3.5 g, were denuded by removing the loose outer scales and scraped so that the root primordia were immersed into the different tested liquids (drinking quality water, rivers and lakes, industrial wastewater, rainfall, snowfall, chemical combined, rivers and lakes sediment, soil and condensed water obtained from the atmosphere).
Chromosome preparations
The squash technique for onion root described by Al-Sabti (1989) was used for the preparation of chromosome. Chromosome preparations were set up from root meristem containing actively growing cell by the following method: developing root with bulbs were pre-treatment with 0.1% aquatic solution of colchicine for 3 h at 21°C.
Macroscopic parameters
The root length and other parameters as usual root form, number, colour and turgidity after cultivation 72 h into the different tested liquids environmental samples were recorded (Fig. 2).
Microscopical parameters
To study the damage of chromosome and chromatid (breaks), treatment with colchicines was used. Onion plant Allium cepa L. has 16 monocentric chromosomes (2n =16) with basic number x = 8 (Fig. 3). Karyotype of the chromosome and the possible aberrations seen at metaphase chromosome are: (i) chromatid break, (ii) centromere break and (iii) chromosome break (Firbas and Amon, 2014). Chromatid break are: acentric ring chromatid (Fig. 4a), centric ring chromatid (Fig. 4b), single break chromatid (Fig. 6c), double break chromatid (Fig. 5b, 6b), multiple break chromatid (Fig. 5d), gap break (Fig. 5c, 6d), triradial chromosomes with one centromere and three terminal chromatid ends (Fig. 7). Centromere break belong into the chromatid damage class and are located near the centromere region of the chromosome (Fig. 5a, 6a, 8). Chromosome break are: ring chromosome and (Fig. 9 left) dicentric chromosome (Fig. 9 right).
Level of genotoxicity
Genotoxicity is a general term referring to alternation to the gross structure or content of chromosome (clastogenicity) by exposure to toxic agents. Level genotoxicity is defined by the percentage between all the metaphase cells and the cells with their chromosomes damaged. The cell is called aberrant, if at least one chromosome gets damaged. The total number studied is 200 metaphase cells. Injuries within a chromosome set affect one or two chromosomes within that set, possibly 3 to 7 or 8, and in rare cases up to 12 or all in the chromosome set (Fig. 10). However, all chromosomes within a chromosome set could be damaged. The higher the level of genotoxicity, the more damaged chromosomes in the set.
Parallel control test
Integral parts of Allium test are the so called negative and positive control. Negative control (NC) shows the degree of toxicity in unexposed onions and serves as control of the test efficiency. Positive control (PC) is
used with known material which normally induces a high degree of toxicity and is necessary for controlling the test response. In other words - nearer the results of tested samples to negative control, the better the quality of water. On the other hand - farther the values from the results of negative control and nearer to the positive control – this points to poorer water quality.
Physical and chemical parameters
The physical and chemical properties of the effluent sample were determined in accordance with standard analytical methods (APHA, 2005). Suspended substances in the sample were determined by the standard (SIST ISO 11923), Chemical oxygen Demand (COD) with standard (SIST ISO 6060) and Biological Oxygen Demand (BOD) with the standard (SIST EN 1899-1). Chemical compound in the environmental samples have been determined by comparing some analytical methods, based on the following techniques: gas chromatography-mass spectrometry (GC-MS), inductively coupled plasma-mass spectometry (ICP-MS) (Feng et al., 2012), purge and trap-gas chromatography-mass spectrography (PT-GC-MS) (Culea et al., 2006) and high performance liquid chromatography (HPLC).
Statistical calculation
Statistically established significant differences among the investigated samples are confirmed by the statistical calculation of paired data analysis using the two-way Fisher’s exact test, which gives the p value property between pairs of data (Agresti, 1992). These pairs (investigated samples) are either different (statistically significant) or the same (statistically insignificant), and tell us what the risk is. The most common values are 0.05, followed by 0.01, 0.001 and 0.0001. With regard to these limits 5, 1, 0.1 and 0.01% levels of significant results were also derived. Whichever of these levels selection depends a great deal on the nature of the data and the problem addressed by the basic assumption. Statistical significance should not be the only determining factor when evaluating the results.
Results and discussion
geographical sample locations and more than 1550 tests performed. Locations were grouped into six reference groups: drinking water, surface flowing water, surface standing water, soil on the
surface, precipitation water, waste waters originating from household or industry which were divided into 19 sub-reference groups (Table 1 and Fig. 1).
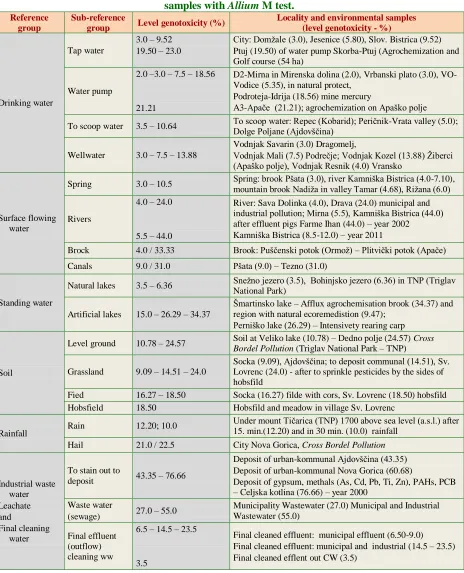
Table 1. Reference and sub-reference groups, which have been investigated in environmental
samples with Allium M test.
Reference group
Sub-reference
group Level genotoxicity (%)
Locality and environmental samples (level genotoxicity - %)
Drinking water
Tap water
3.0 – 9.52 19.50 – 23.0
City: Domţale (3.0), Jesenice (5.80), Slov. Bistrica (9.52) Ptuj (19.50) of water pump Skorba-Ptuj (Agrochemization and Golf course (54 ha)
Water pump
2.0 –3.0 – 7.5 – 18.56
21.21
D2-Mirna in Mirenska dolina (2.0), Vrbanski plato (3.0), VO-Vodice (5.35), in natural protect,
Podroteja-Idrija (18.56) mine mercury
A3-Apače (21.21); agrochemization on Apaško polje
To scoop water 3.5 – 10.64 To scoop water: Repec (Kobarid); Peričnik-Vrata valley (5.0); Dolge Poljane (Ajdovščina)
Wellwater 3.0 – 7.5 – 13.88
Vodnjak Savarin (3.0) Dragomelj,
Vodnjak Mali (7.5) Podrečje; Vodnjak Kozel (13.88) Ţiberci (Apaško polje), Vodnjak Resnik (4.0) Vransko
Surface flowing water
Spring 3.0 – 10.5 Spring: brook Pšata (3.0), river Kamniška Bistrica (4.0-7.10), mountain brook Nadiţa in valley Tamar (4.68), Riţana (6.0)
Rivers
4.0 – 24.0
5.5 – 44.0
River: Sava Dolinka (4.0), Drava (24.0) municipal and industrial pollution; Mirna (5.5), Kamniška Bistrica (44.0) after effluent pigs Farme Ihan (44.0) – year 2002 Kamniška Bistrica (8.5-12.0) – year 2011
Brock 4.0 / 33.33 Brook: Puščenski potok (Ormoţ) – Plitvički potok (Apače)
Canals 9.0 / 31.0 Pšata (9.0) – Tezno (31.0)
Standing water
Natural lakes 3.5 – 6.36 Sneţno jezero (3.5), Bohinjsko jezero (6.36) in TNP (Triglav National Park)
Artificial lakes 15.0 – 26.29 – 34.37
Šmartinsko lake – Afflux agrochemisation brook (34.37) and region with natural ecoremedistion (9.47);
Perniško lake (26.29) – Intensivety rearing carp
Soil
Level ground 10.78 – 24.57 Soil at Veliko lake (10.78) – Dedno polje (24.57) Cross Bordel Pollution (Triglav National Park – TNP)
Grassland 9.09 – 14.51 – 24.0
Socka (9.09), Ajdovščina; to deposit communal (14.51), Sv. Lovrenc (24.0) - after to sprinkle pesticides by the sides of hobsfild
Fied 16.27 – 18.50 Socka (16.27) filde with cors, Sv. Lovrenc (18.50) hobsfild Hobsfield 18.50 Hobsfild and meadow in village Sv. Lovrenc
Rainfall Rain 12.20; 10.0
Under mount Tičarica (TNP) 1700 above sea level (a.s.l.) after 15. min.(12.20) and in 30 min. (10.0) rainfall
Hail 21.0 / 22.5 City Nova Gorica, Cross Bordel Pollution
Industrial waste water Leachate and
Final cleaning water
To stain out to
deposit 43.35 – 76.66
Deposit of urban-kommunal Ajdovščina (43.35) Deposit of urban-kommunal Nova Gorica (60.68)
Deposit of gypsum, methals (As, Cd, Pb, Ti, Zn), PAHs, PCB – Celjska kotlina (76.66) – year 2000
Waste water
(sewage) 27.0 – 55.0
Municipality Wastewater (27.0) Municipal and Industrial Wastewater (55.0)
Final effluent (outflow) cleaning ww
6.5 – 14.5 – 23.5
3.5
Fig. 1: Study map of the location of the environmental sample collection sites for Allium M test in Slovenia.
The comparison of the uncontaminated environmental samples e.g. Lakes high in the mountains, river springs, mountain drinking water resources and NC show no statistical significance (p
= 0.7709 > 0.05) and are therefore good reference group for the control for pollution in comparison with more or less polluted streams lower down the stream containing also communal and or industrial wastes. In moderately contaminated environments the PC sample is not significantly diverse from (p = 0.1412 > 0.01), while in the case of highly contaminated samples and PC is statistically significantly different (p = 0.0059 < 0.01).
The involvement of genotoxic substance research for the protection of environment is of great importance because this research enables the insight into the influence of the genotoxic substances to the organisms. The goal of the research is to develop a valuable tool for the monitoring of the environment. The Allium M test also shows us what is the source of the pollution and where it comes from. With the
Allium M and related genotoxic tests one generally determines the influence of the chemical substances
on the healthy organism. This test also shows an excellent correlation with similar tests applied on mammals and other vertebrates.
On the surface water samples were taken once or twice except on the locations: river Pesnica (upper stream – Zgornja Kungota), river Kamniska Bistrica (total stream – Domzale), Scavnica (lower stream – Razkrizje), spring Zelenci, river Sava Dolinka and Pišnica (uper stream – Kranjska Gora), spring Močilnik in uper stream river Ljubljanica, where a monitoring lasting for several years has been performed (Firbas, 2011). The control for Allium M test includes the investigation with a known poisonous and genotoxic substance that was applied in different concentrations (PC, level genotoxicity about 35.0 % (per cent) and water samples which had been purified by ultrafiltration (NC, level genotoxicity about per cent), this confirmed good responsivenesss of the test and it has shown that the test is a reliable and accurate.
testing responds to the possible xenobiotics in a synergistic and cumulative way. What the Allium M test shows is the accumulated and synergistic effect of hundreds of chemicals that are diluted in the water sample studied. This test also shows the excellent correlation with other biological tests which are performed in vivo, like the tests on the mammalia (Leme and Marin-Morales, 2009) and human blood cells (Al-Sabti et al., 1992), so that the
Allium test results show a high significance also for the impact for the human.
Drinking water
We studied especially in detail the drinking waters in Slovenia. The most sensitive region is the Karst region where the water area for a spring covers even more than 100 km² and are connected with several kilometers long underground waterways. So for the karst springs one readily knows their location, but it is very hard to determine where they collect their water from. Since the karst underground is composed of relative large cavities, the water does not clean well there. So the karst water systems are very vulnerable. The karst systems in mountains are the sources of one of the best drinking waters in Slovenia and they deserve to remain unpolluted. In general the Allium M test showed a good water quality where the soil around the spring is not used for intensive agriculture (e.g. mountain regions or forests) while regions with intensive agriculture like
many places on the East Slovenia show not so good water quality (ARSO, 2008). An interesting example is the Krško polje, where on the spot called Drnovo there runs the continuous Allium M testing since 2002. The quality of the underground water at this spot increased significantly in January 2005. Probably the ban of atrazin and more controlled use of pesticides contributed to this. (ARSO, 2008). A similar picture June 2006 shows also the spot I. on the south of Mengeš-Domţale field.
Mountain glacial lakes and the lake of Bohinj
The lowest genotoxical level and so the highest quality reach the lakes: "Sneţno jezero", "Jezero pod Vršacem" and "Rjavo jezero" (p = 0.000004). The genotoxical level of the lake "pod Tičarico" is somewhat increased (p = 0.0006 < 0.001) probably because of the influence of the mountain cottage "Koča pri Triglavskih jezerih" (1700 m above the sea level), being very much frequented (10.000 overnight stays during the summer season). The lowest genotoxicity level (3.5/4.3%) was found in Sneţno jezero in DTJ (Dolina Triglavskih Jezer) on the region of TNP – Triglavski Narodni Park (Triglav National Park). Many river springs and upstream flows have 5-10 times lower genotoxicity level than the river Ščavnica (see above its description) while many drinking water sources have 2-5 × higher level than Snezno jezero (Table 2 and 3).
Table 2. The genetal toxicity (root growth-inhibition) and genotoxicity (induction of CsD) of mountain lakes and control (NC – tap water filtered with R.O. – reverse osmosis; PC – 10 ppm Methan
methilsulphonate (MMS, 4016 Sigma).
Lake Length of root
(mm)
Number of identifty metaphase cell
Metaphase cells with chromosome
damage
Level genotoxicity
(%)
I. Jezero pod Vrsacem 41.8 116 5 4.31
II. Rjavo jezero 41.4 129 6 4.65
III.Snezno jezero 43.2 200/115 7/5 3.5/4.34
IV. Zeleno jezero 39.8 120 9 7.50
V. Veliko jezero 41.7 137 9 6.56
VI. Močivec 42.8 102 6 5.88
VII. Jezero pod Tičarico 41.5 112 9 8.03
VIII. Crno jezero 42.1 123 9 7.31
IX. Bohinjsko jezero 41.3 110 7 6.36
X. NC 43.1 118 3 2.54
Table 3. Physical-chemical analysis of mountain lakes (parameters criterion for drinkig water – Legislation in Republic Slovenia⃰ ).
Lake Coluor m-1
Turbidity NTU pH
Conductivity µS/cm
KMn04 mg/l
NH4 mg/l
NO3 mg/l
NO2 mg/l
PO4 mg/l Jezero
pod Vrsacem < 0.2 0.7 8.4 150 1.6 0.05 0.90 0.008 < 0.05
Rjavo
Jezero < 0.2 0.7 8.4 149 1.6 0.04 0.88 0.009 < 0.05
Sneţno
Jezero < 0.2 0.5 8.8 122 1.6 0.02 0.15 0.004 < 0.05
Zeleno Jezero < 0.2 2.0 10.1 90 11.1 0.04 0.15 0.007 < 0.05
Veliko
Jezero < 0.2 0.4 8.5 150 2.5 0.03 0.57 0.009 < 0.05
Mocivec < 0.2 0.9 8.2 175 1.6 0.02 1.36 0.002 < 0.05
Jezero pod
Ticarico < 0.2 1.1 8.7 167 3.2 0.02 0.94 0.010 < 0.05
Crno Jezero < 0.2 0.5 8.7 154 3.8 0.04 0.91 0.010 < 0.05
Bohinjsko
Jezero < 0.2 1.0 8.3 183 3.8 0.03 1.20 0.014 < 0.05
MPC⃰ 0.5 5
6.5 to 9.5
2500 10 0.1 50 0.1 -
⃰ MPC – Maximum Permissible Concentration; Official Leaf Republic of Slovenia (No. 46/97, 52/97, 54/98, 7/2000).
Table 4. General toxicity (the length of the roots) and level of genotoxicity (induction of CsD) of environmental samples in the Triglav National Park.
Samples and Locality
General toxicity Average length of
root (mm)
No. of metaphase cells identified
No. of metaphase cell with chromosome
damage
Average level genotoxicity
(%)
I. Water Spring - Planina
Viševnik 36.6 150 13 8.66
II. Sediment lake- Mlaka v Utah
32.2 132 13 9,84
III. Soil – East of Veliko jezero
34.8 102 11 10.78
IV. Soil – Štabce 34.6 140 18 12.85
V. Soil – Dedno polje 23.8 118 29 24.57
VI. Rainfall – Koča pri Triglavskih jezerih (po 15')
35.4 245 25 12.20
VII. Rainfall – Koča pri Triglavskih jezerih (po 30')
35.6 140 14 10.0
VIII. NC (reverse osmosis-R.O.)
42.3 119 3 2.54
IX. PC (10 ppm MMS) 25.6 119 35 29.41
Water spring, lake sediment and soil in the mountain Triglav National Park (TNP)
In July and August 2003 we have performed the measurements of the lake waters in the valley of "Dolina Triglavskih jezer" (DTJ), as well as the soil measurements intended for use with the Allium M test. We sampled also the rainfall water (always
quality (p = 0.7285 > 0.05). This could be explained by a cross-border pollution from other agrochemical sources - the chemicals might be imported by wind. The soil samples from the Karst valley on Dedno polje (1600 height above sea level) posses a significantly higher genotoxical level than the samples from higher locations east from the lake "Veliko jezero" (1900 m above sea level) in the valley of Triglavska jezera (p = 0.0360). The reason for this difference lies probably in the already mentioned modernism Cross Border Pollution.
Smartinsko lake
Smartinko lake shows a very variable water quality (Table 5 and Fig. 11). Vojnik bay is surrounded by forests and grasslands and therefore has a good water quality, while Koprivnik bay receives lots of water coming from places with intensive agriculture and only partly cleaned urban sewage from the nearby places Šmartno and Loče (p =3.0e–9). The genotoxical level of the bay "Šmartinski zaliv" (Sample III) lies nearest to the positive control and so reaches the highest genotoxical level. Water of the Brezovo peninsula (Sample II) is closest to the negative control and so reaches the lowest genotoxical level. Sample No. II taken on the border of the stream Brezovo in Šmartinsko jezero, differs a little from the NC (p = 0.011) and of course a lot from PC (p = 1.4e-10). In Šmartinsko jezero we have proven the existence of significant genotoxical level in water. The general genotoxical level varies on different locations, basically it is dependent on the intensity of possibly polluted water inflow from the nearby streams. The results show that the most pollution brings the stream Koprivniški potok, where the genotoxical level lies at highest (34.47%) as compared to other bays of the lake (9.44 - 14.44%). Koprivniški potok collects pesticide containing water originating from agricultural areas and larger settlements in the vicinity of Šmartno and Loče, which do not have any water cleaning setup.
Scavnica river
Some waters in Slovenia show a large dynamics of quality in time. The most genotoxically polluted river in Slovenia (60%) was in 2002 and 2003 Ščavnica in the place Pristava near to the town Ljutomer (Table 6). This degree of pollution continued until Ščavnica reached the river Mura. The reason was the intensive use of agrochemicals
in the surrounding fields and industrial pollution of the town Ljutomer. When the common WCP was set in operation in Ljutomer in 2006 and the ban of atrazin (ARSO, 2008) the genotoxicity level dropped in year 2006 in the place Pristava to 16 %. Until 2005 there had been a large inflow of pesticides like atrazin and other pollutants. After the common WCP has been put in operation in 2005 the quality of the Ščavnica water showed in 2006 a significant improvement compared to the year 2003 (p = 2.02e-17). A significant factor here was also the ban of atrazin in that time (p = 0.0115). Before the operation of the water cleaning plant the quality of the river Šcavnica was equal to the present inflow of the polluted water into the water cleaning plant (p = 0.5178). The wastewater is mitodepressive and increased significantly the root growth inhibition and malformation and induced multiple chromosome damage (Figs. 5, 6 and 7). Frequent rainfall is the other factor helping to improve the water quality of relatively slow and small river Ščavnica (p = 0.00059). Measurements done in 2008 on the location Pristava confirmed the same water quality as determined in 2006 (p = 0.8498), what demonstrates the high quality operational level of the WCPLjutomer.
Kamniska Bistrica river
Table 5. General toxicity (the length of the roots) and level of genotoxicity (induction of CsD) of the water samples of Šmartinsko lake.
Samples
General toxicity Average length of
root (mm)
No. of metaphase cells identified
No. of metaphase cell with chromosome
damage
Average level genotoxicity
(%)
I. Vojnik gulf 32 180 26 14.44
II. Brezovo peninsula 37 190 18 9.47
III. Šmartno gulf 29 192 66 34.37
IV. Loče water barier 30 120 23 19.16
V. NC 41 320 7 2.18
VI. PC (1 ppm)1 9 110 46 *41.81
1
Herbicide PRIMEXTRA GOLD 720 SC (1000 g) contents:
400 gl-1 S-metolachlor [(S)-2-chloro-N-(2-ethyl-6-methyl-phenyl)-N-(2-metoxi-1-methyl-ethyl)-acetate-mid] 320 gl-1atrazine (6 – chloro N ethyl – N(1– methyl) – 1,3,5 – triazine – 2,4 – diamine)
Table 6. Monitoring of the Ščavnica river in the years from 2001 to 2003 and from 2006 to 2008. The quality of Scavnica river in northeastern Slovenia, before and after running the common WCP Ljutomer in 2005,
as well as the quality of the river before and after the prohibition of agrochemization atrazine on the surrounding fields.
Locality / Year 2001
October 2002 July 2002 November٭ 2003 August 2006 October 2008 March
1. River site at Biserjane -
126/91 7.142 36 mm3
- - - -
2. River site before city Ljutomer 130/48 36.92 25 mm 124/26 20.96 24 mm - 134/41 30.59 27 mm 200/35 17.5 35 mm 200/41 19.5 28,8 mm
3. Afflux Globetka brook -
150/12 8.0 36 mm
- - - -
4. River site after city
Ljutomer (old riverbed) - - - - -
200/39 14.5 30,6 mm
5. River site at 30 m before
WCP - - - -
200/33 16.5 32 mm 200/34 17.0 30,2 mm
6. Waste water - - - -
100/55 55.0 5 mm 5/5 0.00 2.1 mm
7. Cleaning final effluent
from WCP Ljutomer - - - -
200/37 18.5 30 mm 200/29 14.5 31 mm
8. River site at villige
Pristava -
122/80 65.57 8 mm - - 200/32 16.0 36 mm 200/28 14.0 31.8 mm
9. River site at before villige Veščica 105/60 55.14 15 mm - 160/56 35.0 25 mm 156/92 58.97 6 mm - -
10. River site at villige
Veščica - - -
144/85 59.02 6 mm
- -
11. 50 m before outflow in the Mura river
120/72 60.0 12 mm - 125/43 34.40 26 mm 153/91 59.47 5 mm - -
٭ More day rain season; 1 126/9 – Number of identifly metaphase cell / metaphase cell with chromosome damage 2
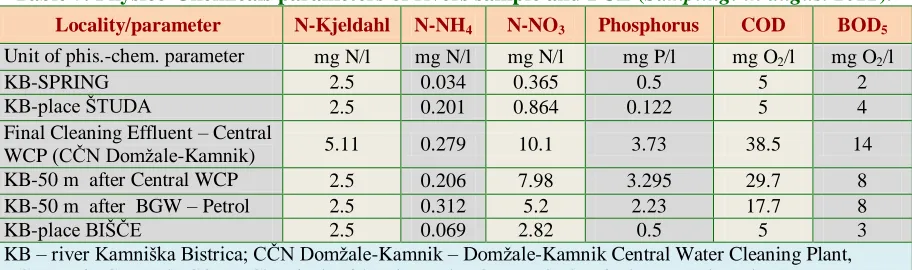
Table 7. Physico-Chemicals parameters of rivers sample and FCE (Sampling: in august 2011).
Locality/parameter N-Kjeldahl N-NH4 N-NO3 Phosphorus COD BOD5
Unit of phis.-chem. parameter mg N/l mg N/l mg N/l mg P/l mg O2/l mg O2/l
KB-SPRING 2.5 0.034 0.365 0.5 5 2
KB-place ŠTUDA 2.5 0.201 0.864 0.122 5 4
Final Cleaning Effluent – Central
WCP (CČN Domţale-Kamnik) 5.11 0.279 10.1 3.73 38.5 14
KB-50 m after Central WCP 2.5 0.206 7.98 3.295 29.7 8
KB-50 m after BGW – Petrol 2.5 0.312 5.2 2.23 17.7 8
KB-place BIŠČE 2.5 0.069 2.82 0.5 5 3
KB – river Kamniška Bistrica; CČN Domţale-Kamnik – Domţale-Kamnik Central Water Cleaning Plant, BGW – Bio Gaswork, COD – Chemical oxiden demand, BOD5 – Biochemical oxygen demad..
The third section lies between Bišče and Beričevo, where the river auto-regenerates into a very good quality level. The genotoxical level of the river Kamniška Bistrica at its start is 3.5%, on the location Študa it (before the inflow of the water from the water cleaning plant, which has itself 14%) reaches 9.5% and 50 m after the above mentioned inflow the genotoxical level increases to 11.5%, while 100 m downstream of this inflow Biogaswork (BGW) Petrol – former outflow Farms Ihan; falls back to 11.0% and further downstream in Bišče to 9.5%.
The river auto-regenerates until Bišče, so that the pollution brought by the outlet of the water cleaning plant fails to be detected after 1750 m downstream (Table 8). There is a plan for improvement of the water cleaning plant in 2015 which will significantly increase the water quality of the this outlet.
Sava Dolinka river
The water quality of the river Sava Dolinka and spring Zelenci has increased significantly after the WCP Tabre has been put into operation in 2004 (Table 9). Kranjska Gora is a big tourist destination with the capacity of housing up to 4500 tourists. The season lasts from December to April and this contributes to the big quantities of the waste water. From the results of our study we conclude that the WCP Tabre works very well- the genotoxical level of the cleaned water has decreased significantly (p = 0.000002 < 0.0001), what also helps to retain the high quality of the water in the river Sava Dolinka. There is no measurable difference before and after the outlet of the water cleaning plant water into Sava Dolinka (p = 1 > 0.05).
River sediments
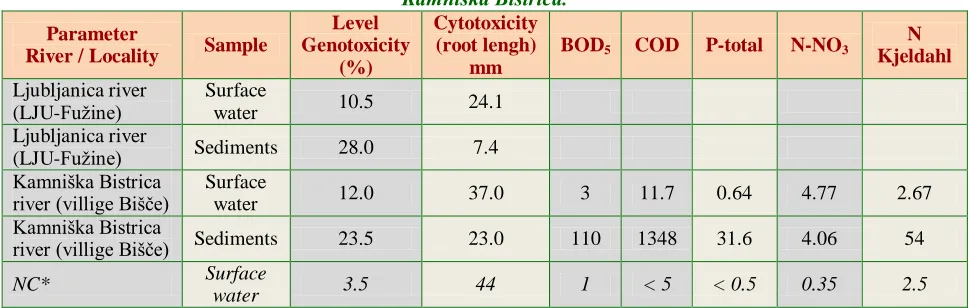
In order to understand and to assess the impact of drastically increased antrophogenic activity on the aquatic ecosystem of the river, initial efforts are much needed to determine the genotoxicity of the sediments and the contaminants (Feng et al., 2012). Sediment represent material created by the deposit of suspended particles from the water profile at the bottom of an aquatic ecosystem (Perovic et al., 2012). After sedimentation suspended particular matter (SPM or total suspended solid - TSS) are the accumulated in the sediments and contribute to identify hazard factors and eco-genotoxicological risks of sediment. The sediment-contact Allium cepa
biotest enables to evaluate the effect of exposure to native river sediments, as surface water systems often contain genotoxic compounds. The results (Table 10) showed that there were significant increased of CsD frequencies observed in the native sediment-exposed groups, compared with the surface water in the river Ljubljanica (p = 0.0000059 < 0.00001) and river Kamniška Bistrica (p = 0.0054 < 0.001), indicating that the sediments clearly had genotoxicity (induction of CsD in root meristeme cell) and citotoxicity (root growth inhibition) to the Allium cepa L.
The untreated and treated waste water quality tests of classical WCP and CW
Table 8. General toxicity (the length of the roots) and level of genotoxicity (induction of CsD) of an
environmental samples from the river Kamniška Bistrica; NC – Negative control (tap water filtered with
R.O. – reverse osmosis 50 galon membrane), PC – Positive control (1 mg/L ali 1 ppm metan metil sulphamid – MMS 4016 SIGMA).
Locality / site
Metaphas e index
(‰)
Number of identify metaphase
cell
Metaphase cell with chromosome
damage
Level genotoxicity
(%)
Citotoxicity (root lengh in mm; (growth in hour)
24h 48h 72h
I-Spring 98 200 7 3.5 10 23 40
II- place ŠTUDA 97 200 19 ٭9.5 9 23 38
III-50 m after at discharge
Central WCP 85 200 23 ٭11.5 9 20 39
IV-50 m before at BGW
Petrol 90 200 22 11.0 10 22 38٭
V- villige BIŠČE 93 200 19 ٭9.5 10 21 39
VI-NC l02 200 6 3.0 42
VII-PC 31 100 21 21.0 21٭
Table 9. Comparison of the results level genotoxicity studies in the area of the river Sava Dolinka (Tamar – Podkoren – Kranjska Gora – Dovje in the length 25 km) in the period from 2001 to 2013 (term of studies: March-April). In 2004 he start to operate WCP Tabre (but not in all localization). The location and
year of research 2001 2002 2003 2004 2005 2006 2007 2008 2009 2010 2011 2012 2013 Spring Nadiţa
(walley Tamar) 4.68
Zelenci 15.15 13.20 12.90 5.50 11.5 4.0 12.0 5.5 4.0 3.5 6.5 Pišnica (Jasna) 11.38
Pišnica (Čičare) 5.0 4.0
Outflow
communal-meteor water
10.5
Pišnica river
( HE Pišenca) 11.0 5.5
Sava Dolinka (Before confluence with Pišnica river)
- - 16.0 8.50 9.5 7.0 6.0 9.0 6.0 6.0 4.0 6.0
Sava Dolinka (After confluence
Pišnica river) 17.85 16.16 11.94 6.00 6.5 5.0 5.5 9.0 8.0 5.5 4.0 5.5 Sava Dolinka –
(80 m before outflow CP Tabre)
6.00 6.5 5.5 6.0 8.0 8.0 6.0 4.5
Waste water ٭٭ 46 29 32.0 44.0 27.0 25.0 37.0 22.5
Cleaning outflow
water (CP Tabre) - - - 6.50 7.5 8.5 6.0 10.0 9.0 6.5 5.5 6.0 7.5 Sava Dolinka
(80 m after outflow CP Tabre)
6.00 5.5 6.0 5.5 9.0 8.0 6.0 5
Sava Dolinka ( 300 m after outflow CP Tabre)
14.18
Sava Dolinka (after confluence Bistrica brook village Dovje)
14.28 13.33 12.05 5.50 5.5 5.5 5.0 8.5 7.5 5.5 4.5 4.5 4.0
Table 10. The difference in quality between the surface water and river sediment; *NC – River Spring Kamniška Bistrica.
Parameter
River / Locality Sample
Level Genotoxicity
(%)
Cytotoxicity (root lengh)
mm
BOD5 COD P-total N-NO3
N Kjeldahl
Ljubljanica river (LJU-Fuţine)
Surface
water 10.5 24.1
Ljubljanica river
(LJU-Fuţine) Sediments 28.0 7.4
Kamniška Bistrica
river (villige Bišče) Surface water 12.0 37.0 3 11.7 0.64 4.77 2.67 Kamniška Bistrica
river (villige Bišče) Sediments 23.5 23.0 110 1348 31.6 4.06 54
NC* Surface
water 3.5 44 1 < 5 < 0.5 0.35 2.5
Table 11. The capacity of the eight water cleaning plant (WCP), effluent composition for the WCP and the receiving surface water (river and brook).
WCP Capacity
(PU)
Year of research
WW (complex mixtures)
The receiving rivers waters from
WCP
Central WCP Domţale-Kamnik 200.000 1998 – 2001 in 2006 – 2013
pi, phi, mi, pri, uk,
ach Kamniška Bistrica Common WCP Ljutomer 23.000 2001 – 2008 pri, uc, ach Ščavnica
WCP Tabre – Kranjska Gora 11.500 2001 – 2013 uc Sava Dolinka Central WCP Aquasystems
Maribor 190.000 2007 pi, phi, mi, pri, uc Drava
Central WCP Kasaze Slov.
Konjice 60.000 2008 ti, uc Savinja
Central WCP Petrol Murska
Sobota 42.000 2008 uc, pri Ledava
WCP Ormoţ 4.000 2009 uc Puščenski brook
CW Sveti Tomaţ 250 2009 uc New brook
Legend: pi – paper industry; ti – textile industry; phi – pharmaceutical industry; mi – metal industry; pri – processing industry; uc – urban-communal wastewater; ach-agrochemization (agrochemical)
Table 12. Classic water cleaning plant (WCP) and constructed wetlands (CW) in Slovenia with the analysis of Allium M assay and BOD5 waste water (inflow) and final cleaned water (outflow).
WCP
Year of study
BOD5 (mg/l) Inflow
Level of genotoxity
Inflow
General toxicity
Inflow
BOD5 (mg/l) Outflow
Level of genotoxicity
Outflow
General toxicity Outflow
Central Domţale-Kamnik
WCP 2006 - - - 17.0 20.5 24.5 mm
Alike - Domţale-Kamnik 2010 - - - 19.5 13.5 35 mm
Alike - Domţale-Kamnik 2012 500 49 8 mm 10.0 15.5 31 mm
Alike - Domţale-Kamnik 2013 370 47 9 mm 9.0 15.5 31 mm
Cental Aquasystems
Maribor WCP 2007 379 49.0 3.4 mm 8.0 23.5 28 mm
Kasaze Ţalec WCP 2008 220 51.0 8 mm 17.0 14.5 27 mm
Petrol Murska Sobota WCP 2008 523 49.0 11.5 mm 10.0 12.5 31 mm
Common Ljutomer WCP 2006 480 50.0 5 mm 6.0 16.0 30 mm
Ormoţ WCP 2009 - ** *1-2 mm - 20.5 29 mm
Tabre Kranjsak Gora WCP 2010 281.5 27.0 15 mm 4.5 6.5 34 mm
Alike - Tabre 2011 164 25.0 16 mm 3.0 5.5 35 mm
Alike - Tabre 2012 151 37.0 11 mm 5.0 6.0 31 mm
Alike - Tabre 2013 22.5 27 mm 3.0 5.5 38 mm
Sveti Tomaţ CW 2009 70 29.0 17 mm 3.0 3.5 42 mm
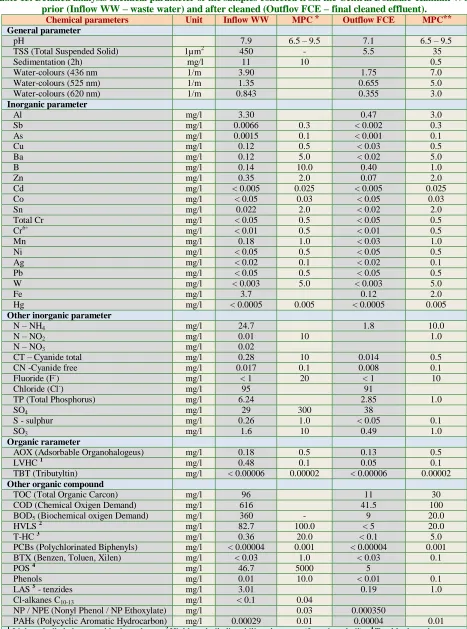
Seven of them were classical WCP and one was of thr type constructed wetland (Table 12). A clearly significant difference is shown between the input and output water quality of water cleaning plants (p = 4.0e-7 – 3.1e-11). Especially good results show the CW (p = 9.2e-13). Anyway the input water composition poses a great factor in the efficiency of the cleaning plant. The better the input water quality, the easier is the cleaning process and the better the result. For example, if the input consists only of communal waste, the cleaning effectiveness is great (p = 3.1e-11). On the other hand if also the industrial waste is present, the effectiveness decreases (p = 0.00001). It is also important the degree of quality that is reached by the process (e.g. secondary or less often tertiary phase). The largest water cleaning plant in Slovenia is for the cities Domţale and Kamnik. The expanded physical and chemical analysis shows that it has a well optimized process of cleaning (Table 13). WCP reduce pollutants in wastewater to a level nature can handle.
Leaking wastewater containers
It often occurs that the containers for waste water contain leaking points that contaminate the soil and ground water beneath. In order to investigate this danger we measured ground water samples taken 1m deep on several spots at the distances of 50 and 100 meter away from the wastewater container. The results show a very significant genotoxical level difference (p = 9.5e-9).
High water on Ljubljansko Barje
In autumn 2010, the increased water levels of rivers covered with water most of the plain south of Ljubljana called Barje. We sampled the soil samples after the water had flown away. The measurements included three locations that were previously underwater and one location that was not affected by the high water. 200g of the earth was suspended in the 200ml of drinking water (from the water system Domţale). Then the genotoxical level of the samples was determined and the statistical significance calculated. We measured the difference between pure drinking water samples and soil suspensions as well as the difference between soil suspensions themselves (Table 14). The soil taken from the location Ilovški Štradon 26 showed that the genotoxical level has increased from 6.5% to
39.5% (p =2.0e-14 < 0.0001; on the location Ilovški Štradon 30 it increased to 43.0 % (p = 3.3e-18 < 0.0001); on the location Iţanska c. 167 it increased to 48.0 % (p = 5.6e-22 < 0.0001); on location Iţanska c. 177 it increased to 46.5 % (p = 8.4e-21 < 0.0001) and on the control undisturbed location it increased to 19.5 % ( p = 0.0007). the garden earth after the water spill showed a higher genotoxical level than the unaffected garden earth (p = 2.1e-9 < 0.0001. The results thus show that the areas affected by flood show a significantly higher general degree of toxicity (shorter root length) as well as a higher genotoxical level (a larger number of cells with damaged chromosomes). We also measured an increased concentration of mineral oils and metal ions (Table 15). The rapid increase in population together with unplanned disposal of effluents from various industries has resulted in accumulation of various heavy metals like As, Cr, Cu, Hg, Ni, Pb and Zn in soil ecosystem which ultimately causes DNA damage in living systems (Katnoria et al. 2011). The study of DNA damage at the chromosome level is an essential part of genetic toxicology because chromosomal mutation is an important event in carcinogenesis (Fenech, 2000).
Soil on hobs fields
Table 13. Detalied analysis chemical parameter of the samples collected from the Central Domzale-Kamnik WCP prior (Inflow WW – waste water) and after cleaned (Outflov FCE – final cleaned effluent).
Chemical parameters Unit Inflow WW MPC ⃰ Outflow FCE MPC ⃰ ⃰ General parameter
pH 7.9 6.5 – 9.5 7.1 6.5 – 9.5
TSS (Total Suspended Solid) 1µm2 450 - 5.5 35
Sedimentation (2h) mg/l 11 10 0.5
Water-colours (436 nm 1/m 3.90 1.75 7.0
Water-colours (525 nm) 1/m 1.35 0.655 5.0
Water-colours (620 nm) 1/m 0.843 0.355 3.0
Inorganic parameter
Al mg/l 3.30 0.47 3.0
Sb mg/l 0.0066 0.3 < 0.002 0.3
As mg/l 0.0015 0.1 < 0.001 0.1
Cu mg/l 0.12 0.5 < 0.03 0.5
Ba mg/l 0.12 5.0 < 0.02 5.0
B mg/l 0.14 10.0 0.40 1.0
Zn mg/l 0.35 2.0 0.07 2.0
Cd mg/l < 0.005 0.025 < 0.005 0.025
Co mg/l < 0.05 0.03 < 0.05 0.03
Sn mg/l 0.022 2.0 < 0.02 2.0
Total Cr mg/l < 0.05 0.5 < 0.05 0.5
Cr6+ mg/l < 0.01 0.5 < 0.01 0.5
Mn mg/l 0.18 1.0 < 0.03 1.0
Ni mg/l < 0.05 0.5 < 0.05 0.5
Ag mg/l < 0.02 0.1 < 0.02 0.1
Pb mg/l < 0.05 0.5 < 0.05 0.5
W mg/l < 0.003 5.0 < 0.003 5.0
Fe mg/l 3.7 0.12 2.0
Hg mg/l < 0.0005 0.005 < 0.0005 0.005
Other inorganic parameter
N – NH4 mg/l 24.7 1.8 10.0
N – NO2 mg/l 0.01 10 1.0
N – NO3 mg/l 0.02
CT – Cyanide total mg/l 0.28 10 0.014 0.5
CN -Cyanide free mg/l 0.017 0.1 0.008 0.1
Fluoride (F-) mg/l < 1 20 < 1 10
Chloride (Cl-) mg/l 95 91
TP (Total Phosphorus) mg/l 6.24 2.85 1.0
SO4 mg/l 29 300 38
S - sulphur mg/l 0.26 1.0 < 0.05 0.1
SO3 mg/l 1.6 10 0.49 1.0
Organic rarameter
AOX (Adsorbable Organohalogeus) mg/l 0.18 0.5 0.13 0.5
LVHC 1 mg/l 0.48 0.1 0.05 0.1
TBT (Tributyltin) mg/l < 0.00006 0.00002 < 0.00006 0.00002 Other organic compound
TOC (Total Organic Carcon) mg/l 96 11 30
COD (Chemical Oxigen Demand) mg/l 616 41.5 100
BOD5 (Biochemical oxigen Demand) mg/l 360 - 9 20.0
HVLS 2 mg/l 82.7 100.0 < 5 20.0
T-HC 3 mg/l 0.36 20.0 < 0.1 5.0
PCBs (Polychlorinated Biphenyls) mg/l < 0.00004 0.001 < 0.00004 0.001 BTX (Benzen, Toluen, Xilen) mg/l < 0.03 1.0 < 0.03 0.1
POS 4 mg/l 46.7 5000 5
Phenols mg/l 0.01 10.0 < 0.01 0.1
LAS 5 - tenzides mg/l 3.01 0.19 1.0
Cl-alkanes C10-13 mg/l < 0.1 0.04
NP / NPE (Nonyl Phenol / NP Ethoxylate) mg/l 0.03 0.000350
PAHs (Polycyclic Aromatic Hydrocarbon) mg/l 0.00029 0.01 0.00004 0.01 1
Table 14. Cytological effects of the investigated samples –level genotoxicity and the average length of the roots plants of Allium cepa L. – General toxicity. On 200 g of the earths water supply is 200 ml water injects.
Location of the Earth's
No. of identify metaphase
cell
Methaphase cell with chromosome
damage
Level genotoxicity
(%)
Average length of root
(mm)
I. Ilovški Štadon 26 200 79 39.5 27
II. Ilovški Štradon 30 200 86 43.0 29
III. Iţanska c. 167 200 96 48.0 25
IV. Iţanska c. 177 200 93 46.5 28
V. Garden (no overflow region) 200 39 19.5 34
VI. Drinkig tap water:
Ljubljanska street 74, Domţale 200 13 6.5 37
VII. NC 200 5 2.5 41
VIII. PC (10 ppm MMS) 200 63 31.5 21
Table 15. Screening mineral oils and metals in samples of the Earth after the flood on the Ljubljansko barje in 2011. The depth of the Earth 1-15 cm (sampling: February 2011).
Parameter (ppm) Parcel No. 512/9 Parcel No. 502/1 *(MPC) To warn value
Mineral oil 75 40 50 2.500
Cr 55 64 100 150
Cu 65 56 60 100
Ni 38 40 50 70
Pb 120 130 85 100
Zn 220 290 200 300
Cd 1.1 1 1 2
Hg 1.2 1.4 0.8 2
As 14 11 20 30
Co 9.8 9.4 20 50
Mo 3.8 1.8 10 40
V 100 100 100
* Maximum Permissible Concentration
Table 16. The general toxicity (root length) and genotoxicity (induction CD in root cell) of soil investigated by the Allium M test; NC – Negative control (tap water filtered with R.O. – reverse osmosis 50 galon membrane),
PC – Positive control (1 mg/L ali 1 ppm metan metil sulphamid – MMS 4016 SIGMA).
Sample
No. of metaphase cells identified
Metaphase cells with CD
Level of genotoxicity (CD in %)
General toxicity (root length in
mm)
Soil site at hobsfield 200 37 18.5 25.2
Soil 20 m from hobsfield 200 33 16.5 25.4
Soil (garden) 100 m from
hobsfield 200 39 19.9 31.9
NC 200 5 2.50 42.6
PC 100 22 20.50 22.0
Measurements showed that the genotoxical level was the lowest 50 m from the hops field border (10.5%) in comparison with the soil samples from within the field, where the genotoxical level was higher (p = 0.0325). The pesticide spraying techniques that spray from the bottom up can cause that the wind blows away the pesticide aerosol and so contamination of relatively distant areas is possible. Our investigation confirmed that the soil
100 meter away shows a greater genotoxical level than the soil 50 meter away from the hops field (p = 0.0167).
Rainfall
(Triglav National Park) The levels of genotocitiy these two samples are about the same (p = 1). The hailstones in the city Nova gorica in year 2008 (Table 1) was contaminated with NC genotoxic substances (p = 2.3e-7). In studies of rainfall quality, it was evident that the aberration frequencies declined with the time of collection i.e. the firs sample taten at zero time had more chromosome aberration than those collected after 30 and 60 min (Al-Sabti, 1989). Wastewater also includes storm runoff. The rain that runs down the street during a storm is fairly clean, it isn't. Harmful substances that wash off roads, parking lots, and rooftops can harm our rivers and lakes.
Planica winter resort and ski jumping area
For the ski jumping championship that takes place in early spring there are needed large quantities of snow. In case of warm weather and scarce snow
conditions the organizers have to make use of chemicals that are mixed with snow and prolong its life. Such chemicals pose a danger to the environment when the snow melts after the competition. During the winter season 2008/2009 there was enough snow so no chemicals were necessary to add. The subterranean stream Nadiţa flows just below the resort and appears at the location Zelenci, where is also the source of the river Sava Dolinka (Comparison Table 9). We measured the water quality of Nadiţa (14. 03. 2009; during the championship - lots of snow available, genotoxical level 5.5%) and after the snow was washed away (27. 03. 2009; genotoxical level 6.5%). we see that the water quality of Zelenci remained clean and unchanged. (p = 0.8837). Measurements of the genotoxical level provide a good basis for the risk assessment studies (Table 17), andEnvironmental Quality standard-Ecological Status (EQS-ES).
Table 17. Correlation between CsD (level genotoxicity) of the roots of the onion (Allium cepa L.), physico-chemical parameters (BOD5, N – NO3) and Environmental Quality standard-Ecological Status (EQS-ES).
[Samples: environmental complex mixture as waste water, river, spring, tarn and lowland lakes, and drinking water in Slovenia. Negative control – R.O. (reverse osmosis tap water filtration), positive control: MMS – Methyl methanesulfonat].
Level of genotoxicity
Level to endanger (Risk assessment)
Environmental samples EQS-ES* BOD5
(O2 mg / l)
N – NO3 (mg / l)
< 2
Natural mutagenicity test organisms
High quality drinking water > 0.5 > 1.5
2 -5
No risk
Negative control (R.O. – tap water), 1ppb MMS,
Spring, drinking water,
I. Quality class revers and lakes
Very
good 1.6 – 2.4 3.2 – 7.0
3 – 10 Low
River spring, tarn, Lakes, 0,1 ppm MMS
I.- II. Quality class revers and lakes Good 2.0 – 5.4 6.5 – 9.5
10 – 21 Midlle
Lowland lakes and rivers, effluent waste water, 1ppm MMS, II. Quality class revers and lakes, Cleaning wastewater
Moderate >5.5 >9.6
22 – 39
High
Effluent urban-communal system , waste water, 10 ppm MMS, III. in IV. Quality class revers and lakes
Weakly < 14 < 18
40 – 65 Critical
Effluent urban-communal-industrial and agricultural waste water, to stain out to deposit, Wastewater
(municipal, industrial, leachate, intensity chemical to tread (agriculture, golf links)
Conclusion
Physico-chemical analysis alone does not provide any reliable answer to the question of how healthy the water is. We should be well aware that as regards genotoxicity there are no safe “maximum permissible concentrations” (MPC) which would ensure a good and reliable quality of water. Complementary research, however, in association with biological and chemical researches is reveals an integrated impact on the growth and development of living cells or organisms, and detects the presence of harmful substances within the limits and capabilities of analytical methods. By using biological (genotoxic) tests, we can ascertain those responses of the tested onion plant Allium cepa L., which result in eventual damage to its genetic material (chromosomes) regardless of the tolerance limits that can be caused by various contamination samples within an environment. In regard to the universality of the living organisms genetic codes, the research results are transferable (applicable) to human beings.
The aim of this research was undoubtedly to establish whether or not there is pollution and, in particular, what the risk is for living organisms. The cause or source of the pollution can be determined using the above Allium M test. Only when we know the origin can measures be taken, and thus contribute to maintaining a healthy environment, as much as possible. The inclusion of genotoxicity researches into environmental protection is of great importance, since it allows understanding of the impacts and consequences of genotoxic substances on living organisms. It is time for us to act responsibly, thus ensuring a healthy environment which also includes high quality drinking water.
Fig. 2: The length of the roots of the test plant, Allium cepa L. treated in a sample of river Ljubljanica (No. 1-4 and 6-7: long root of the surface water; No. 5 short root of the river sediments).
Fig. 3: Diploid metaphase chromosome from the root cell of the Allium cepa L. containing 2n of 16 (2n = 16).
Fig. 4: Damage chromosome: acentric chromatid (a) and centric chromatid (b).
Fig. 6: Damage chromosome: centromere break (a), double break chromatid (b), single break chromatid (c), gap chromatid (d).
Fig. 7: Triradial chromosomes with one centromere and three terminal chromatid ends (arrow).
Fig. 8: Damages of the centromere belong into the chromatid damage class and are located near the centromere region of the chromosome.
Fig. 10: Different number chromosome damage in metaphase cells obtained from the meristeme root-type cells of onion (Allium cepa): one damaged chromosome (Figure 10a), four damaged chromosome (Fig. 10b), eight damaged chromosomes (Fig. 10c), and whole chromosome complement is damaged (Figure 10d).
Fig. 11: Study map of Smatinsko lake showing the four sample sites for Allium M test to realize.
References
Abu, N.E., Mba K.C., 2011. Mutagenicity testing of pharmaceutical effluents on Allium cepa root tip meristems. J. Toxicol. Env. Health Sci. 3(2), 44-51.
Agresti, A., 1992. A survey of exact inference for contegency tables. Stat. Sci. 7, 131-153.
Akpoilih, B.U., 2012. Fish ecogenotoxicology: an emerging science, an emerging tool for environmental monitoring and risk assessment. Global J. Biosci. Biotechnol. 1(2), 141-151. Al-Sabti, K., 1989. Allium test for air and water
borne pollution control. Cytobios 58, 71-78. Al-Sabti, K., Lloyd, D.C., Edwards, A.A. Stegnar
P., 1992. A survey of lymphocyte chromosomal damage in Slowenia workers exposed to occupational clastogen. Mutat. Res. 280(3), 215-223.
Altenburger, R., Scholzt, S., Smith-Jansen, M., Busch, W., Escher, B.I., 2012. Mixture toxicity rewisited from a toxicogenomic perspective. Environ. Sci. Technol. 46(5), 2502-2522. Ansari, M.I., Malik, A., 2009. Genotoxicity of
agricultural soils in the vicinity of industrial area. Mutat. Res. 673(2), 124-132.
APHA (American public Health association, Eaton, A.D.), 2005. Standard Methods for the Examination of Water and Wastewater. 21st Edn. Water Environment Federation (WET) and American Water Works Association (AWWA). APHA-WEF-AWWA, Washington, D. C. ARSO, 2008. The Quality of the Water in Slovenia.
Agency for the Environment Republic Slovenia. p.93.
Bagatini, M.D., Vasconcelos, T.G., Laughinghouse, H.D., Martins, A.F., Tedesco S.B., 2009. Biomonitoring hospital effluent by the Allium cepa L. test. Bull. Environ. Contam. Toxicol. 82(5), 590-592.
Bakare, A.A., Alimba, C.B., Alabi, O.A., 2013. Genotoxicity and mutagenicity of solid waste leachates: A review. African J. Biotechnol. 12(27), 4206-4220.
Barberio, A., Barros, L., Voltolini, J. C., Mello, M.L.S., 2009. Evaluation of the cytogenetic and genotoxic potential of water from the River Paraiba do Sul, in Brasil, with the Allium cepa
L. test. Braz. J. Biol. 69(3), 837-842.
Cabaravdic, M., 2010. Induction of chromosome aberrations in the Allium cepa test system caused by the exposure of cells to benzo (a) pyrene. Med. Arch. 64(4), 215-218.
Carita, R., Marin-Morales, M.A., 2008. Induction of chromosome aberrations in the Allium cepa test system caused by the exposure of seeds to industrial effluents contaminated with azo dyes. Chemosphere 72(5), 722-725.
Culea, M., Cozar, O., Ristoiu D., 2006. Methods validation for the determination of trihalomethanes in drinking water. J. Mass. Spectrom. 41(12), 1594–1597.
Dragoeva, A., Kalcheva, V., Slanev, S., 2009. Genotoxicity of agricultural soils after one year of conversion period and under conventional agriculture. J. Appl. Sci. Environ. Manage. 13(1), 81-83.
Egito, L.C.M., Medeiros, M.G., De Medeiros, S.R.B., Agnes-Lima, L.F., 2007. Cytogenetic and genotoxic potential of surface water from the Pitimbu river, northeastern/RN Brasil. Genet. Mol. Biol. 30(2), 1-15.
Evans, G.M., Furlong, J.C., 2010. Environmental Biotechnology: Theory and Application. 2nd Edn. Wiley-Blackwell.
Fenech, M., 2000. The in vitro micronucleus technique. Mutat. Res. 455(1-2), 81-95.
Feng, S., Mai, B., Wei, G., Wang, X., 2012. Genotoxicity of the sediments collected from Pearl River in China and their polycyclic aromatic hydrocarbons (PAHs) and heavy metals. Environ. Monit. Assess. 184, 5651-5661.
Firbas P., Amon T., 2014. Chromosome damage studies in the onion plant Allium cepa L. Caryologia 67(1), 25-35.
Firbas, P., 2011. Level chemicals in the environment and cytogenetic damage. Ekslibris. p.307.
Firbas, P., Al-Sabti, K., 1995. Cytosistematic studies on the Charophyta in Slovenia. Arch. Biol. Sci. 47(1-2), 45-54.
Firbas, P., Amon, T., 2013. Allium Chromosome Aberration Test for Evaluation Effect of Cleaning Municipal Water with Constructed Wetlands (CW) in Sveti Tomaţ, Slovenia. J. Bioremed. Biodeg. 4(4), 189-193.
Gillespie, J. M., 2006. Environmental Toxicity of Complex Chemical Mixture. Texas A&M University. p.194.
Grant, W.F., Salamone, M.F., 1994. Comparative mutagenicity of chemicals selected for test in the international program on chemical safety - a collaborative study on plant systems for the collection of environmental mutagens. Mutat. Res. 310(2), 187-209.
Hayes, T.B., Stuart, A.A., Mendosa, M., Collins, A., Noriega, N., Vonk A., 2006. Caracterization of atrazine-induced gonadal malformations in Africa clawed frogs (Xenopus laevis) and comparisons with effects of an androgen antagonist (cyproterone acetate) and exogenous estrogen (17β-estradiol): suport for the demasculinization/feminization hypothesis. Environ. Health Perspect. 114(1), 134-141. Herrero, O., Pérez, M.J.M., Fernández, F.P.,
Carvajal, L.L., Peropadre, A., Hazen, M.J., 2012. Toxicological evaluation of three contaminants of emerging concern by use of the
Allium cepa test. Mutat. Res. 743(1-2), 20-24. Katnoria, J.K., Arora, S., Bhardwaj, R., Nagpal, A.,
2011. Evaluation of genotoxic potential of industrial waste contaminated soil extracts of Amritsar, India. J. Environ. Biol. 32(3), 363-367.
Kaur, M., Arona, S., Katnoria, J.K., 2010. Evaluation of mutagenic potential of food dye (Apple Green). Indian J. Sci. Tehnol. 3, 1203-1209.
Komulainen, H., 2004. Experimental cancer studies of chlorinated by-products. Taxicol. 198(1-3), 239-248.
Leme, M.D., Marin-Morales, A., 2009. Allium cepa
test environmental monitoring: A review on its application. Mutat. Res. 682(1), 71-81.
Majer, J., Grummt T., Ulh M., Knasmuller, S., 2005. Use of plant bioassays for the detection of genotoxins in the aquatic environment. Acta Hydrochim. Hydrobiol. 33(1), 45-55.
Martin, F.M., 2007. Complex mixture that may contain mutagenic and/or genotoxic components: a need to assess in vivo target-site effect(s) associated with in vitro-possitive(s). Chemosphere 69(6), 841-848.
Mazzeo, D.E.C., Fernandes, T.C.C., Marin-Morales, M.A., 2011. Cellular damages in the Allium cepa test system, caused by BTEX mixture prior and after biodegradation process. Chemospere 85(1), 13-18.