Volume 62, 2019, Pages 158–171
SUMO User Conference 2019
Recurrent and Non-recurrent Congestion Based Gridlock
Detection on Chula-SSS Urban Road Network
Ei Ei Mon
1, Hideya Ochiai
2, Chaiyachet Saivichit
1, Chaodit Aswakul
11 Wireless Network and Future Internet Research Unit, Department of Electrical Engineering,
Faculty of Engineering, Chulalongkorn University, Thailand
[email protected], [email protected], [email protected]
2 Information and Communication Engineering, Graduate School of Information Science and
Technology, The University of Tokyo, Japan [email protected]
Abstract
Traffic congestion on not only highways but also complex urban road networks has attracted the attention of many researchers. Traffic congestion growing in urban road net-works is an inevitably important problem especially for populated cities during rush hours. A traffic blockage can be realized as the source of traffic congestion, which can propagate to form queues and sometimes a gridlock. Traffic blockages are triggered by complicated factors ranging from temporal and spatial situations. Recurrent congestion is a traffic congestion that occurs during morning and evening rush hours e.g. from school buses and parent vehicles to drive their children to-and-from schools. In addition, unforeseen, unexpected events that can cause as non-recurrent traffic congestion e.g. car breakdowns, accidents, road maintenance, and severe weather conditions, which can disorder normal traffic flows and reduce road capacity. Traffic blockage may spread its negative impacts to neighbouring upstream and downstream links. And that can lead to the formation of congestion gridlock, which further reduce traffic flow efficiency in a complex urban road network. These problems are vital but often tough to resolve in urban road networks. In this paper, the Chula-Sathorn SUMO Simulator (Chula-SSS) dataset has been used with Simulation of Urban Mobility (SUMO) to simulate recurrent and non-recurrent congestion cases. The detection is based on the information from simulated lane area detectors. For non-recurrent case, lanes are closed to simulate the gridlock occurrences. With the morning case of calibrated Chula-SSS dataset, both recurrent and nonrecurrent congestion based gridlock have been studied with upstream and downstream nearby detectors and prelim-inary results are herein reported upon the gridlock status as detected by using different combinations of traffic jam length and mean speed conditions at both the upstream and downstream detectors of every intersection within the critical looped road segments.
1
Introduction
Recurrent and Non-recurrent Congestion Based Gridlock Detection Ei Ei Mon et al.
stop and go traffic pattern daily in morning and evening rush hours. On the contrary, non-regular events such as road construction or maintenance, broken-down vehicles, accidents and severe weather conditions lead to non-recurrent congestion. Herein, the termincident is used to refer a non-recurrent congestion event with a noticeably negative impact on traffic operations.
Road traffic congestion occurs upon the insufficiency of supply with respect to the demand. Practically, traffic congestion can be triggered from traffic bottlenecks in either recurrent or non-recurrent cases. Normal traffic bottlenecks are located often at strategic locations in a network e.g. at off-ramps, on-ramps and lane drop areas [1]. Congestion from bottleneck originates traffic jams and propagates to neighbouring upstream and downstream vicinities. In [1], the authors have analyzed congestion on not only bottleneck core link but also its neighbouring links by clustering links based on link speed ranks. The paper [2] has developed the regression model for urban traffic networks by using the combinations of traffic indicators like link traffic flows, link lengths and signal phase cycle time.
Regarding the occurrence of non-recurrent incidents, [3] has proposed a non-recurrent con-gestion detection method with spatio-temporal clustering on high link journey time. Moreover, [4] has proposed to use the percentile and space-time scan statistics for non-recurrent incident detection with link journey time lognormal distribution. In addition, [5] has studied the travel demand effects on the non-recurrent incident detection methods by using the estimated link journey time. In [6], the authors have applied a data mining approach to define traffic volume parameters and analyze the impact duration with variable time and season features. The un-expected lane-changing behavior can occur due to non-recurrent incidents, for example, spilled loads and stalled vehicles. In [7], an automatic traffic incident detection and locating method has been proposed on urban road segment in consideration of lane-changing characteristics.
With the aforementioned recurrent and non-recurrent traffic congestion blockages, a dense road network is contributing to congestion at intersections, and from there, it moves to neigh-bouring upstream and downstream links between intersections. Such a situation usually leads to a gridlock, that can potentially reduce traffic efficiency to an almost halting state especially in a complex urban road network. Gridlock is used to describe then a severe road traffic con-gestion where each interrelated intersection in a road network is occupied fully by slow speed vehicles and vehicles cannot move forward even when receiving the green traffic light. Such a situation usually occurs in busiest urban cities.
To the best of our knowledge, gridlock detection based on recurrent and non-recurrent con-gestion scenarios have not been fully studied yet. Existing studies have so far tried to evaluate the impacts of recurrent and non-recurrent congestion with relatively less severities. This re-search study has explored gridlock situation based on recurrent and non-recurrent cases by utilizing the previously calibrated Chula-SSS urban road network [8]. Here, we have investi-gated three fundamental traffic parameters i.e. traffic flow, traffic jam length and vehicle speed, which can be measured by simulated lane area detectors in the Chula-SSS urban road network.
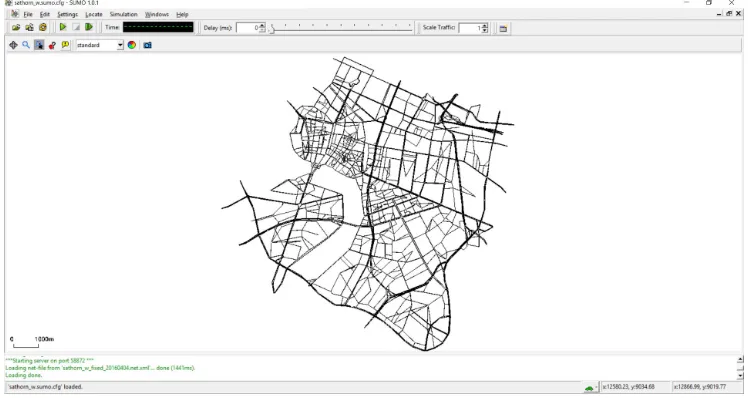
Figure 1: Sathorn model
2
Chula-Sathorn SUMO Simulator (Chula-SSS) and
Grid-lock Simulation
SUMO is an open-source microscopic simulator developed by the German Aerospace Centre DLR in 2001 [9]. SUMO supports the traffic simulation community with full featured suite of modelling utilities, including the traffic control interface (TraCI) tool, which is an API offering the simulation run-time the ability to retrieve values of simulated objects in accessing data of simulated detectors and retrieving state of traffic signal lights.
In this paper, Chula-SSS [8] has been used. This educational tool has been introduced by the Chulalongkorn University’s Sathorn Model project in Bangkok (Thailand) for traffic police and traffic engineer deployment. Chula-SSS supports two calibrated datasets (morning and evening) for the Sathorn road network area. This study has chosen to investigate on the morning case of Chula-SSS, whereby in practice we have observed often the real occurrences of gridlocks in the network. The simulated Chula-SSS consist of 2375 intersection nodes, 4517 edges and 10 signalised intersections as shown in Figure1.
Figure 2 depicts the Sathorn area in the city of Bangkok, Thailand, where heavy traffic congestion can be triggered during rush hours. Sathorn area is one of the most congested area in the busiest business district of Bangkok with tall buildings, schools and universities.
Recurrent and Non-recurrent Congestion Based Gridlock Detection Ei Ei Mon et al.
Figure 2: Critical region in actual Sathorn road network
Figure 3: Critical region in simulated Sathorn road network
0 50 100 150 200 250
22000 24000 26000 28000 30000 32000
traffic flow (v/s)
time (s) (a) 0 5 10 15 20
22000 24000 26000 28000 30000 32000
mean speed (m/s)
time (s) (b) 0 30 60 90 120 150
22000 24000 26000 28000 30000 32000
traffic jam length (m)
time (s) (c) 0 5 10 15 20
0 30 60 90 120 150
mean speed (m/s)
traffic jam length (m)
(d)
Figure 4: (a) traffic flow (b) mean speed (c) traffic jam length (d) traffic jam length vs. mean speed in calibrated Chula-SSS
3
Gridlock Characterization
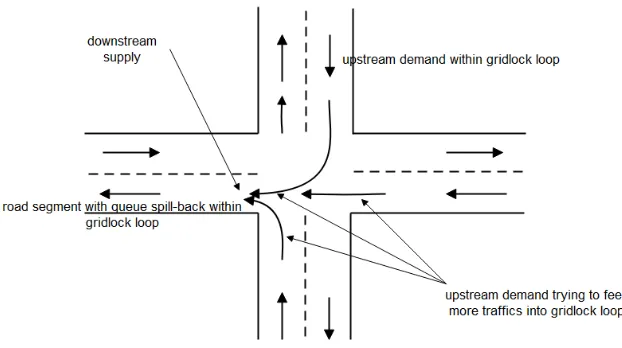
A road network bottleneck is complex to investigate due to the heterogeneous network structure, which makes it different from other normal traffic bottlenecks such as spatially isolated lane drop or on/off-ramp [1]. The demand and supply are mismatched due to the network structure such as upstream links merging to only one downstream link in the intersection area as shown in Figure5. Propagation of bottlenecks can also lead to a large-scale urban network gridlock [10].
A gridlock is defined as the severe congestion state of a critical region that forms a loop
of adjacent edges or intersections in an urban road network. With regard to the bottleneck spillbacks at the intersection, the length of traffic jam would tend to be longer and mean speed would tend to be slower. When a gridlock happens, propagation of traffic jam will occur at every intersection in the critical region. Let∈Lindex all the intersections (also called clusters)
that form a loop of road segments involving in a gridlock.
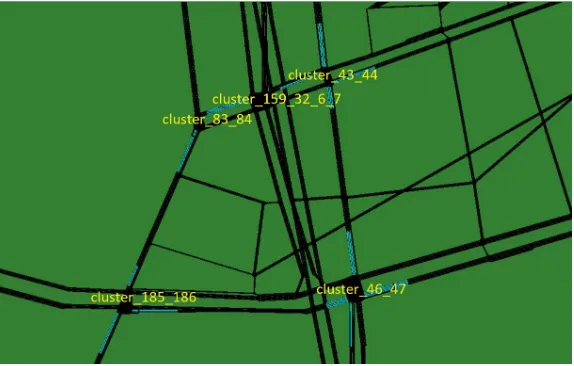
For the Chula-SSS dataset, based on empirical observations of actual gridlocks happening in the morning, there are 5 intersections or clusters in our critical region i.e. cluster 46 47, cluster 185 186, cluster 83 84, cluster 159 32 6 7 and cluster 43 44, as depicted in Figure6.
Recurrent and Non-recurrent Congestion Based Gridlock Detection Ei Ei Mon et al.
Figure 5: Traffic bottleneck at intersection
jam state. And in this paper, we intend to investigate variants to define such intersection jam state. Note also from Figure5that, for each intersection, there is only one downstream detector that monitors the supply or flow capacity of the downstream road segment contained with the gridlock loop. However, for that intersection, there can be multiple upstream detectors that monitor individual potential traffic demands that try to feed into the gridlock loop.
In the characterization of gridlock, traffic jam from one cluster grows and consequently forms a loop. This paper defines the jam state for each intersection with conditions to be
monitored during green lights, namely, 1) mean speed is less than or equal 5 km/h (speed of halt vehicle defined in SUMO) 2) jam length is greater than the threshold (80 % of detector length) 3) mean speed is less than or equal 5 km/h and jam length is also higher than the threshold. That intersection is considered in itsjam state when both its downstream detector and all its upstream detectors give their output readings that satisfy these three choices of conditions. Since the downstream detector can use three conditions and all the upstream detectors can also use three conditions, in this paper, we have studied all the combinations of totally nine upstream-downstream detector conditions. In [11], the travel time prediction performance of the artificial neural network with different inputs such as speed, occupancy, and volume have been studied. To the best of our knowledge, however, existing studies have not reported yet which indicator is the good indicator to define jam state at an intersection by considering congestion state both at upstream and downstream. Therefore, this paper has considered using not only speed and jam length separately, but also these indicators simultaneously to try testing variants of detection jam state of intersection. For explanatory simplification, as shown in Figure6, consider one downstream detector directly within the gridlock loop. From this detection at every intersection, we define the gridlock status to be 1 if all intersections
∈L are in the jam state, and we define the gridlock status to be 0, otherwise. Here, we have
investigated the gridlock status with the two categories of 0 and 1 as a binary classification of gridlock detection. Multiclass classification of the severity level of gridlock has not been investigated but warrants a work worthy of future investigations.
Figure 6: Location of upstream and downstream lane area detectors at each of the main inter-sections to detect gridlock in Sathorn critical region
and 50 m length for downstream detectors in all simulated scenario examples. These detectors are shown in blue-coloured areas in Figure6.
4
Recurrent Based Gridlock Simulation Example
Recurrent based gridlock happens on daily basis in both morning and evening rush hours. This gridlock phenomenon has been intentionally disabled during the calibration attempt of Chula-SSS to find the optimal mobility model parameters. To investigate the gridlock in a recurrent case, we have included two extra routes to our critical region of Chula-SSS with traffic flows of 2125 and 1500 vehicles per hour, with their routes as shown in Figure 7. Here, we have designed our loading scenario with the two additional traffic routes that could exhibit the case of gridlock during morning rush hours. In Figure 8c, all the vehicles wait with long queues after 26000 s (7:13 am) in our critical region. And, nearly total length of critical region has been occupied by all vehicles. At this gridlock time, traffic flow and mean speed of the whole critical region become zero as illustrated in Figures8a and8b. Also, Figure8dillustrates the negative correlation of traffic patterns for traffic jam length and mean speed in this recurrent case in the gridlock region. This relationship resembles the well known fundamental diagram of traffic flow theory that has been well addressed for a homogeneous road segment. Here, we have extended the relationship to account for the accumulative effects from all corresponding road segments within the critical gridlock loop.
Recurrent and Non-recurrent Congestion Based Gridlock Detection Ei Ei Mon et al.
Figure 7: Additional two traffic routes in Sathorn critical region to mimic parent cars driving to drop-off kids at their schools in the morning
overall network capability in handling at most 233 vehicles per second of total traffic flow in all involving intersections within the whole gridlock loop.
5
Non-recurrent Based Gridlock Simulation Example
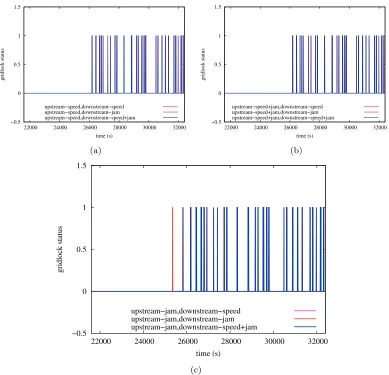
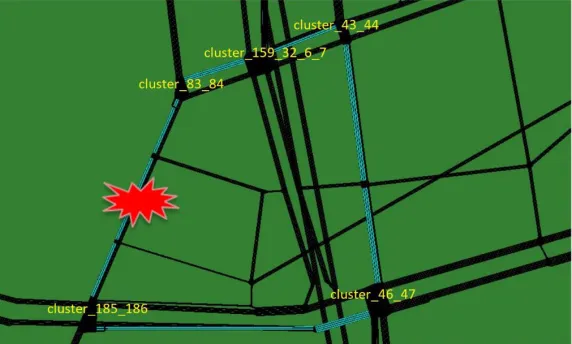
A gridlock can also form because of non-recurrent incidents such as vehicle crashes. Traffic incidents can be defined as abnormal vehicle movements that discontinue the traffic flow. We have investigated gridlocks in this scenario by interrupting the flow at the location displayed in red color in Figure11. Here, we have closed one out of two lanes on the road segment for two times (22500 s to 23700 s and 25200 s to 26400 s) with the duration of 20 mins each. Also, the same extra traffic routes as in the recurrent case has been used in this non-recurrent case.
It can be noticed from Figures12aand12bthat traffic flow and mean speed drop gradually in our critical region when incidents happen. The first gridlock forms around 26000 s. At this time, traffic flow and mean speed become zero and short queue formed as illustrated in Figures12a,
12band 12c. Also, Figure12d illustrates the negative correlation of traffic patterns for traffic jam length and mean speed in non-recurrent case when the gridlock happens. According to these patterns, the first gridlock occurs because of the impact of lane closing events. This is our expectation of non-recurrent based gridlock. After two incidents have happened, the second gridlock occurs in our critical region when total traffic flow is mismatched with the capacity of our road network.
0 50 100 150 200 250
22000 24000 26000 28000 30000 32000
traffic flow (v/s)
time (s) (a) 0 5 10 15 20
22000 24000 26000 28000 30000 32000
mean speed (m/s)
time (s) (b) 0 30 60 90 120 150
22000 24000 26000 28000 30000 32000
traffic jam length (m)
time (s) (c) 0 5 10 15 20
0 30 60 90 120 150
mean speed (m/s)
traffic jam length (m)
(d)
Figure 8: (a) traffic flow (b) mean speed (c) traffic jam length (d) traffic jam vs. mean speed in recurrent case
of the case without this incident occurrence, as expected. But unexpectedly, the vehicles per second supportable by the recurrent case is not much higher than that when the incident has been injected. An explanation can be that Chula-SSS scenario in Bangkok is already heavily loaded so having one more incident occurrence does not hurt the jam situation significantly higher that its norm. This confirms then the challenges of our attempts in trying to tackle this Chula-SSS traffic alleviation and gridlock resolution problems.
6
Conclusion
Recurrent and Non-recurrent Congestion Based Gridlock Detection Ei Ei Mon et al.
−0.5 0 0.5 1 1.5
22000 24000 26000 28000 30000 32000
gridlock status
time (s) upstream−speed,downstream−speed upstream−speed,downstream−jam upstream−speed,downstream−speed+jam
(a)
−0.5 0 0.5 1 1.5
22000 24000 26000 28000 30000 32000
gridlock status
time (s) upstream−speed+jam,downstream−speed upstream−speed+jam,downstream−jam upstream−speed+jam,downstream−speed+jam
(b)
−0.5 0 0.5 1 1.5
22000 24000 26000 28000 30000 32000
gridlock status
time (s) upstream−jam,downstream−speed upstream−jam,downstream−jam upstream−jam,downstream−speed+jam
(c)
Figure 9: Recurrent based gridlock detection
Figure 10: Number of time steps with gridlock detected by each condition in recurrent case
Figure 11: Non-recurrent cases on Sathorn model
7
Acknowledgments
The authors are gratefully acknowledges to AUN/SEED-Net Scholarship and all members of smart mobility project including Mr.SorawitAssarattana in Department of Electrical Engineer-ing, Chulalongkorn University, Bangkok, Thailand.
References
[1] H. Qi, M. Chen, and D. Wang, “Recurrent and non-recurrent bottleneck analysis based on traffic
state rank distribution,”Transportmetrica B: Transport Dynamics, pp. 1–20, 2017.
Recurrent and Non-recurrent Congestion Based Gridlock Detection Ei Ei Mon et al. 0 50 100 150 200 250
22000 24000 26000 28000 30000 32000
traffic flow (v/s)
time (s) (a) 0 5 10 15 20
22000 24000 26000 28000 30000 32000
mean speed (m/s)
time (s) (b) 0 30 60 90 120 150
22000 24000 26000 28000 30000 32000
traffic jam length (m)
time (s) (c) 0 5 10 15 20
0 30 60 90 120 150
mean speed (m/s)
traffic jam length (m)
(d)
Figure 12: (a) traffic flow (b) mean speed (c) traffic jam length (d) traffic jam vs. mean speed in non-recurrent case
[3] B. Anbaroglu, B. Heydecker, and T. Cheng, “Spatio-temporal clustering for non-recurrent traffic
congestion detection on urban road networks,”Transportation Research Part C: Emerging
Tech-nologies, vol. 48, pp. 47–65, 2014.
[4] B. Anbaro˘glu, T. Cheng, and B. Heydecker, “Non-recurrent traffic congestion detection on
hetero-geneous urban road networks,”Transportmetrica A: Transport Science, vol. 11, no. 9, pp. 754–771,
2015.
[5] B. Anbaroglu, B. Heydecker, and T. Cheng, “How travel demand affects detection of non-recurrent
traffic congestion on urban road networks,” inXXIII ISPRS Congress, Commission II, vol. 41,
pp. 159–164, Copernicus Gesellschaft MBH, 2016.
[6] C. Sun, J. Hao, X. Pei, Z. Zhang, and Y. Zhang, “A data-driven approach for duration evaluation of
accident impacts on urban intersection traffic flow,” inIntelligent Transportation Systems (ITSC),
2016 IEEE 19th International Conference on, pp. 1354–1359, IEEE, 2016.
[7] J. Ren, Y. Chen, L. Xin, J. Shi, and H. Mahama, “Detecting and locating of traffic incidents in
a road segment based on lane-changing characteristics,” Transportmetrica A: transport science,
vol. 13, no. 10, pp. 853–873, 2017.
[8] C. Aswakul, S. Watarakitpaisarn, P. Komolkiti, C. Krisanachantara, and K. Techakittiroj, “Chula-sss: Developmental framework for signal actuated logics on sumo platform in over-saturated
Trans-−0.5 0 0.5 1 1.5
22000 24000 26000 28000 30000 32000
gridlock status
time (s) upstream−speed,downstream−speed upstream−speed,downstream−jam upstream−speed,downstream−speed+jam
(a)
−0.5 0 0.5 1 1.5
22000 24000 26000 28000 30000 32000
gridlock status
time (s) upstream−speed+jam,downstream−speed upstream−speed+jam,downstream−jam upstream−speed+jam,downstream−speed+jam
(b)
−0.5 0 0.5 1 1.5
22000 24000 26000 28000 30000 32000
gridlock status
time (s) upstream−jam,downstream−speed upstream−jam,downstream−jam upstream−jam,downstream−speed+jam
(c)
Figure 13: Non-recurrent based gridlock detection
Recurrent and Non-recurrent Congestion Based Gridlock Detection Ei Ei Mon et al.
port Systems, vol. 2 ofEPiC Series in Engineering, pp. 67–81, EasyChair, 2018.
[9] M. Behrisch, L. Bieker, J. Erdmann, and D. Krajzewicz, “Sumo–simulation of urban mobility,” in The Third International Conference on Advances in System Simulation (SIMUL 2011), Barcelona, Spain, vol. 42, 2011.
[10] C. F. Daganzo, “Urban gridlock: Macroscopic modeling and mitigation approaches,”
Transporta-tion Research Part B: Methodological, vol. 41, no. 1, pp. 49–62, 2007.
[11] X. Zeng and Y. Zhang, “Development of recurrent neural network considering temporal-spatial
input dynamics for freeway travel time modeling,”Computer-Aided Civil and Infrastructure