REMOVAL OF METHYLENE BLUE FROM AQUEOUS SOLUTION USING ACTIVATED RICE HUSK
BIOCHAR:
ADSORPTION ISOTHERMS, KINETICS AND ERROR ANALYSIS
*NWORIE, F. S
1., NWABUE, F.I
1., OTI, W., MBAM, E
1AND NWALI, B.U
21Department of Industrial Chemistry, Ebonyi State University, Abakaliki, Nigeria 2Department of Biochemistry Ebonyi State University, Abakaliki, Nigeria
ABSTRACT
Removal efficiency of methylene blue (MEB) from aqueous media was studied under different experimental conditions of pH, contact time and initial concentration of the adsorbate. Activated rice husk biochar (ARHB) was characterized using BET surface area and XRD. The XRD diffraction indicated amorphous nature of the biochar with pore size (cc/g) and pore surface area (m2/g) of 9.369 and 27.32 respectively from BET surface area plot. Equilibrium isotherm based on coefficient of non- determination indicated the following order as best fit model: Hill˃ Kiselev ˃Elovic ˃Flory-Huggins > Langmuir > Jovanovic >Harkin-Jura >Freundlich > Henry > Temkin >Redlich Peterson>Durbinin-Kaganer Redushkevich>Hill–de Boer > Fowler–Guggenheim. Based on the highest correlation coefficient and the lowest values of the error functions applied to the kinetic models, Weber and Morris intra-particle diffusion and liquid film diffusion were noted to be in control of the sorption rate. The MEB sorption capacity of the activated biochar was 356.99 mmolkg-1 which was in the range of commercially available
activated carbons and other biosorbents.
Keywords: MEB, isotherm models, kinetic models, error analysis, ARHB.
INTRODUCTION
Poor management and disposal of solid agricultural wastes is the bane of developing nations Nigeria inclusive. The careless and indiscriminate deposition in water bodies, in refuse dumps and combustion of the agricultural solid wastes poses serious threat to ecosystem. The quality of aquatic system including flora and fauna, soil and soil micro-organisms, air and aesthetics are affected adversely presenting itself as a serious environmental concern [1-4].
Recently, the development and use of various adsorption materials, techniques and technologies for the removal of contaminants from aqueous media have increased [1-15]. Many researchers [15-27] have used many agricultural based waste
materials such as Retama Raetam plant, saw dust, wheat bran, Jatropha Curcas
and Terminalia Catappa and unmodified saw dust as an alternative cheaper and affordable substitute for application as sorbent for adsorption of contaminants from aqueous media. Rice husks are waste materials from rice processing and are usually discarded indiscriminately or burnt sometimes leading to eutrophication and green house aerosols, carbon (IV) oxide, carbon(II)oxide, methane, nitrogen oxides and volatile organics which present serious health and climatic changes [27-36]
Varieties of synthetic anionic and cationic dyes are routinely used by chemical industries such as leather, textile, printing, food, pulp and paper [27].
The dyes which are of enormous quantity and usually coloured are released into water bodies as effluents. Studies [28] reported that over eight thousand tons
of commercial dyes are manufactured yearly of which azo dyes constitute over fifty percent of the entire produce. The manufacture, utilization and migration of azo dyes poses serious threat to ecosystem since it has complex aromatic structure resistant to biodegradation or structural modification on exposure to light, temperature or common oxidizing agents [27]. The non- degradability
of azo dyes leads to bioaccumulation in organisms and could be responsible for various dysfunctional observations such as shock, cyanosis, vomiting, tissue necrosis and increased heart beat [7, 27]. Recently, due to their hazardous,
deleterious and chromogenic nature, attention of researchers and those in the industry has been on the rise on how to completely eliminate industrial effluents associated with dyes. Various methods have been applied for the removal of dyes and include chemical coagulation, oxidation, flocculation, ozonation, biological process, membrane based separation method, photocatalytic process, sonochemical process, electrochemical process and adsorption [28-35].
Comparison of the methods by researchers [5,27] for dye removal implicated
adsorption as the most efficient, effective and green. Similarly, among the sorbents, activated carbon has shown promising outcome and extensively studied but its high cost is a strong limitation to researchers prompting a search for an alternative low cost sorbent of equivalent effectiveness, efficiency and environmentally benign.
To arrest the dangers posed by indiscriminate MEB disposal from industries, rice husk biomass was converted into an activated biochar and used as an economical, effective and environmentally benign solid adsorbent
capable of decontaminating aqueous media due to its high adsorption capacity, increased surface activity, surface area [6] and amorphous nature. The use of
activated biochar for adsorption could be regarded as a control technique that is environmentally friendly and removes environmental toxicants at low concentration from aqueous media such as waste water, effluents and drinking water.
To understand the adsorption process involving mass transfer and surface interaction, one, two and three adsorption isotherm models were applied as well the kinetic models for a better optimization of the industrial design with incorporation of error of analysis to further strengthen the applicability of the adsorption process. The objective of the present study include (i) to prepare an activated biochar of rice husk biomass and characterize it using x-ray diffraction(XRD and Braunauer-Emmett-Teller (BET) surface area to ascertain the nature of the surface a key function of its suitability for use in adsorption (ii) to determine the adsorption performance of the sorbent for a cationic dye, MEB and assess the adsorption conditions thereof (iii) to evaluate the sorption mechanism of MEB onto the ARHB (iv) to assess the applicability of the sorption mechanism in the process design using error analysis.
MATERIALS AND METHODS Adsorbent
Rice husk was collected from Abakaliki rice mill in polyethene bags and thereafter cleaned, washed severally with double distilled water and dried under the sun and then in a temperature of 105 oC for 5 h in an oven. Exactly 400 g of
the dried biomass was subjected to pyrolysis at 550 oC in a N
2 environment in
a furnace for 2 h [39]. The formed biochar were removed, ground into powder,
sieved, rinsed with double distilled water and finally dried at 60 oC. Activation
of the biochar was effected using a portion of the carbonized rice husk biochar and 1M HNO3 added with continuous stirring for 1h as described elsewhere
[40]. The mixture was diluted with double distilled water and decanted several
times and then washed with double distilled water until the pH was tested to be 7. The activated biochar was then dried in an oven (Model DHG) at 110 °C [40]
and kept for further studies.
Surface area and pore size were determined using Braunauer-Emmett-Teller (BET) Micrometrics ASAP 2020 system. The sample for BET was first dried under vacuum (10-4 bar) at 127 °C for 20 h and then degassed under ultrahigh vacuum (10-9 bar) at 120 °C for 16 h. The sample was back-filled with nitrogen, transferred to the analysis system, and then again degassed under ultrahigh vacuum at 100 °C overnight. The morphology of the adsorbent was determined with Bruker® D8 Discover x-ray diffractometer, equipped with a Lynx Eye detector, under Cu-Ka radiation (l ¼ 1.5405 Å) and data collected in the range of 2θ =10 to 100o, scanning rate at 0.010omin-1,192 s per step
and samples placed on a zero background silicon wafer slide. Proximate compositions of the biochar (ash, protein, nitrogen) were determined using Kjeldahl method [41] whereas the lignin and cellulose content were determined
as described elsewhere [42].
Merck (Germany). MEB (3, 7-bis(dimethylamino)-phenazathionium tetramethylthionine chloride of molecular formula C16H18N3SCl.3H2O and
molecular weight 373.9 g/mol is shown in Figure 1. Stock solution (100 mg dm
-3) of MEB was made by dissolving a measured exact amount into pH solution
of 7. Solutions for other studies were taken and diluted as required before use.
Figure 1: Structure of MEB.
Batch sorption studies
Investigation into the sorption of MEB onto ARHB was carried out using batch extraction method. Exactly 0.1 g of ARHB was measured into a series of 250 cm3 conical flasks with 10 cm3 MEB solution of different concentrations
(3.1-7.75 ⨯10-6 mg dm-3) added previously and at pH of 6.7. The conical
flasks containing the mixture were equilibrated mechanically in a mechanical shaker (Remi equipment) at fixed speed of 150 rpm and 303 K for 150 min to attain equilibrium. The conical flask containing the mixtures were removed at predetermined intervals of time, filtered using Whatman filter paper No 1 and centrifuged at 5000 rpm for 4 min using Gulfex medical scientific England centrifuge model 800D and concentration of MEB determined spectrophotometrically at wavelength of 670 nm using Jenway Uv – Vis spectrophotometer model 6105.The effect of pH on the adsorption of MEB onto the rice husk biochar was studied by varying the pH from 1- 10 effected using HCl and NH3 while keeping other parameters constant. Exactly 0.1 g of
the ARHB was mixed with 10 cm3 of 7.75 ⨯10-6 mg dm-3 MEB and treated as
described elsewhere [41].
The amount of MEB removed at equilibrium qe (mg/g) was evaluated
using equation 1, the percentage MEB (%) sorbed by ARHB evaluated using equation 2 while the quantity of MEB adsorbed at time t by AHRB qt (mg/g)
was evaluated from equation 3.
RESULTS AND DISCUSSION Nature of sorbent
The chemical proximate composition of ARHB was determined using Kjeldahl method [39] and the result indicated that it contains high percentage
of lignin and cellulose of 39.91%, ash content of 47.0%, protein content of 11.29 % and nitrogen content of 1.80%. The result obtained on the percentage of lignocellulosic polymers was consistent with the study of Kezerle et al.,[39].
To investigate the nature of the surface of ARHB in relation to its adsorptivity, BET surface area was performed. Surface area and pore size of the ARHB determined from BET surface area plot are 9.369 cc/g and 27.32
m2/g respectively and represented in Figure 2. The XRD patterns of ARHB
(Figure 3) contained only a broad peak that is characteristic of amorphous phase silica common among biochars carbonized below 600oC (38). BET
surface area analysis and XRD analysis of ARHB showed amorphous nature and nanosize forms of the biochar respectively [2, 12, 49]. Studies [2] have shown
that physicochemical characteristics like surface area and pH influence environmental usefulness, sorption capacity and applicability of biochars. The large adsorption capacity of the MEB could be as a result of the large surface area and amorphous nature of the ARHB leading to improved capacity to capture the dye from the media [12,42].
1
2
3
Where Co(mg/L), Ce (mg/L),Ct (mg/g),V(L) and M (g) represents the initial concentration of MEB, equilibrium concentration of MEB, concentration of MEB at time t, volume of aqueous media and mass of the dry sorbent respectively. Adsorption processes was modeled using one, two and three parameter linear adsorption models of Hill, Kiselev, Elovic, Flory-Huggins, Langmuir, Jovanovic, Harkin-Jura, Freundlich, Henry, Temkin, Redlich Peterson, Durbinin-Kagamer Redushkevich, Hill–de Boer, Fowler– Guggenheim. The kinetics of sorption of MEB onto ARHB was studied by plotting the equation of line best fit applied to pseudo-first order, pseudo- second order, Elovich, Weber and Morris, Bangham and Liquid film diffusion models. To estimate the adequacy, applicability, design and best fit model for the process, error analysis was performed using sum square errors, average relative error, standard error of estimate, coefficient of determination, coefficient of non- determination, non-linear-chi square test and Marquardts percentage standard deviation. The itemized experiments were conducted in triplicates and mean values were found reproducible and applied in further analysis of data.
Point of zero charge determination pHzpc
The sorbent dependence on the surface nature and charge of the adsorption process was done as described elsewhere [27] with slight modification in pH
adjustment using 0.1 M HCl / NH3 instead of 0.1 M HCl / NaOH solutions. The
value was determined to be 6.7.
Figure 2: BET surface area of ARHB.
Figure 3: X-ray diffraction pattern of ARHB.
pH effect on the adsorption of MEB
One of the most significant factors that influence adsorptivity potential of biochar is its pH [2, 41]. Many characteristics of biochar that influence its capability
to capture particulates such as extent of ionization of solution adsorbate, charge on the sorbent surface and sorbent functional groups resident on the reactive sites [43-45]. The influence of pH on the adsorption of MEB onto ARHB was
investigated by varying the pH between 1-10 at 303 K for 150 min and result shown in Figure 4. The highest percentage of the cationic dye MEB adsorbed representing the maximum adsorption capacity was 80.69 % at pH 8 and lowest percentage was 22.8 % at pH 3. Above pH 8, the adsorption remained fairly constant. This observation is consistent with the study by Kezerle et al., [39] on
adsorption of MEB onto lignocellulosic wastes. The adsorption was observed to be low at acidic pH values as against the basic pH regions as observed in other studies [7,41] probably because of the decreased electrostatic forces of
recorded maximum adsorption at pH 8 but their minimum was at pH 4 and 2 respectively. The differences could be that buffered solution was used and could have interfered with the adsorption process. As pH increased from 6 and above the negative charges on ARHB increased due to increase in negative sites. This led to increased adsorption as electrostatic attraction was increased and OH- presence at the basic region encouraged adsorption. The equilibrium
shift as observed could be associated with adsorbent surface functional group dissociation and an alteration on adsorption [22]. The point of zero charge of
ARHB was determined to be 6.8 and defines the favorable removal of MEB in a given media. Solution pH greater than pHzpc entails cation attraction due to
ARHB been negatively charged whereas at solution pH lower than pHzpc means
anions are attracted and positive charge on the surface of ARHB [46]. Greater
removal of MEB was observed at basic pH as there is decrease in the number of positive sites and increase in negative charges at the basic pH region.
with the KHE regarded as Henrys adsorption constant as 94.48 evaluated from
Figure 7. The result indicated that the model could not simulate the adsorption process in comparison to other models studied and that since liquid film and intraparticle diffusion control the sorption mechanism, surface coverage is of high consideration and plays significant role.
Figure 4: Effect of pH on the adsorption of MEB.
Effect of initial MEB concentration and time of contact
The initial concentration of adsorbate plays significant role in adsorption studies. The effect of initial concentration of MEB on the adsorption capacity of ARHB was investigated by varying the initial concentration from 3.1 to 7.75⨯10-6 mg/L and the result displayed in Figure 5. From the plot, it could
be observed that the amount of MEB adsorbed increased as the concentration increased. This observation is in line with the studies [38,26] on the removal of
MEB through brewers spent mint adsorptive capacity and retama raetam. Sorption capacity increased as the initial MEB concentration increased from 0.095 mg/g to 0.2 mg/g and equilibrium was attained indicating increased fractional MEB adsorption. The transport of MEB molecules to interior regions of ARHB controls the adsorption process and liquid film diffusion and intraparticle diffusion mechanisms could be responsible as identified in kinetics studies.
The variation of MEB adsorbed versus time of contact shown in Figure 6 indicated that the adsorption increased with time of contact until equilibrium was reached. There was observed rapid increase in the adsorptive removal of MEB at the initial period with consequent regress near equilibrium. Therefore at the beginning of the adsorption, enough active sites are present and are gradually filled as time increased clogging the sorption sites and an observed reduction or unavailability of free site. The observed increase in MEB removal could be due to the nanosize and amorphous nature of ARHB as large surface area are exposed per unit mass of the ARHB. This observation is in agreement with the studies [15, 24, 27, 41] on the removal of azo dyes from various agricultural
waste biochar.
Adsorption equilibrium
The distribution of MEB between the solid and liquid phases at equilibrium of adsorption estimates to a high extent the adsorption capacity of ARHB, its effectiveness and efficiency and was evaluated using one, two and three parametric models of Henry, Kiselev, Elovic, Flory-Huggins, Langmuir, Jovanovic, Harkin-Jura, Freundlich, Hill, Temkin, Redlich Peterson, Durbinin-Kagamer Redushkevich, Hill–de Boer and Fowler–Guggenheim.
Henry sorption model: The Henry adsorption model a one parametric
linear adsorption model operational at low concentration of adsorbate and without consideration of surface coverage is represented in Figure 7 as a plot of qe against Ce with linear equation represented in Table 1. The model has
correlation coefficient of 0.9476 and coefficient of non- determination of 0.0524
Figure 5: Effect of initial MEB concentration on the adsorption ARHB.
Figure 6: Effect of time of contact on the sorption of MEB onto ARHB.
Figure 7: Henrys adsorption isotherm for the sorption of MEB onto
ARHB.
Langmuir sorption model: Adsorption is treated as specific to
homogenous site, inculcates monolayer coverage without adsorbates in the surface of the adsorbent plane transmigrating due to uniform energy as shown in equation 4 [27,41].The reversibility of the adsorption and presence of
4 7
Where qm is maximum adsorption capacity of ARHB (mg/g), b the
Langmuir constant related to free interaction binding energies of the adsorption (L/mg), qe the quantity of MEB adsorbed per specific unit mass of ARHB
(mg/g) and Ce the equilibrium solute concentration (mg/L).
The data simulated using Langmuir equation showed as a plot of Ce/qe versus Ce(Figure 8) shows high correlation coefficient (R2) of 0.9807 and
indicates very high sorption constant for ARHB(356.99 mmolkg-1) which was
in the range of commercially available activated carbons(101-395 mmolkg-)
and other biosorbents (11-680 mmolkg-) [46,49]. The dimensionless separation
factor RL a measure of the desirability and favorability of the model and the
Langmuir parameter b (Langmuir isotherm model constant) was evaluated using Hall equation (Equation 5) [27].
5
Where Xo is the initial MEB concentration. The value of RL is essentially
important and defines the isotherm to be linear (RL = 1), unfavorable (RL
> 1) and favorable (0 < RL < 1) [1]. The study indicated RL value of 0.014 a
confirmation that the adsorption of MEB onto ARHB was favorable.
Figure 8: Langmuir isotherm model for the sorption of MEB onto ARHB.
Freundlich Isotherm
Freundlich sorption isotherm model views adsorption to be non-ideal, takes place in a heterogeneous multilayer surface with no limited degree of adsorption sites and energies exponentially or non-uniformly distributed [27,42].
Freundlich isotherm is expressed equation in 6 and the linear form in Table 1, n is the adsorption intensity representing the favorability of the process and measures the degree at which the model deviates from linearity and Kf the
adsorption capacity representing the adsorptive bond strength obtained as the slope and intercept respectively and shown as the linear plot of In qe against In Ce illustrated in Figure 9. Though the value of correlation coefficient was high 0.9574 and coefficient of non-determination 0.0426 from Table 4 and Figure 9, the determinant n value that indicates any variable that projects regress in MEB –ARHB interaction with surface density increase is likely unfavorable
[2, 27].
The values of n and Kf are presented in Table 4 and shows that the
Freundlich adsorption process cannot simulate the data since the value of n is less than one [27].
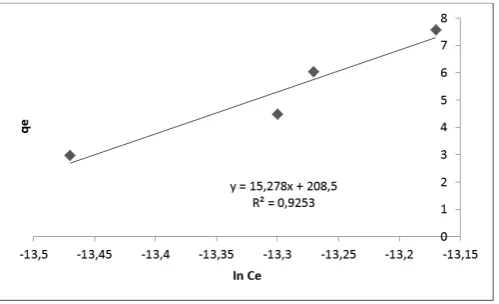
6 Temkin isotherm
This model which is co-operatively applied under the condition of intermediate mode of sorbate concentration considers the fall in the heat of sorption of molecules in the layer to decrease linearly with area of coverage owing to sorbent or sorbate interaction instead of logarithmic [1]. The linear
form of Temkin isotherm model is shown in equation 7 and in Table 1.
Figure 9: Freundlich isotherm for the sorption of MEB onto ARHB.
From equation 7, β is related to the heat of adsorption and A is the equilibrium binding constant. The plot of qe against In Ce gives the slope
and intercept as AT and β respectively. The values of R2, coefficient of
non-determination and the constants are presented in Table 4 and Figure 10. The high value of R2 suggests that the model satisfy the experimental data and
similar results was obtained in the adsorption of methylene blue with Miswak leaves by another author [27].
Figure 10: Temkin isotherm plot for the sorption of MEB onto ARHB.
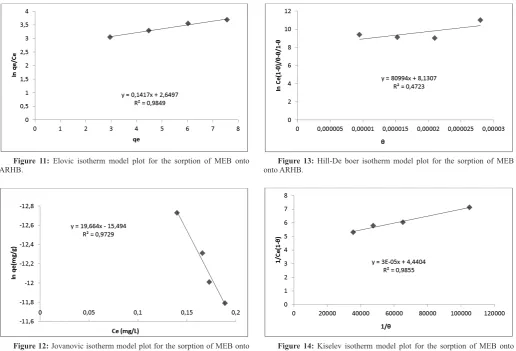
Elovic isotherm model
Elovic model is based on multilayer adsorption and adsorption increases exponentially with adsorption site [1]. Elovic isotherm model is represented in
equation 8 and the linear form in Table 1. 8
Elovic constants Km and KE representing maximum adsorption capacity
and adsorption constant respectively are evaluated from the slope and intercept of the plot of In (qe/Ce) versus qe (Figure 11)and the values shown in Table 4.
The value of R2 0.9849 is high with low coefficient of determination of 0.015
as shown in Table 4 but lower than Hill isotherm model which represents monolayer adsorption process. However, the low value of the adsorption capacity as shown in Table 4 indicates that the adsorption does not fit the Elovic model and is not multilayer.
Jovanovic isotherm model: The Langmuir isotherm model is involved
with allowance to mechanical interaction. The linear form of the model is shown in Table 1 and the correlation coefficient of 0.9729 obtained from the plot of In qe versus Ce (Figure 12) was high enough but lesser than that
Figure 11: Elovic isotherm model plot for the sorption of MEB onto
ARHB. onto ARHB. Figure 13: Hill-De boer isotherm model plot for the sorption of MEB
Figure 12: Jovanovic isotherm model plot for the sorption of MEB onto
ARHB.
Hill- de Boer isotherm model
The adsorbing molecules are considered to be mobile with allowance of lateral interaction [6]. The linear form of the model is shown in Table 1
with K1 and K2 as Hill-de Boer constant (Lmg-1) and energetic constant of
the interactional effect between the adsorbed sorbate molecules (KJmol-1)
respectively. From Table 1, Ɵ, R and T represents the fractional coverage, the universal gas constant (KJmol-1K-1) and temperature (T) respectively. From
table 4, the value of K2 is positive but very small indicating weak lateral
interaction, affinity and attraction between the adsorbed molecules. From the plot of In[Ce(1- Ɵ)/ Ɵ]- Ɵ/(1- Ɵ) versus Ɵ (Figure 13), the low value of coefficient of correlation (poor linearization) (0.4723) and as also observed in Fowler-Guggenheim model isotherm (0.3933) makes further interpretation of the model to be avoided and further iterative computer based task to be invoked. The comparison of this model with Fowler-Guggenheim model stems from the fact that Hill –de Boer model verifies assumptions of the earlier model and only applicable to fractional surface coverage evaluated from highest adsorption capacity [6].
Kiselev Isotherm Model
The model applicable only when the surface coverage (Ɵ > 0.68) was evaluated from Freundlich model maximum adsorption capacity and inculcates monomolecular localized adsorptive layer. The linear form of the model is shown in Table 1. The plot of 1/ Ce(1- Ɵ) versus 1/ Ɵ (Figure 14) gives the Kiselev equilibrium constant (Ki) (Lmg-1) and Kn the equilibrium constant for
complexation between adsorbent and adsorbate molecules and represented in Table 4. The simulated data as shown in Figure 14 gives high correlation coefficient value (0.9855) with low coefficient of non-determination (Table 4). The value of Kn (Table 4) is positive (1.66⨯10-3) indicating the formation
of complex between the adsorbed species [6] and proved that the model could
simulate the data.
Figure 14: Kiselev isotherm model plot for the sorption of MEB onto
ARHB.
Harkin-Jura Isotherm model
The likelihood of multilayer adsorption due to heterogeneous pore distribution on adsorbent surface is the major consideration of this model [5].
The linear form of the model is presented in Table 1.The plot of 1/qe2 versus log
Ce (Figure 15) gave correlation coefficient of 0.9610 with B and A as Harkin-Jura Isotherm model constants. The R2 value was high but lesser than that of
monomolecular adsorption models of Kiselev and could not be the best fit for the adsorption.
Figure 15: Harkin-Jura isotherm model plot for the sorption of MEB onto
ARHB.
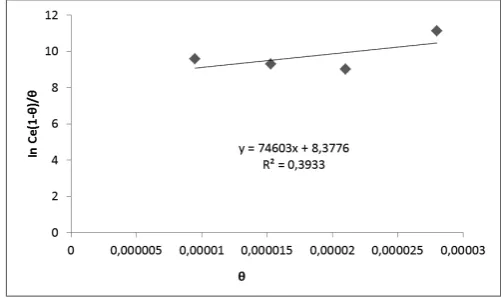
Fowler-Guggenheim Isotherm Model
between species adsorbed on neighboring sites [4].The energy of interaction
or heat of adsorption is constant and the fractional surface coverage of the biosorbent is independent of the heat of adsorption, the entropy exhibited on the molecular distribution of the adsorbate species do not suffer much alteration [6].
The surface coverage obtained from Langmuir maximum adsorption capacity is only applicable to the model if Ɵ < 0.695(6). The linear form of the model is shown in Table 1 and the plot of In Ce(1- Ɵ)/ Ɵ versus Ɵ in Figure 16. The constant KFG represents the Fowler-Guggenheim equilibrium constant (Lmg -1) an interaction between adsorbent and adsorbate molecules, W the heat of
adsorption representing the empirical interaction energy of the adsorbed two species existing in close by sites (KJmol-1), R the molar gas constant (8.314 J
mol-1K-1), T the thermodynamic temperature (K) and Ɵ the fractional surface
coverage. From Figure 16, there was observed low correlation coefficient with positive value of W indicating unattractive and repulsive interaction between the adsorbed molecules [1]. This entails the heat of adsorption and the loading
of adsorbate species are inversely related an indication that increased loading leads to decreased interaction between adsorbed species [4]. In this present case,
the poor linearization as obtained further strengthens the inability of the model to simulate the data.
Figure 16: Fowler-Guggenheim isotherm model plot for the sorption of
MEB onto ARHB.
Flory-Huggins Isotherm Model
The model considers the extent of surface coverage properties of the adsorbate on the adsorbent material [5] and is expressed linearly as shown in
Table 1. From the linear expression in Table 1, Ɵ represents the extent of surface coverage, nFH the adsorbent number present in the sorption zone and
KFH the Flory-Huggins constant (Lmol-1). Consequently, (nFH >1) indicates
multilayer adsorption of molecules on adsorbent surface, (nFH < 1) indicates
greater than unity active zone of adsorbent would be occupied by adsorbate [6].
The Gibbs free energy for the spontaneous process evaluated from equilibrium constant KFH is represented as equation 9
Where ΔGo is the standard free energy change T the absolute temperature
and R the molar gas constant (8.314 Jmol-1K-1). The low correlation coefficient
(Figure 17) obtained and negative nFH values (Table 4) show that the model
could not simulate the data well and not applicable in explaining the adsorptive process.
9
Durbinin-Kaganer Radushkevich (DKR)
The adsorption using the semi-empirical DKR equation adopts pore filling process applicable to intermediate concentration range of adsorbate with multilayer, physiosorptive, Van Der Waals and heterogeneous -homogeneous surface involvement with consequent Gaussian free energy consideration [4].
The linear form of the temperature dependent model is shown in Table 1 and the plot of Inqe versus ɛ represented in Figure 18. The parameter ɛ regarded as Polanyi potential is represented in equation 10 and mean adsorption energy E (KJ/mol) was evaluated using equation 11
10
11
Figure 17: Flory-Huggins isotherm model plot for the sorption of MEB
onto ARHB.
ß is DKR constant representing mean adsorption energy (mol2/KJ2), R
the molar gas constant (8.314 J mol-1K-1), q
m the DKR monolayer adsorption
capacity (mg/g),T the absolute temperature(K). The value of E describes the nature of adsorption either as physical or chemical or ion exchange if the value is less than 8 KJ/mol or within 8-16 KJ/mol respectively [27]. In the
present study, the adsorption energy E is 0.011 KJ/mol which is less than 8 KJ/mol indicating that at the temperature of 303 K in which the adsorption was performed, physical processes are predominant and mainly in operation. From Table 4, the coefficient of regression value was high (0.9812) with low coefficient of non-determination indicating that the model simulated the data well but not as Hill isotherm model.
Figure 18: Dubinin-Kaganer-Radushkevich isotherm model plot for the
sorption of MEB onto ARHB.
Hill Isotherm model
The model views binding of different molecules to homogeneous surfaces as positive, negative or non-co-operative with adsorbate molecules residing at a particular adsorbent surface significantly influencing separate binding surface on the said sorbent [5]. The linear form of the model is shown in Table 1 with
KD as the Hill dissociation constant and nH the Hill coefficient for interaction
a measure of molecular co-operativity. Co-operativity of the adsorption as defined by slope (nH= 2.451) of the plot of Log qe/1-qe versus Log Co (Figure 18) shows that the complexation of the cationic dye MEB onto the biosorbent ARHB is positive; nH been greater than unity. The coefficient of regression (0.9998) of the model was the highest among the studied equilibrium model isotherm and suggest that the model is fit and appropriate for industrial designs.
Redlich- Peterson Isotherm model
three parametric approaches which deviates from a standard monolayer adsorptivity consideration [4]. The model enhances characterization of
equilibria of adsorption in a wide range of concentrations as at infinite dilution approachability to Henrys zone due to the numerator emanating from Langmuir is achievable [5]. The linear form of the model is presented in Table 1. The
adsorptivity capacity constant A (Lg-1), the parameters B (Lmg-1) and β (mgL -1) represents another constant and an exponent (0 < β <1) respectively. The
two limiting conditions of Langmuir and Freundlich isotherms are achieved when β =1 and β = 0 respectively. From Table 4 and Figure 20 (plot of In (Ce/qe) versus In Ce), the value of β is approximately unity (0.98) and with high regression coefficient (0.9208) further supports the predominance of monolayer adsorption.
Figure 19: Hill isotherm model plot for the sorption of MEB onto ARHB.
Figure 20: Redlich-Peterson isotherm model plot for the sorption of MEB
onto ARHB.
Kinetic models
Pseudo-first- order model
Adsorption of adsorbate from solution applied to Lagergren pseudo-first- orderrate equation 12 [5].
12
The linear form of the pseudo-first order kinetic model is shown in equation and Table 2 with t as time of contact (min), qt is quantity of MEB adsorbed at time t, qe is quantity of MEB adsorbed at equilibrium (mg/g), K1 pseudo first
order rate constant. As shown in Table 5 and linear plots in Figure 10, the data have low regression coefficient (R2) of 0.6746 and low value of K
I as 0.65 min-1
and as such the further discussion on the model and the figure was suspended.
Pseudo-second-order kinetic model
The assumption inpseudo-second-order kinetic model is that chemisorption dictates the rate controlling step as illustrated in equation 13 [40].
Fig 21: Pseudo-first –order kinetic plot for the adsorption of MEB onto
activated rice husk biochar.
where K2 is second order rate constant (g/mg min) and qe adsorption
capacity at equilibrium evaluated as intercept and slope of the linear plot of t/qt versus t (Figure 22). The regression coefficient (R2) (0.8285) (Figure 22)
indicates a good relationship between the parameters and shows that pseudo-second –order model simulates the data better than the pseudo first order kinetic model. Based on the result of the error analysis using sum square of errors, average relative error, coefficient of non- determination, standard error of estimate, non- linear chi square test and Marquardts percentage standard deviation with their equations shown in Table 3, observation was made that pseudo second order model could not simulate the data as good as intraparticle, liquid film and Elovic kinetic models.
13
Pseudo second order
Fig 22: Pseudo -second –order kinetics plot for the adsorption of MEB
onto activated rice husk biochar.
Elovic kinetic model
Chemisorption of gas onto solid sorbents as described by Elovic kinetic model is represented in equation 14 [5, 18] as shown in Table 2.
14
The constants α and β represents Elovic constants for initial adsorption rate (mg/gmin-1) and the degree of surface coverage and activation energy
for chemisorption (g/mg) respectively. From Table 5 and Figure 23, the slope and intercept of the linearized plot of qt versus In t are 0.88 and 0.78
respectively and the regression coefficients from the simulated data was high and of good fitting (R2 =0.9459). These values suggested that diffusion could
be part of the rate limiting step an indication that parameters in Elovic kinetic model supports chemisorption as part of the rate limiting step and prevails at negligible desorption rate [5]. From the result of error analysis (Table 5) and in
Fig 23: Elovic kinetic plot for the adsorption of MEB onto activated rice husk biochar.
Weber and Morris intraparticle diffusion model
The kinetic data were subjected to Weber and Morris intraparticle diffusion model with its linearized form equation 15 [27] and shown in Table 2.
sorbent whereas the external takes care of solute specie movement from to liquid phase boundary layer from the bulk solution [43]. The steps could involve
film diffusion where adsorbates migrate to external surface of the sorbent, particle diffusion where adsorbates transfer within the pores of the sorbent or sorption of adsorbate at interior surface of the sorbent.
The first two steps are only feasible since the last step proceeds at a very fast rate and may not be considered as a rate determining step. The feasibility of the two steps projects three mechanistic approaches [39,40]
i. External movement > internal movement; particle diffusion been prevalent
ii. External movement< internal movement; film diffusion been prevalent
iii. External movement internal movement; significance of rate not felt with adsorbent molecules surrounding liquid film at boundary layer.
15
where KI (slope) and C the intercept represents the intraparticle diffusion rate constant (mg/g min1/2) and a constant related to the thickness of the
boundary layer respectively evaluated from the linear plot of qt versus t1/2 and
values shown in Table 5. The model has the highest regression coefficient (R2)
of 0.979 but the value of C an indication of how high or low an adsorption capacity was very low (Table 5) and could not justify intraparticle diffusivity of the adsorbate through the biosorbent surface. Similarly, From Figure 24, the plot though linear but never passed through the origin a confirmation that intraparticle diffusion was involved in the adsorption but not the only rate determining process [48]. Consequently, the failure of the intercept line to pass
through the origin could be the involvement of boundary layer control in the adsorption. From the simulation of data using error analysis SSE, X2 and SEE
showed poor result for the model whereas ARE gave good result in comparison to other models. This confirms the partial involvement of the model in the mechanism of sorption.
Figure 23: Weber and Morris intraparticle diffusion model for the
adsorption of MEB onto activated rice husk biochar.
Liquid film diffusion kinetic model
The contact between the biosorbent and liquid films of the adsorbate could be a controlling force in adsorption as modeled in equation 16 [5, 43] and in
Table 2. The contact between the sorbent and MEB caused migration of the dye from bulk solution to liquid film surface. The diffusion barrier exerted could to a great extent determine the degree of involvement of film diffusion. Consequently the rate of adsorption has been shown to be determined by internal and external diffusion or both. Internal diffusion controls migration of solute materials from external adsorbate surface to internal pore surface of
16
A plot of In (1) versus t gave the slope as Klf representing the liquid diffusion constant (1/min) a measure of the transfer coefficient due to external mass on the system. From Figure 24 and Table 5, the intercept and slope were given as 1.01 and -0.0008 respectively with high regression coefficient (R2)
of 0.968. Simulation of the data for error analysis indicated that the model has the lowest value for SSE, SEE and X2 (Table 5) error testing implicating
liquid diffusion as part of the rate limiting step. The result confirms that liquid film diffusion was probably a major player in the adsorption mechanism and confirms existence of boundary layer influence as noted in Weber and Morris intraparticle diffusion evaluation. The transport of MEB from the solution to the pores of the adsorbent could be prevalent in the sorption process.
Figure 24: Liquid film diffusion model for the adsorption of MEB onto
activated rice husk biochar.
Bangham’s pore diffusion model
The linear form of theBangham’s pore diffusion model is represented in equation 17 and Table 2 [16, 46]
17
where Co is the initial metal ion concentration (mg/L), V is volume of solution (mL), m the weight of adsorbent (g/L), Δβ and KB are constants
obtained as slope and intercept of the linear plot of log log [Co/Co-mqt] versus log t ( Figure 25). The plot as shown in Figure 25 was linear with poor regression coefficient (R2) of 0.764 indicating that the kinetic model may not
Table1: Isotherm models and their linear forms.
S/N Type of model Models Linear form Reference
1 One parameter Henry [5]
2 Two parameter Langmuir [1,14]
3 Two parameter Freundlich [2,3]
4 Two parameter Elovic [4]
5 Two parameter Temkin [5]
6 Two parameter Jovanovic [6]
7 Two parameter Hill- deBoer [4]
8 Two parameter Kiselev [5]
9 Two parameter Harkin-Jura [5]
10 Two parameter Flory-Huggins [5]
11 Two parameter Hill [8]
12 Two parameter Fowler-Guggenheim [1]
13 Two parameter Dubinin-Kaganer-Radushkevich [14]
Figure 25: Banghams pore diffusion model for the adsorption of MEB onto activated rice husk biochar.
Table 2: Kinetic models, linear forms and plots.
S/N Kinetic models Linear form Reference
1 Pseudo-First order [12]
2 Pseudo-second order [13]
3 Elovic [5,18]
4 Weber and Morris [12]
5 Liquid film diffusion [13]
6 Bangham pore diffusion [16]
Table 3: Error analysis and their mathematical equations
S/N Kinetic models Linear form Reference
1 Sum square of errors(SSE) [7]
2 Average relative error(ARE) [7]
3 Coefficient of determination(R2) [11]
4 Coefficient of non- determination (CND) [8]
5 Standard error of estimate(SEE) [9]
6 Marquardts percent standard deviation(MPSD) [10]
Table 4: Isotherm model constants and their error analysis.
S/N Type of model Models Parameter 1 Parameter 2 Parameter 3 R2 1-R2
1 One parameter Henry KHE = 94.48 0.9476 0.0524
2 Two parameter Langmuir qm (mg-1) =356.99 b(Lmg-1) = 8.80 0.9807 0.0193
3 Two parameter Freundlich n= 0.316 KF (mg1-1/nL1/ng-1) =149.89 0.9574 0.0426
4 Two parameter Elovic KE (Lmg-1) = 3.001 qm(mgg-1)= 715.153 0.9849 0.0151
5 Two parameter Temkin KT(Lmg-1) = 3503.78 B(KJmol-1)=30448.241 0.9253 0.0747
6 Two parameter Jovanovic Kȷ(Lg-1)= 6.917 q
m (mgg-1) = -93.645 0.9729 0.0271
7 Two parameter Hill –deBoer K1(Lmg-1)=7.10x10⁻⁴ K2(KJmol-1)= 44.24 0.4723 0.5277
8 Two parameter Kiselev Ki (Lmg-1) = 0.0003 K
n = 1.66x10⁻³ 0.9855 0.0145
9 Two parameter Harkin-Jura AH(g2L-1) = 0.0613 BH(mg2L-1)=-0.0783 0.9610 0.039
10 Two parameter Flory-Huggins KFH (Lg-1)= -0.3188 nFH = -8295.2 .7470 0.2530
11 Two parameter Dubinin-Kaganer-Radushkevich β=-3630.2 qm=-180486 0.9812 0.0188
12 Two parameter Fowler-Guggenheim KFG (Lmg-1) = 9.2 x10⁷ W(KJmol-1) = 5567.32 0.3933 0.6067
13 parameterTwo Hill nH=2.451 KD= -13926.8 0.9998 0.0002
14 Three parameter Redlich-Peterson A(Lg-1) = 0.0672 B(Lmg-1)=33.12 β=0.989 0.9208 0.0792
Table 5: kinetic model constants and their error analysis.
S/N Kinetic models Constant 1 ` Constant 2 R2 X2 SSE SEE ARE MPSD 1-R2
1 Pseudo-First order qe = 5.6 K1=0.65 0.675 - - - - -
-2 Pseudo-second order qe = 8.0 K2 = 2.15 0.829 1.17x10⁹ 29.73 29.73 3.93x10⁷ 99.99 0.1715
3 Elovic α= 0.88 β=0.78 0.946 1.6x10⁷ 3.53 3.53 1.17x10⁸ 99.99 0.0541
4 Weber and Morris C=-0.95 K2=0.33 0.979 1.19x10⁶ 0.951 0.951 1.25x10⁶ 99.99 0.0202
5 Liquid film diffusion Klf = -0.0008 qe= 1.01 0.968 1.74x10⁵ 0.363 0.363 1.2x10⁷ 99.99 0.0325
6 Bangham pore diffusion Δβ=4.27 Kβ=1.87 0.764 - - -
-Key: K(min-1),q
e (mgg-1)= K2(gmg-1min-1), Ki( mgg-1min-1/2),α(mgg-1min-1),β(gmg-1).Note: Boundary condition was assumed that R2 value for a model must
be up to 0.800 to be subjected to error analysis.
CONCLUSION
Based on the result of this study, the following conclusions were drawn Activated rice husk biochar was prepared and characterized for surface activity and result indicated amorphous nature suitable for adsorption of particulates.
The activated rice husk biochar based on the maximum adsorption capacity has shown strong potential to capture MEB from solutions
The adsorption of MEB onto activated rice husk biochar increases with increase in initial concentration of adsorbate and time of contact until equilibrium. The maximum percentage adsorbed was obtained at pH of 8 and minimum at pH 3.
Equilibrium of adsorption was studied and the result indicated that Hill isotherm model best described the adsorption equilibrium.
Kinetics study for the adsorption of MEB onto ARHB was observed to follow Weber and Morris intraparticle diffusion and liquid film diffusion mechanisms as the rate limiting step with significant boundary layer condition in operation.
Error analysis was performed to strengthen the result obtained from the kinetic models and to test the applicability of the models in industrial designs. The error analysis was significant in determining the best fit kinetic model
The study presented activated rice husk biochar as an effective, efficient, benign and cheap alternative biosorbent for the sequestration of dye (MEB) from solutions.
REFERENCES
1. S.Banerjee, S, M.C, Chattopadyaya. Arabian Journal of Chemistry. 10,S1629, 2017
2. E. Betiku, O.A. Sheriff, O.A, Industrial crops and products. 53,314,2014 3. B. Badis, Z. Benmaamar, O. Benkortbi, H. Boutoumi, H. Hamitouche,
A. Aggoun, Chemistry Journal of Moldova. General, industrial and Ecological Chemistry. 11,74, 2016.
4. N.B. Prakash, V. Sockan, P. Jayakaran. International Journal of Engineering Science and Innovative Technology. 3,479, 2014..
5. M. Petrovic, J. Rarjenovic, D. Barceló. The Holistic Approach to Environment. 1, 63, 2011.
6. A. Cesaro, V. Naddeo, V. Belgiorno. Journal of Bioremediation and Biodegradation. 4, 1,2013.
7. J.A. Prince, S. Bhuvana, V. Anbharasi, N. Ayyanar, K.V. Boodhoo, G. Singh. Scientific reports. 4, 365,2014
Environmental Science and Mnagement. 2, 209,2016.
9. N. Ayawei, A.N. Ebelegi, D. Wankasi. Journal of Chemistry. 3039817. 2017.
10. R.P. Mokkapati, V.N. Ratnakaram, J.S. Mokkapati. Int, J. Environ. Sci. Technol. 10, 017,2017.
11. R. Farouq, N.S. Yousef. Inter. jour . Cem Eng and Appl. 6, 319, 2015 12. M. Inyang, B. Cao, P. Pullammannappallil, A.R. Zimmerman. Sep.Sci.
Technol. 46, 1950,2011
13. I.K.Mazhar,Q.M.Saima, P. Sajida, Y.K. Muhammed. Pak. J. Anal Environ. Chem. 15, 35,2014
14. Q. Hamdaoui, E. Naffrechoux. Journal of Hazardous Materials. 147, 381,2007.
15. H. Shahbeig, N. Bagheri, S.A. Ghorbanian, A. Halljisani, S. Poorkarimi. Int, J. Environ. Sci. Technol. 4, 243,2013.
16. S. Idris, Y.A. Iyaka, M.M. Ndamitso, E.B. Mohammed, M.T. Umar. American Journal of Chemistry. 1, 47.,2017
17. C. Chen. The open chem Engineer Journal. 7,24,2013
18. J.A. Udoji, E.E. Etim. International Journal of Environmental Science and Development. 6, 205, 2015.
19. S. Alkan, M. Caliskan, I. Irenede, .R. Kul. J.Chem.Soc.Pak. 40, 457,2018 20. G. Yang, L. Wu, Q. Xian, F. Shen, J. Wu, Y. Zhang. Plos One. 1,2013 21. D. Ghahremani, I. Mobasherpour, S.A. Mirhosseini. Bulletin de la societe
Royale des sciences de Liege.86, 96, 2017.
22. J. Singh, N.S. Mishra, S.I. Banerjee, Y.C. Sharma. bioresources. 6, 2732, 2011.
23. P. Sampranpiboon, P. Charnkeitkong. International journal of energy and environment. 4, 88-98, 2011
24. S.M. Yakout, E. Elsherif. Carbon- Sci. Tech. 1, 144, 2010.
25. S. Patil, V. Deshmukh, S. Renukdas, N. Patel. International journal of Environmental Sciences. 6, 1123, 2011.
26. T. Elmorsi, Journal of Environmental Protection. 2,362, 2007.
27. T. Mahmood, M. Aslam, A. Naeem, T. Sissique, S. Din. Chil. Chem. Soc. 63, 3855, 2018.
28. O.T. Okareh, A.T. Adeolu. British journal of Applied Science and Technology. 8,267,2015
29. B. Acemioglu, B. Chem Eng J. 106,73,2005
30. O. Ozdemir, B. Armagan, M.S. Turan, M.S. Celik. Dyes and pigments. 62,49,2004
31. I.O.Saheed, F.A. Adekola, G.A. Olatunji. JOTCSA, 4, 375,2017. 32. P. Guyon, G.P. Frank, M. Science. 323, 495,2009.
33. G.R. Van der Werf, J.T. Randerson, L. Giglio, G.J. Collatz, P.S. Kassibhatla, A.F.Arellano Atmos Chem Phys. 6,3423,2006
34. A. Irwin. Globe Change. 83,8,2014
35. O. Paris, C. Zollfrank, G.A. Zickler, Carbon. 43, 53,2005
36. Y.Yao, B. Gao, M. Inyang, A.R. Zimmerman, X. Cao, P. Pullammanappallil, L. Yan. J. hazard. Mater.190, 501,2011.
37. L.D. Tiwari, L. Lee. Environmental Engineering Research. 17,541-548, 2012.
38. A. Kezerle, N. Velic, D. Hasenay, D.Kovacevic. Croat. Chem. Acta. 91,53, 2018
39. N. Nasuna, B.H. Hameed, A.T.M. Din. J. Hazard. Mater. 175, 126, 2010 40. A. Demirbas. Journal of Analytical and Applied Pyrolysis. 72, 243, 2003. 41. H. Cherifi, B. Fatiha, H. Salah. Appl Surf Sci. 282, 52,2003
42. M. Wawrzkiewiez, Z. Hubick . J. Hazard. Master. 164, 502,2009. 43. L. Ai, C. Zhang, L. Meng. Chem. Eng. Data. 56, 4217, 2011.
44. M. Uchimiya, S. Chang, K.T. Klasson. Journal of Hazard Mater., 190, 432, 2011.
45. X.D. Cao, L. Ma, B. Gao, W. Harris. Environ.Sci.Technol. 43, 3285, 2009 46. A.O. Dada, J.O. Ojediran, A.P. Olalekan. Adv Chem Phys. 9, 103, 2013 47. B. Samiey, F. Ashoori. Chem. Cent.J. 6, 1, 2002