University of New Orleans University of New Orleans
ScholarWorks@UNO
ScholarWorks@UNO
University of New Orleans Theses and
Dissertations Dissertations and Theses
5-20-2011
An Assessment of the U.S. Army Corps of Engineers'
An Assessment of the U.S. Army Corps of Engineers'
Environmental Plan Evaluation Methods
Environmental Plan Evaluation Methods
Michael Holland
University of New Orleans
Follow this and additional works at: https://scholarworks.uno.edu/td
Recommended Citation Recommended Citation
Holland, Michael, "An Assessment of the U.S. Army Corps of Engineers' Environmental Plan Evaluation Methods" (2011). University of New Orleans Theses and Dissertations. 124.
https://scholarworks.uno.edu/td/124
This Dissertation-Restricted is protected by copyright and/or related rights. It has been brought to you by ScholarWorks@UNO with permission from the rights-holder(s). You are free to use this Dissertation-Restricted in any way that is permitted by the copyright and related rights legislation that applies to your use. For other uses you need to obtain permission from the rights-holder(s) directly, unless additional rights are indicated by a Creative Commons license in the record and/or on the work itself.
This Dissertation-Restricted has been accepted for inclusion in University of New Orleans Theses and Dissertations by an authorized administrator of ScholarWorks@UNO. For more information, please contact
An Assessment of the U.S. Army Corps of Engineers’ Environmental Plan Evaluation Methods
A Dissertation
Submitted to the Graduate Faculty of the University of New Orleans
in partial fulfillment of the requirements for the degree of
Doctor of Philosophy in
Urban Studies
by
Michael C. Holland
B.S. University of New Orleans, 1985 M.A. University of New Orleans, 1988
ii
Dedication
iii
Acknowledgements
Many thanks to my dissertation committee: Marla Nelson, Denise Reed, Rebecca Griffith, and my committee chairman, David Gladstone. Dr. Gladstone has been incredibly supportive and patient, regardless of the variety of issues that have popped up along my long path to graduation.
Thank you, Lillian Almodovar, for an insightful review of my first research efforts on this subject.
Thank you, Richard Kazmierczak of Louisiana State University, for input that greatly improved this document.
iv
Forward
For the past 22 years I have worked as an economist for the U.S. Army Corps of Engineers, a civilian federal agency that develops large scale water resource projects. After serving as a trainee, journeyman, and senior economist in New Orleans District over the course of 18 years, I moved to the Jacksonville District to become chief economist in the largest planning program in the Corps.
Working for the Corps, as with any federal agency, requires adherence to an extensive web of rules and regulations, referred to as “guidance.” Much of the guidance is intended to help government employees implement federal laws, most of which are written broadly enough that implementation requires development of detailed interpretations of the laws. My reason for writing this dissertation is that the
implementation guidance that tells Corps offices how to evaluate and select which large scale ecosystem restoration projects to recommend for implementation is lacking in ways that I believe can lead to poor decision making.
v
Table of Contents
Abstract ... v
Chapter I: Introduction ... 1
Chapter II: Review of Corps Planning Guidance and Practices ... 4
Chapter III: Study Methods and Data Sources ... 11
Chapter IV: Assessment of Current Guidance and Practices ... 13
Chapter V: Conclusions and Recommendations ... 33
References ... 36
vi
Abstract
The U.S. Army Corps of Engineers is a federal agency with a mission to develop water resource projects to benefit the nation. Some of its large scale projects have been built to benefit cities, but through unintended consequences have caused economic and environmental damages. For example, its control of Mississippi River flooding has protected the City of New Orleans, but contributed to land loss in coastal Louisiana, and by some accounts, made the population more susceptible to hurricane damage. The agency has now embarked on a mission to restore some of the damaged environmental areas.
This dissertation evaluates whether policies and practices used by the agency to evaluate and select plans to implement is logically flawed and could produce suboptimal project selection. The primary issue is the practice of including only implementation costs in the analysis while excluding other positive and negative economic impacts. A case study is performed using the method to evaluate a traditional economic development project for which optimal project selection has already been determined using widely accepted benefit-cost practices. The results show that the Corps’ environmental project evaluation method would cause rejection of the most efficient plan. The loss of welfare that would result from using this technique is measured by comparing the welfare gain of the optimal project to the welfare gain of the suboptimal projects which could be selected using the flawed methodology.
In addition, the dissertation evaluates whether suboptimal results could be produced using two other current Corps policies: selecting projects based on production efficiency, and the
exclusion of environmental benefits from the discounting process. For the first policy, a simple counter example shows how clearly inferior choices may come from including only supply considerations in investment choices. For the second policy, it is demonstrated mathematically that refraining from discounting benefits while discounting costs causes a bias towards
selection of plans that take longer to build, are delayed in their implantation, or a combination of the two.
1 Chapter I: Introduction
The U.S. Army Corps of Engineers is a federal agency responsible for military construction, regulation of the waters of the United States, and the development of water resource projects, with the latter two missions comprising its civil works mission. The Corps’ traditional civil works missions include water supply, flood control, and navigation projects aimed at increasing
national wealth, referred to by the Corps (and other federal agencies) as national economic development (NED).
Numerous large scale projects within the traditional mission of the Corps have been built since the agency was formally established in 1802. Many of the Corps’ projects were intended to either facilitate urban development, or to protect the assets of urban areas: flood control projects to protect cities, port development projects to bring economic opportunity to urban residents, and water supply for homes and businesses.
In some instances, unintended, negative environmental and economic effects of projects resulted from a failure to anticipate the full range of long term effects of projects, effects not well understood until long after projects were already constructed and impacts were felt. An example is the Mississippi River Levee system, which prevents overflow of the Mississippi River into the City of New Orleans and surrounding municipalities. The project has been very
effective in preventing river flooding, but as a consequence, it has stopped the sediment replenishment of naturally subsiding wetlands, resulting in increased storm surge risk for the City of New Orleans as the city, built on wetlands, sinks further below sea level each year. The lack of replenishment from river sediment has also contributed to substantial land loss in coastal Louisiana as the coast sinks and the sea level rises (USACE, 2004).
In other instances, some of the long-term consequences were better anticipated. The Central and South Florida Project, constructed in the mid twentieth century for flood control and water supply in urban and agricultural areas, fostered economic development and reductions in flood losses by channelizing sheet flows that previously hydrated the Florida Everglades. The project was viewed as a success by most because it converted land which was considered to be useless to humans into areas suitable for urban and agricultural development. But channelizing the Everglades has destroyed thousands of square miles of unique, sensitive environment (National Resources Council, 2006).
2
In the coming years, the Corps plans to lead an effort with several other federal and state agencies to construct some of the largest ecosystem restoration plans in the world. In
Louisiana, the Corps will use a variety of means to re-plumb the lower portion of the Mississippi River system, one of the largest watersheds in the world, in an attempt to stem the ongoing annual loss of thousands of acres of coastal wetlands (USACE, 2004). The Louisiana Coastal Area Ecosystem Restoration Study (USACE, 2004) describes a series of projects that the Corps hopes to implement over a period of several years in an effort to restore Louisiana’s wetlands.
In Florida, another large scale restoration is underway, having as its central component the Comprehensive Everglades Restoration Plan, authorized under the Water Resources
Development Act of 2000 (Public Law 106-541) to restore the Everglades. Over 18,000 square miles of central and south Florida have been included in the planning phases for CERP (National Resources Council, 2006).
Plans such as LCA and CERP will require dealing with complex economic, social, and
environmental issues on a large scale. Aside from the environment, flood control, navigation, water supply, and other types of assets will be impacted—along with the urban communities that they serve.
For economic development projects, the agency primarily uses net benefits analysis, a measure of the change in NED, as its decision criterion in determining which projects to implement. That method estimates in monetary terms the economic benefits and costs of proposed plans, and identifies plans that maximize the differences between benefits and costs. This type of analysis is still used heavily by the Corps in evaluating project feasibility.
For the environmental restoration mission, the net benefits approach has been determined by the agency to not be an effective method of evaluating and selecting projects for construction since the primary project benefits are not always quantifiable in monetary terms. A modified benefit-cost approach, called cost effectiveness and incremental cost analysis (CE\ICA), is being employed, described by Robinson, et al., (1995). The method is a significant departure from the traditional approach of using net benefits analysis to identify efficient plans. This dissertation is aimed in part at evaluating whether the new method—as it is currently practiced—actually perpetuates some of the problems with the Corps’ traditional net benefits approach by not properly accounting for incidental effects of projects.
3
Corps has developed a method to calculate which projects are most efficient in production of habitat and narrows the number of choices for decision makers to manageable numbers. I will analyze the logic of this criteria, and possible problems with its use.
Another practice employed in Corps environmental project evaluations is the use of a zero discount rate for calculating the value of habitat expected to be restored in the future. This practice may have unintended consequences for the analysis that I will also review.
What history shows is that Corps projects aimed at making positive economic impacts on the welfare of cities—flood control, navigation, and water supply—can have unintended
environmental and economic consequences. It is in the best interest of urban citizens and the government to ensure that every significant impact of its projects that can be reasonably anticipated be incorporated into the agency’s analysis, and that the welfare changes brought about by the Corps’ projects are accurately stated so that properly informed decisions can be made.
4
Chapter II: Review of Corps Planning Guidance and Practices and Relevant Literature
In this chapter I will discuss the development of benefit-cost analysis as applied to federal water resource projects, then summarize the guidance documents used by Corps field offices in conducting economic evaluations of both economic development and environmental restoration plans. The discussion will focus on the overall process and selection philosophy, and on several key elements of the guidance that differ for the two plan types. In addition, I will review relevant academic literature.
(i) Development of Benefit-Cost Analysis
The guidelines used by the Corps (and other federal agencies) to determine which projects should be recommended for implementation has been evolving since the mid 1930s when benefit-cost analysis was developed to evaluate federal investments as a part of the “New Deal,” a federal program aimed at pulling the United States economy out of the Great
Depression (Hufschmidt, 2000). A planning agency called the National Planning Board was set up in 1934 under the New Deal (Holmes, 1972; Clawson; 1981), and the agency commissioned two studies to develop methods of planning and economic evaluation of potential public works projects (Black, 1934; Clark, 1935). As Hufschmidt (2000) points out, Clark’s book showed that many of the basic ideas behind benefit-cost analysis were already understood by economists of that time, including willingness to pay, externalities, and the shadow price of unemployed labor.
The Flood Control Act of 1936 (33 U.S.C. 701) established the first federal guidelines for evaluating civil works projects (Powers, 2003), which included language stating that projects should be evaluated to determine if their benefits outweigh their costs. An interagency team was formed to develop implementation guidelines that were used to evaluate federal water resource proposals for the U.S. Bureau of the Budget (now known as the Office of Management and Budget) and the president between 1937 and 1943. Due to shifting priorities (World War II) the work of the team ended when the agency it worked under was abolished by Congress (Clawson, 1981).
In 1950, a report entitled Proposed Practices for Economic Analysis of River Basin Projects was
produced by the Corps of Engineers and the Departments of Agriculture, Interior, and
Commerce, along with the Federal Power Commission (Powers, 2003). The report, later known
as the Green Book, specified that the objective of benefit-cost analysis should be to maximize
5
The next major development was the publication of a set of Principles and Standards (P&S) by the Water Resources Council, a part of the executive branch formed by the Water Resources Planning Act of 1974 (PL 93-251). The P&S placed environmental considerations on an equal footing with economic development. In 1982, the P&S was repealed, and the Water Resources Council's Economic and Environmental Principles and Guidelines for Water and Related Land Resources Implementation Studies (1983), hereinafter referred to as the “P&G,” were issued the following year with four accounts: National Economic Development (NED), Regional Economic Development (RED), Environmental Quality (EQ), and Other Social Effects (OSE). National economic development is a measure of changes in the wealth of the nation as a whole. Regional Economic Development measures shifts in wealth among regions of the nation. Environmental quality deals with effects on the natural environment. Other Social Effects is an account that encompasses issues not covered in the other three accounts, including health and safety, energy requirements, income and employment distribution, and urban and social impacts such as community cohesion.
The most critical change in policy brought about by the P&G was that the only mandatory account would be NED, and that decisions would be made on the basis of maximizing that account. This meant that environmental issues were no longer on an equal footing with economic considerations (Powers, 2003). Given that, it became more critical that benefits of environmental projects that can be quantified in dollars be included into any benefit-cost analysis since non-monetized benefits are disregarded in that decision making criterion.
In recent years substantial efforts have been made to develop methods of computing the value of ecosystem services. Though these methods were not all developed for inclusion in benefit-cost analysis, their existence certainly facilitates incorporation of such values into such an assessment.
6
Revealed Preference Approaches:
Market valuation: prices of good and services obtained from what the data show that
people are willing to pay for them
Travel cost: the amount that people are willing to pay to arrive at a site where a
particular benefit can be enjoyed
Hedonic prices: what people are willing to pay for similar or closely related goods and
services for which values are known
Production cost: impacts of the ecosystem on the cost of producing particular outputs
State Preference Approaches
Contingent valuation: values acquired through surveys of respondents’ willingness to
pay for given amenities
Conjoint analysis: how people rank environmental amenities given a set of hypothetical
choices
Cost Approaches
Replacement cost: a calculation of how much it would cost to replace an environmental
amenity if it were lost
Avoidance cost: costs savings resulting from an action which prevents the necessity of
making expenditures to avoid or compensate for negative consequence (such as flood control)
As discussed throughout the remainder of this dissertation, with a rare exception these ecosystem service values are not presently quantified and incorporated into the benefit-cost analysis used to select plans to for Corps environmental projects. Interestingly, the Corps does use several of these methods, including market valuation, replacement costs, and the travel cost method in conducting economic analysis for economic development projects. The
implications of not using ecosystem service values in benefit-cost analysis are also discussed in detail throughout this dissertation.
(ii) Net Benefits Analysis
7
the Corps’ Engineering Regulation 1105-2-100, entitled “Planners Guidance Notebook,” (USACE, 2000), referred hereinafter as the PGN.
The Corps plans and constructs a variety of water resource project types, including the two most common examples, flood control and navigation projects. For flood control plans, the Corps estimates how much proposed plans will reduce flood damages and other flood-related costs such as emergency response, evacuation, and cleanup. For navigation plans, the Corps estimates how much proposed plans will reduce transportation costs, primarily fuel, labor, and the cost of buying and maintaining ships. In both cases, benefits are compared to the costs to implement plans. The benefits and costs of these plans are all defined in dollar terms.
Consequently, the benefits of any plan can be compared to its costs to determine whether it produces and increase in net wealth for the nation. The costs expended to implement Corps plans typically include engineering and design, construction, real estate, and operation and maintenance costs. Plans that have benefits in excess of costs (net benefits) are considered justified, and the alternative that maximizes the difference between benefits and costs is initially determined to be the optimal plan. The latter is presented as the NED plan, and is normally recommended for construction, though there are circumstances where another plan might be recommended by the agency. For example, for the Inner Harbor Navigation Canal Project the Port of New Orleans requested that the Corps build a larger lock project than the one determined by the Corps to be the NED plan (the larger lock produces a lower increase in national wealth). The Corps has recommended that the larger project be built with the incremental cost of the larger project to be entirely paid by the port (USACE, 1997). Of
importance, the guidance calls for all economic costs and benefits—direct and incidental—to be included in economic analysis.
(iii) Cost Effectiveness and Incremental Cost Analysis
Environmental plans present a major problem for using traditional net benefits analysis. The outputs (or benefits) of environmental plans are typically expressed in non-monetary terms. Habitat units, a metric of the quality and quantity of habitat produced, may be used as an output measure. However useful they are, habitat units are not readily translatable into
dollars, a necessary step for conducting net benefits analysis. Some researchers have proposed ways to value habitat in dollars, but to date these methods remain highly controversial, and their lack of general acceptance has prevented them from being used in plan justification or selection in Corps studies (Shabman, 1993). For that reason, a Corps-published manual on monetizing environmental benefits recommends not using these values in a net benefits analysis (USACE, 1997).
8
traditional net benefits analysis, the Corps has used the alternative approach of CE\ICA to evaluate ecosystem restoration plans and develop plan recommendations. This method is also a benefit-cost approach, but it allows the use of benefits expressed in units other than dollars. This alternative approach is aimed at determining the lowest possible cost of providing various levels of environmental output and the incremental costs of these outputs so that decision makers can select plans to recommend for implementation (Robinson, et al., 1995).
Cost effectiveness and incremental analysis is performed as described in Robinson, et al. (1995), and USACE (2004). Study teams develop alternative measures, or project features, such as river diversions to carry sediment. The implementation costs and environmental benefits of these individual measures are then calculated. The various measures are then combined to form complete plans. In combining measures, three issues are accounted for in calculating the costs and benefits of complete plans: exclusions, dependencies, and synergies. Exclusions are situations where measures cannot be combined, normally due to physical constraints. For example, two alternatives might occupy the same space. Dependencies occur when one or more measures are not functional without other measures in place. Finally, synergy exists when measures become more or less effective if implemented together. Taking these factors into account, every possible combination of measures is formed into alternative plans. Each measure combination is then presented as a plan with a given level of benefits and costs.
Plans are evaluated for their ability to provide output per dollar spent. For each plan that is developed, a determination must be made if there is a plan that can produce the same output for a lower cost (referred to as a “more efficient” plan). If so, the less efficient plan is dropped. Also, it must be determined if there is a plan that can produce more output for the same cost (referred to as a “more effective” plan). If this is the case, the less effective plan is dropped. The result is a listing of the plans that achieve each level of output at the lowest cost possible.
9
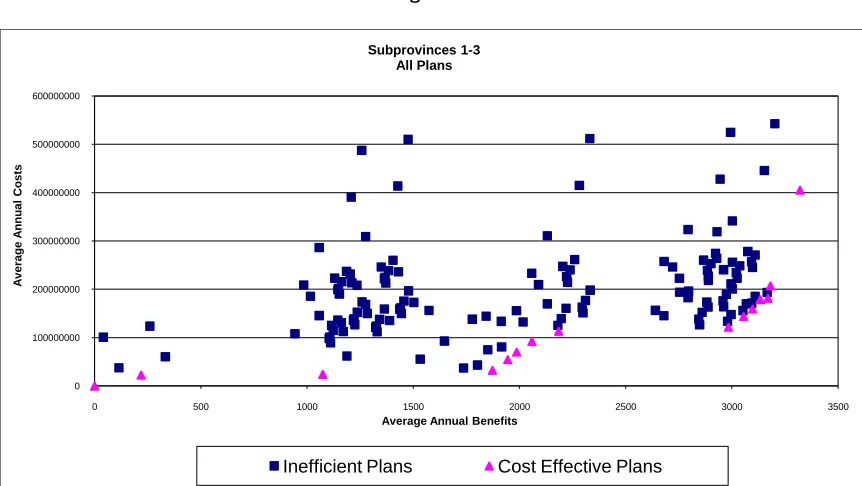
Figure 1
Source: U.S. Army Corps of Engineers, Draft Louisiana Coastal Area, Louisiana—Ecosystem Restoration Study, Appendix E, p. E-127, 9 July 2004.
The next step of the process is to determine the incremental cost of each successive level of output. Incremental cost is the average cost of each additional unit of output obtained when the level of spending is increased. This is done by calculating the increase in output achieved when going from each plan on the frontier to the next higher output plan and dividing this figure by the increase in costs expended to achieve the next higher level of benefits.
As stated previously, marginal benefits are not expressed in dollars for ecosystem restoration efforts, so a direct comparison cannot be made of marginal benefits and marginal costs to arrive at the solution that maximizes welfare, as would be done in an NED analysis.
Consequently, to deal with scale optimization, the Corps uses the concept of “best buys.” Best buy plans are those that increase output at the lowest average cost, i.e., they are the most efficient in production. To determine which plans are best buys, one starts at the origin of the graph (see Figure 1) and draws a series of tangents to each of the efficient plans. The slope (or the rise over the run) of each of these lines represents the average cost of output for the respective plan. The line with the lowest slope identifies the plan that increases output for the
0 100000000 200000000 300000000 400000000 500000000 600000000
0 500 1000 1500 2000 2500 3000 3500
A
v
e
ra
g
e
A
n
n
u
a
l
C
o
s
ts
Average Annual Benefits Subprovinces 1-3
All Plans
10
lowest average cost. This plan is the second best buy plan (with the origin, or no action alternative, being the first). The process is then repeated, beginning with the second best buy used as the starting point, to identify subsequent best buy plans. The process continues until the most costly plan on the efficient frontier is reached. As an artifact of the process, the origin and the most expensive efficient plan are always the endpoints in the graph of best buy plans.
A critical issue is that Corps policy is to eliminate non-best buy plans:
The decision rule in incremental analysis is to select the plan with the lowest cost per unit (i.e., the first best buy from a production perspective, producing output at the lowest unit cost) and then remove from consideration (in this analytical process) any plans that provide a smaller output level than the selected plan (they are less efficient in production, producing a lower level of output at a higher unit cost). (The Planner’s Guidance Notebook, Engineering Regulation 1105-2-100, 22 April 2000, page E-155).
Given the list of best buy plans, decision makers can recommend a level of output to produce based on the tradeoff between dollars and output. Budget constraints and other criteria, such as targeted habitat levels, can be used to select from the array of efficient plans.
(iv) Treatment of Incidental Economic Effects
Many plans have impacts beyond the targeted benefit category. An example can be seen in the Corps’ Amite River and Tributaries, Louisiana, East Baton Rouge Parish Watershed Flood Control Projects Feasibility Study. Flood control plans designed to reduce flood damages to existing homes were also predicted to reduce the future cost of building houses in the floodplain because with the plans in place less fill material would be needed to raise structures above predicted flood elevations (USACE, 1995). Plans can also have costs beyond their
implementation costs (as defined in part (i) of this chapter). For example, construction of a hurricane storm surge reduction project in the Morganza, Louisiana, area, which will be discussed in detail in Chapter IV, was determined to increase transportation costs (USACE, 2002). In this dissertation, benefits beyond those targeted by a plan will be referred to as incidental benefits, and costs outside of the normal implementation costs discussed above will be referred to as incidental costs. As dictated in the PGN, to determine a traditional Corps NED maximizing plan all benefits and costs that can be quantified in dollar terms are considered when computing net benefits.
11
residential areas; and possibly significant losses in the oyster industry if land-building sediment diversions bury highly productive reefs. Social impacts to communities are also possibilities. For example, a loss of community cohesion could occur if a community had to relocate to facilitate plan implementation (USACE, 2004).
Recognizing the implications of incidental effects, Shabman (1993) prepared a report for the Corps in which he recommended a net incremental cost approach for ecosystem restoration plans:
Net incremental costs to be considered would include: (1) direct (life cycle) financial outlays by government and individuals; (2) the benefits derived from the existing services of the watershed which would be foregone with restoration; and, (3) the measured NED benefits gained from the restoration. (P. 49)
The approach suggested would treat incidental NED costs as additions to plan costs (for
negative impacts, or economics losses) or subtractions from plan costs (for positive impacts, or economic benefits). Net plan costs would be the sum of all economic impacts of building a plan: implementation costs plus other positive and negative economic effects, such as
navigation and flood control impacts. This would be consistent with the way these impacts are treated by the Corps in net benefits analysis of non-environmental plans. Stakhiv, et al. (2003), in a document published by the Corps’ Institute for Water Resources, give a slightly more detailed description of how Shabman’s approach could be implemented. Seven years after its publication, the cover page of the document still includes this language:
This report contains discussion about analytical approaches and procedures that are not yet approved by HQUSACE for broad Corps-wide use. Contact USACE for specific guidance before applying the procedures proposed in this report.
With one exception (discussed below), the approach described by Shabman and Stalhiv, et al., was never implemented. As it is currently practiced, CE\ICA does not internally account for economic impacts beyond implementation costs. Corps field offices have not included incidental economic effects in the calculation of plan costs used in CE\ICA. Brandreth and Skaggs (2002) reviewed 26 CE\ICA conducted by Corps offices around the United States to develop a publication on lessons learned from CE\ICA as practiced in the field. In conducting their research, published by the Crops’ Institute for Water Resources, the authors found no study where net NED costs or benefits were used to perform CE\ICA (Brandreth, 2004, and Skaggs, 20004).
12
Mississippi River Environmental Management Program, respectively. All confirm that they are unaware of any instances where either negative or positive economic impacts of restoration plans have been explicitly incorporated into CE\ICA within their programs.
The lone instance where NED impacts are explicitly incorporated into a CE\ICA can be found outside of the major restoration programs. That effort, carried out in the Sacramento District
of the Corps, is theHamilton City Flood Damage Reduction and Ecosystem Restoration Study
(USACE, 2004b). In that study, flood damage reduction and ecosystem restoration planning were combined. The Hamilton City study team developed plans to restore habitat and reduce flooding in the city and surrounding areas by removing a non-native orchard; restoring native vegetation; reconnecting the Sacramento River with its former floodplain; and constructing a training dike and setback levee. Six alternatives were developed, and a CE\ICA was performed. The economic (dollar-denominated) benefits of flood damage reduction were calculated for the alternatives, then subtracted from implementation costs of the respective alternatives before performing the CE\ICA. Three plans were eliminated because they were inefficient, and of the remaining three, one plan was eliminated because it was not a best buy plan. The plan selected from the final two was picked because the other plan increased habitat by a relatively small amount while disproportionately increasing costs.
The combination of restoration and flood control features resulted in a plan expected to
restore 1500 acres of habitat while significantly lowering the cost of providing flood protection. Earlier studies aimed at designing effective flood control alone were unable to produce a
justified plan. The combined project, for which 90% of the costs will be spent on habitat restoration, reduced the cost of providing flood protection such that the benefit-cost ratio on the flood protection features was 1.8:1.
The status of the Hamilton City project and its implications are discussed in the Conclusions and Recommendations chapter.
For small scale plans that have little or no incidental economic or social impacts, performing CE\ICA using only implementation costs may be acceptable since these effects would not affect plan selection. The Corps, however, is now planning to embark on large scale plans with potentially serious incidental economic and social impacts. As stated above, the LCA study identified significant incidental economic effects of the proposed alternatives, but these effects were not integrated into the CE\ICA. For example, a massive re-routing of Mississippi River traffic was part of some alternatives, and substantial reductions in storm surge would be expected from most of the alternatives for parishes along the state's coast (USACE, 2004). Neither of these incidental economic impacts was calculated with the level of precision
13
case was an impact of this type used directly in the CE\ICA in the manner suggested by Shabman.
While the exclusion of incidental economic effects in conducting CE-ICA is clearly a common practice, a careful search of Corps guidance shows no specific language that either dictates or prohibits the inclusion of such effects in the analysis. The exclusion of incidental effects when performing CE\ICA is a practice of field offices, not Corps policy.
(v) Marginal Benefits versus Marginal Costs
Separable elements are plan measures that can function on their own. The PGN requires that the net benefits be shown for each separable element of these alternatives. Plans—or
separable elements of plans—are considered justified when their benefits outweigh their costs, i.e., net benefits are positive. When there are multiple justified plans, going from any justified plan to the next larger plan is only permitted if increases in benefits received outweigh the increases in costs incurred to build the larger plan. Restated, the marginal benefit of any project feature must outweigh its marginal cost to be acceptable.
For ecosystem development plans the guidance is different. As discussed previously, it is not possible to calculate net benefits for ecosystem development plans since outputs are not dollar denominated. Given this, the PGN requires that the best buys approach described above be used in place of conventional marginal benefit versus marginal cost analysis. The implications of this difference will be analyzed in detail in the next chapter.
(vi) Discounting of Costs and Benefits
By nature, the costs of water resource projects are mainly paid in the beginning of a project, with the cost of planning, preconstruction engineering and design, and the acquisition of lands, easements, and rights-of-way all coming prior to ground breaking for construction. Many types of projects, such as water supply, navigation locks, pump stations, and certain levee systems begin to yield benefits only after construction is complete. Since society prefers to receive benefits sooner and pay costs later, economists use a process called compounding and discounting to account for these timing differences when valuing project alternatives. In this section I will review the basic concepts of compounding and discounting that are in standard use, then discuss the current literature on the subject, and finally move on to how the Corps uses this process in ways that can affect the outcomes of project evaluation.
14
$100 one year from now and a 5% interest rate can be earned in the interim, a deposit of $95.24 can be set aside today to meet the obligation since $95.24 can earn sufficient interest to meet the $1 obligation by the time it must be paid ($95.24 x 1.05 = $100). The $100 is referred to as a future value, while the $95.24 deposited today is referred to as a present value.
Increasing the present value of $95.24 to the future value of $100 is called compounding. Conversely, decreasing the future value of $100 to the present value of $95.24 is called discounting.
By the preceding logic, the present value of any benefit or cost depends critically upon when it is received or expended. For any streams of benefits and costs to be compared, the benefits and costs must be brought to a common point in time by discounting or compounding, as appropriate. The common point in time is referred to as the base year. The time frame can be defined in units smaller than a year, but the Corps’ convention is to treat a year as the smallest unit for this purpose. The present values that result from bringing all values to the base year can then be amortized over the life of the plan, i.e., converted to mathematically equivalent set of future values that are annual values.
For Corps plans, a base year commonly used is the beneficial completion year of the first alternative to be finished. Beneficial completion means that the plan is complete enough to provide its full level of benefits. If some of the benefits can be achieved before plan
implementation is complete, they are referred to as “benefits during construction,” and these benefits are compounded to the base year. An example of this is a storm protection levee that is built up to its full height in stages (called “lifts”). While the full level of protection will not be in place until the final lift is completed, a substantial amount of storm surge protection is realized after the first lift is completed. The selection of a base year is somewhat arbitrary, and does not affect the outcome of an analysis provided that all plans are evaluated using the same base year and discount rate.
The PGN requires that the benefits and costs of all economic development (NED maximizing) plans be discounted or compounded, as appropriate, to a common base year for all alternatives to facilitate comparisons of net benefits. The rate used to compound and discount is based on a formula set forth by the Water Resources Act of 1974. The formula is set using the average yield of long term government securities. Rigorous debate has taken place over whether this rate is appropriate, especially with regard to whether it properly accounts for inflation and taxes (Powers, 2003). Regardless of what rate is argued for, there is nothing in the literature that argues for not discounting, i.e., using a zero discount rate.
15
any rationale. To put this policy in perspective, the remainder of this section reviews the literature on discounting of environmental benefits.
The selection of a rate for discounting environmental outputs has been debated in economics and law literature for decades. The debate sparks from the length of the time horizon believed to be relevant for environmental decisions. Because environmental decisions are often
considered to have impacts on future generations, there is less acceptance of discounting for environmental outputs than there is for near term investments, especially of
non-environmental benefits, where the people investing are the same who are expected to reap any gains from the investment. Discounting of benefits for future generations is perceived as unfair. Some authors, such as Harrod (1948), have argued that the discount rate should be set to zero for environmental outputs because there is no reason for any generation to consider the welfare of future generations less important.
An important insight into understanding the issue was made by Irving Fisher (1930), who divided the desire to discount into two sources, pure time preference (we want good things sooner, rather than later), and a recognition that in a well functioning economy future
purchases are cheaper since one can expect to earn a positive rate of return on investments. One can invest money now, then use the original investment plus the return when buying the desired good later. Authors such as Cline (1992) argue that the first source of preference should be set to zero for environmental outputs, meaning that we value returns to future generations equal to returns to our own. This leaves a low interest rate, one that consists of only the economy’s expected rate of return, to account for the productivity of the economy. A complication with that view arises because even the basic fairness of valuing the welfare of future generations as highly as the present is not straightforward. As Baumol (1968) points out, redistribution for future generations will likely produce a “reverse” Robin Hood effect, because historical experience has shown that each generation is likely to be wealthier than the last. Even if future generations are poorer, there will be unintended income redistribution effects that accompany a pure time preference rate.
Is there a consensus on the appropriate rate to discount environmental benefits? Weitzman (2001) presents an entertaining answer to the question by actually surveying 2,800 Ph.D. level economists, receiving 2,160 replies. He then presents the results as a histogram showing that 46 economists favor a zero discount rate, while 2,111 favor a positive discount rate, the overwhelming majority ranging from 1 percent to 5 percent. Three respondents actually favored a small negative discount rate. Weitzman then surveyed 50 leading economists who are recognized for their expertise in the area, including a number of Nobel laureates.
16
was 3.96 percent, with a 2.94 percent standard deviation; the blue ribbon panel result was 4.09 percent for the mean, and 3.07 percent for the standard deviation.
Corps policy on the issue is settled as of this writing, with the agency simply prohibiting the practice of discounting environmental benefits. The prohibition is stated in the PGN in one statement: “Environmental benefits are not discounted, but should be computed on an average annual basis” (page E-154). In this instance the regulation uses “average annual” to mean a simple average over the period, rather than the more common usage in other parts of the same regulation where the term is used to indicate that values should be discounted to a base year and then amortized over the life of the plan, as explained below. As stated previously, the PGN requires that costs and all non-ecosystem benefits be discounted if they occur in future periods.
In its review of Corps methods for planning water resource projects, the National Research Council (2004) noted the Corps’ reluctance to apply discounting, i.e., to use a de facto zero discount rate, when valuing future streams of environmental benefits. Specifically, the council states:
Time is valuable for any resource that is productive, however, whether the services it yields are easily monetized (such as flood damage reductions) or not (enjoyment of a scenic vista). It does not seem wise to reject the prospects for discounting out of hand simply because the units being discounted are physical, rather than financial. The Corps may wish to reevaluate its cost effectiveness and incremental analysis to rectify this possible inconsistency. (p. 48)
The effects of this policy on analysis outcomes will be addressed in Chapter IV.
There are other notable inconsistencies in the analysis of economic development plans as compared to ecosystem development plans. For example, NED analysis leads to the
identification of a single most efficient plan, whereas CE\ICA leads to an array of choices (the set of plans that produces each level of output at the lowest cost). Also, NED analysis can demonstrate that a plan is justified, i.e., that its benefits outweigh its costs, where CE\ICA cannot demonstrate efficiency (since we cannot use it to calculate net benefits in dollars and, therefore, claim greater welfare from plan implementation when benefits exceed costs). Those inconsistencies spring from the nature of the analysis, not from differences in policy or in the way that the two types of analysis are conducted in the field.
This dissertation will focus on three of the inconsistencies between the way that net benefits and CE\ICA are performed since those are areas where the differences in policy and practices could lead to poor decision making. These differences are the exclusion of incidental economic impacts, the use of the best buy rule, and the policy prohibiting the discounting of
17 Chapter III: Study Methods and Data Sources
I posit that three policies and practices currently employed by the Corps of Engineers in conducting cost effectiveness and incremental cost analysis can cause the selection of suboptimal projects, and in some instances, the selection process will be biased towards selecting plans that are delayed in implementation and/or take longer to complete. These policies and practices are the result of flawed logic, are inconsistent with the way the Corps analyses economic development projects, and are out of step with practices advocated in broadly accepted academic literature.
The three policies and practices are:
1. The policy of excluding incidental economic costs and benefits in the plan evaluation and selection process
2. The policy of eliminating efficient plans that are not best buy plans
3. The policy of prohibiting the discounting of environmental benefits
The analytical approach used in this dissertation is primarily quantitative in nature. I deal with the potential welfare loss caused by the Corps’ treatment of incidental economic effects using a case study, and the second two issues with using simple counter examples which make the illogic and negative consequences of the policies intuitively obvious.
With project proposals that yield all dollar-denominated benefits and costs, one can subtract the costs of each project proposed from their respective benefits to see which maximizes net benefits, and any method that selects a project other than the one that maximizes net benefits clearly fails to maximize public welfare. The fact that environmental benefits are not
expressed in dollars makes it impossible to assess the welfare maximizing performance of the CE\ICA method in a this way.
One way to evaluate whether a CE\ICA that ignores incidental economic effects might yield a suboptimal solution is to use CE\ICA to evaluate an economic development project. While net benefits analysis cannot be used to optimize environmental projects, CE\ICA can be used to analyze projects where all benefits and costs are dollar denominated. In fact, CE\ICA should yield the same results as net benefits analysis because the benefits, expressed in dollars, would be compared on a marginal basis to dollar-denominated costs to determine the most efficient outcome. This is exactly what net benefits analysis does.
18
such plans for both their targeted and incidental benefits and costs. Neither of these conditions hold for most Corps environmental projects.
This dissertation will use data from a study done for a hurricane protection plan produced by the Corps, the Morganza, Louisiana, to the Gulf of Mexico, Hurricane Protection Plan (USACE, 2002). The Morganza study included an assessment of significant incidental economic effects of the plans developed. In fact, the incidental effects were large enough to influence the outcome of the study. Complete data are available in detail for all of the economic impacts of the plan, with all of the benefits and costs estimated in dollars. Hence, the analysis as
19
Chapter IV: Assessment of Current Guidance and Practices
(i) Potential Effects of Excluding Incidental Impacts: Morganza to the Gulf of Mexico Feasibility Study
Cost effectiveness and incremental cost analyses that ignore incidental economic impacts can lead to suboptimal decisions because the benefits and costs of the alternatives are misstated. Cost effective plans may be eliminated and cost ineffective plans may advance during the initial CE\ICA when incidental economic effects are excluded from the assessment, leaving decision makers with a short list comprised of inefficient plans from which to select. A case study is presented to demonstrate this thesis. The case study compares welfare changes that would result from implementing a plan selected by the currently used CE\ICA method to changes in welfare that would result from a selection process that includes incidental economic impacts.
NED Analysis Conducted in Morganza Study. The Morganza to the Gulf of Mexico Hurricane Protection Plan was designed by the New Orleans District of the Corps. The purpose of the plan is to provide hurricane and flood protection to people and property along the Louisiana coast in the vicinity of Houma, Louisiana. The description of the plan and economic data used herein were taken from the plan feasibility study (USACE, 2002). All values cited from the study are stated in average annual dollars. This chapter reviews the study and its results as published.
The Morganza project area includes portions of two parishes, Lafourche and Terrebonne. The area is located southwest of New Orleans, bordered on the west by Bayou Du Large and
Louisiana Highway 311, on the north and east by Bayou Lafourche, and on the south by the Gulf of Mexico.
Three major flood events in the area caused much of the impetus for the project. In 1985, Hurricane Juan caused major flooding throughout the southern part of the state, with
residential and commercial damages totaling over $100 million. Over 800 homes in Terrebonne Parish, and about 40 percent of homes in Lafourche Parish were inundated. In 1992 Hurricane Andrew caused significant flood damage to over 1800 homes in Terrebonne, with the majority of the damage occurring south of Houma. In addition, serious damages were caused by a backwater flood that occurred in 1991.
20
To produce the desired benefits, five different alignments of levees and other structures were planned to block hurricane surges. Three of these alignments were screened out on the basis of cost. The remaining two plan alignments were then developed further, with several
alternative levels of protection (levee heights) for each alignment. Each alignment would consist of earthen levees and water control structures.
The first design was the Highway 57 Alignment, which was designed to parallel Louisiana Highway 57, south of Lake Boudreaux, and north of the Falgout canal. This alignment would use either a floodgate or a lock on the Houma Navigation Canal (HNC) south of Bayou Grand Caillou.
The second alignment considered covers a smaller portion of the area, and was labeled the “Recon Alignment” since it had originally been proposed in an earlier reconnaissance study. This would run parallel to Highway 90, north of Lake Boudreaux, and South of Houma. This system would be closed with a floodgate on the HNC. A lock was not considered because it would leave industries north of the HNC unprotected.
In addition to these alternatives, buyout/relocation option was considered for the areas to be protected. This option was ultimately determined to not be cost effective.
Inundation reduction benefits were computed in several categories. In addition to reduced structure and structure content damages, the team calculated benefits from reducing costs incurred when a storm strikes, including:
emergency costs for government agencies
cost to evacuate residents
subsistence costs for storm victims
reoccupation costs
cleanup costs
Along with inundation reduction benefits, several other types of benefits are expected to be realized from implementation of the plan. These other benefits include:
reduced damages to local fishing fleets from wind and wave (safe harbor)
reductions in inundation damages to crops and crawfish farms
reduction of salt water intrusion (which lowers the cost of drinking water provided by
municipalities, as well as production costs for local industry that require substantial amounts of water)
21
reduced administration costs for the Flood Insurance Agency (a smaller footprint for the
hundred year storm would reduce the number of homeowners needing policies and making claims)
In addition to variance of closing structure type, each alignment was evaluated using several different levels of protection. Levees that provided protection from 50, 85, and 100 year storms were evaluated. As with all of the Corps’ projects that are designed for gaining economic benefits, this study was evaluated using the traditional net benefits approach.
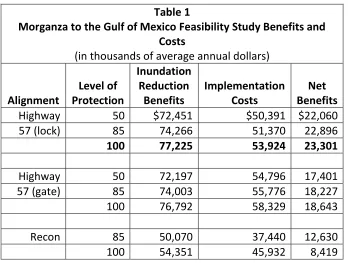
Table 1 shows a list of the benefits as reported in the study for the two alignments and the levels of protection assessed in the final stages of the study. Note that the plan that maximizes the difference between all benefits and costs, the NED plan, is the Highway 57 Alignment with 100 year protection (meaning that the system was designed to prevent flooding from a storm with a .01 return frequency). This plan, shown in bold in all of the tables that follow, maximizes national wealth, and therefore, was the plan recommended by the study team.
Costs for the Recon Plan were considerably lower, but because of the plan’s smaller geographic area it reduced benefits to a large number of homes and businesses, and both Highway 57 plans produced higher net benefits than the Recon Plan.
22 Table 1
Morganza to the Gulf of Mexico Feasibility Study Benefits and Costs
(in thousands of average annual dollars)
Alignment
Level of Protection
Inundation Reduction
Benefits
Implementation Costs
Net Benefits
Highway 50 $72,451 $50,391 $22,060
57 (lock) 85 74,266 51,370 22,896
100 77,225 53,924 23,301
Highway 50 72,197 54,796 17,401
57 (gate) 85 74,003 55,776 18,227
100 76,792 58,329 18,643
Recon 85 50,070 37,440 12,630
100 54,351 45,932 8,419
Source: U.S. Army Corps of Engineers, Mississippi River and Tributaries, Morganza, Louisiana, to the Gulf of Mexico, Hurricane Protection Final Feasibility Report, Economics Appendix, March, 2002.
One thing that the Morganza study shows is that a critical factor in determining the most efficient plan may be an economic benefit or cost that is not a direct implementation cost for a project. Yet, as stated previously, the Corps does not use these impacts in conducting CE\ICA. For example, in the LCA study cited previously, where habitat creation is the targeted benefit, storm surge reduction benefits were estimated for plans that build marsh, but these benefits were not directly accounted for in the CE\ICA performed for that study.
Given that the Corps is not generally factoring non-implementation costs into its CE\ICA, it is useful to look at how plan selection can be altered where these costs are critical. Hence, the following shows a reanalysis of the Morganza evaluation using CE\ICA without inclusion of the incidental costs.
Cost effectiveness and incremental analysis for the Morganza plan. In this section, the array of plans developed for the Morganza plan is reevaluated using the Corps’ current CE\ICA
23
just as habitat outputs are the targeted benefits for environmental plans. Other benefits achieved will be treated as incidental. This is consistent with the way such benefits are handled in CE\ICA conducted by the Corps.
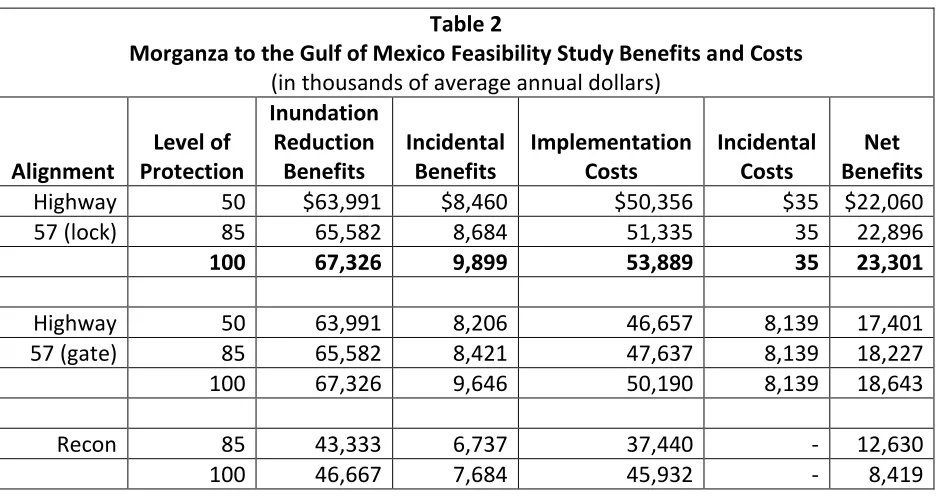
Table 2 shows the plan's benefits segregated into two parts: inundation reduction benefits, and incidental benefits. Costs are displayed in the table in a similar manner, i.e., implementation costs and incidental economic costs, such as navigation losses, are shown separately.
Table 2
Morganza to the Gulf of Mexico Feasibility Study Benefits and Costs
(in thousands of average annual dollars)
Alignment
Level of Protection
Inundation Reduction Benefits
Incidental Benefits
Implementation Costs
Incidental Costs
Net Benefits
Highway 50 $63,991 $8,460 $50,356 $35 $22,060
57 (lock) 85 65,582 8,684 51,335 35 22,896
100 67,326 9,899 53,889 35 23,301
Highway 50 63,991 8,206 46,657 8,139 17,401
57 (gate) 85 65,582 8,421 47,637 8,139 18,227
100 67,326 9,646 50,190 8,139 18,643
Recon 85 43,333 6,737 37,440 - 12,630
100 46,667 7,684 45,932 - 8,419
Source: U.S. Army Corps of Engineers, Mississippi River and Tributaries, Morganza, Louisiana, to the Gulf of Mexico, Hurricane Protection Final Feasibility Report, Economics Appendix, March, 2002.
We can use this small list of plans to perform a CE\ICA. Since the alternatives are not combinable, the analysis is simpler than the normal process of combining alternatives to generate a large number of possible feature combinations. To show the steps in the CE\ICA, I produced Tables 3-8 using data from tables included in the Economics Appendix in the
Morganza study.
24
maximizing (or NED) plan would be the Highway 57 Alignment with a floodgate and an 85 year level of protection.
Table 3
Benefits and Costs Excluding Incidental Economic Impacts
(in thousands of average annual dollars)
Alignment
Level of Protection
Inundation Reduction
Benefits
Implementation
Costs Net Benefits
Highway 57 50 $63,991 50,356 $13,635
(lock) 85 65,582 51,335 14,247
100 67,326 53,889 13,437
Highway 57 50 63,991 46,657 17,333
(gate) 85 65,582 47,637 17,945
100 67,326 50,190 17,135
Recon 85 43,333 37,440 5,894
100 46,667 45,932 735
Table 4 shows cost effectiveness analysis excluding incidental economic impacts. For this and the remaining tables the plans are listed with the number representing the level of protection, and the designations R, L, and G meaning Recon Alignment, Highway 57 Alignment with a lock, and Highway 57 Alignment with a gate, respectively.
Table 4
Cost Effectiveness Analysis Excluding Incidental Benefits and Costs
(in thousands of average annual dollars)
Plan
Inundation Reduction Benefits
Implementation
Costs Net Benefits
85R $43,333 $37,440 $5,894
100R 46,667 45,932 735
50G 63,991 46,657 17,333
50L 63,991 50,356 13,635
85G 65,582 47,637 17,945
85L 65,582 51,335 14,247
100G 67,326 50,190 17,135
25
Plans 50L, 85L, and 100L (the Highway 57 Alignment with a lock and 50, 85, and 100 year levels of protection) are eliminated because other plans listed in the table provide the same levels of output for lower implementation costs.
Table 5 shows the final list of efficient plans produced if we exclude incidental economic impacts.
Table 5
Incremental Cost Analysis Excluding Incidental Effects
(in thousands of average annual dollars)
Plan Benefits Costs
Net Benefits
Change in Net Benefits
Incremental Cost
Average Cost
No Action $0 $0 $0 NA NA $0
85R 43,333 37,440 5,894 5,894 .86 .86
100R 46,667 45,932 735 (5,159) 2.55 .98
50G 63,991 46,657 17,333 16,599 .04 .73
85G 65,582 47,637 17,945 612 .62 .73
100G 67,236 50,190 17,135 (810) 1.46 .75
The change in net benefits (column 5) indicates the change in national wealth realized in going from one level of expenditure and output to the next. Incremental costs represents the dollar cost of producing each additional dollar of benefits.
Benefits exceed costs for all of the alternatives displayed, and each higher level of benefits requires a greater expenditure of costs. Each plan is efficient for producing a given level of output since no plan produces the same level of output for a lower cost. Planners can recommend any of these plans since they all have benefit-cost ratios that are greater than or equal to 1. Note that plans 100R and 100G show a negative change in net benefits compared to the plans listed above them. The implications of this possibility in cost effectiveness analysis are discussed later in this chapter.
26
appear to be more efficient than the same alignment with a lock. We have also ignored the incidental costs of the lock (delay costs suffered as vessels lose time traveling through the structure), but the shutdown cost imposed by the floodgate is far more significant than the delay cost of the lock.
All of the plans listed in the final array of a CE\ICA are considered legitimate choices. But a choice from this final array will always be suboptimal, regardless of the plan selected, since the optimal plan has been eliminated from consideration. The loss of welfare that would be suffered from choosing any of these plans over the NED Plan would be equal to the difference between the net benefits of the NED Plan ($23.3 million) and the net benefits of whatever plan is chosen with CE\ICA. The loss generated by each possible selection is displayed below in Table 6.
Table 6
Welfare Loss Suffered by Excluding Incidental Effects
(in thousands of average annual dollars)
Plan Net Benefits Welfare Loss
NED Plan 23,301
85R 5,894 17,407
100R 735 22,566
50G 17,333 5,968
85G 17,945 5,356
100G 17,135 6,166
27 Table 7
Cost Effectiveness Analysis Including Incidental Benefits and Costs
(in thousands of average annual dollars)
Plan Total Benefits Total Costs Net Benefits
85R $50,070 $37,440 $12,630
100R 54,351 45,932 8,419
50G 72,197 54,797 17,400
50L 72,450 50,391 22,059
85G 74,003 55,776 18,227
85L 74,266 51,370 22,896
100G 76,972 58,330 18,642
100L 77,225 53,924 23,301
In this revised analysis, the NED Plan is not eliminated. Plans 50G, 85G, and 100G (the Highway 57 Alignment with a floodgate and 50, 85, and 100 year levels of protection) are eliminated due to the business losses resulting from the gate obstruction, just as they were eliminated in the NED analysis done in the Morganza study. Table 8 shows the results of the incremental cost analysis performed with incidental effects included.
Table 8
Incremental Cost Analysis Including Incidental Effects
(in thousands of average annual dollars)
Plan Benefits Costs
Net Benefits
Change in Net Benefits
Incremental Cost
Average Cost
No Action $0 $0 $0 NA NA $0
85R 50,070 37,440 12,630 12,630 .75 .75
100R 54,351 45,932 8,419 (4,211) 1.98 .85
50L 72,450 50,391 22,059 13,640 .25 .70
85L 74,266 51,370 22,896 836 .54 .69
100L 77,225 53,924 23,301 405 .86 .70
The influence of incidental costs is easy to see in this simplified example. For many
28
down to only 150 possible plans after planning constraints were imposed. Plans that make more sense than those in the final array—or those that are more efficient—may not as easily occur to planners since such plans may be lost among the hundreds, or even thousands, of points displayed on the graph that represents the alternatives.
This assessment of benefits and costs shows that it is possible for a plan to be justified (its benefits outweigh its costs) even though it is incrementally unjustified. Plan 100R represents an increment above Plan 85R (it achieve higher benefits enabled by an expenditure of greater costs and it has positive net benefits), yet the nation's net welfare would decrease by increasing scale from the 85 year level of protection to the 100 year level because the increase in costs from the larger plan would outweigh the increase in benefits.
For plans where benefits are not dollar denominated, the same phenomenon is possible, though it would generally not be apparent in the analysis data. We can only tell that this increase in scale makes society worse off in this case study because both benefits and costs are stated in dollars. If the benefits listed in the table were enumerated in habitat units created instead of thousands of dollars, we could not subtract the costs from the benefits and directly measure the welfare change. We would only know that going from Plan 85R to Plan 100R would increase our habitat units from 37.4 units to 45.9 units and our costs from $50.1 million to $54.4 million, not whether we were better or worse off from making this greater
expenditure. Hence, even net CE-ICA cannot establish which plan is the most efficient to construct; it merely establishes which plan is the most efficient for producing each level of output.
(ii) Potential Effects of Eliminating Non-Best Buy Alternatives
When we evaluate plans where all costs and benefits are known and are dollar-denominated there is no ambiguity as to which plan is the most efficient, and which plans are less efficient. Whichever plan gives the highest excess of benefits over costs is the welfare maximizing plan.
The marginal utility of environmental outputs, or the extra satisfaction gained by obtaining additional non-dollar denominated outputs, is less clear. To facilitate plan selection, including the preferred level of output to recommend for implementation, the current practice is to calculate the incremental level of output when going from one efficient plan to the next larger scale efficient plan and then compare the incremental cost of output to the incremental cost of obtaining the output. As was discussed in the prior chapter, the Corps goes one step further and reduces the list of potential recommendations by determining which plans are “best buy” alternatives and eliminating the other efficient plans.
29
Once best buys are identified, the other efficient plans are eliminated from consideration in an effort to achieve greater efficiency by limiting choices to best buy plans. The problem with this approach is that it looks only at the average cost of additional output, not at the additional value of the output compared to its additional cost.
As an illustration of the problem, consider the following analogy. Suppose the reader agrees to the purchase price of a new car of $30,000. Prior to finalizing the contract, the dealer offers a chance to purchase a second car for $29,000 if the two cars are purchased together. Under current Corps guidance, the two car purchase would be a best buy since a larger amount of the good is obtained at a lower average cost, i.e., an average of $29,500 each for two cars instead of $30,000 for one car. By policy, the one car option would be eliminated. If the dealer offers still another car at a lower cost than the second car (provided that three are purchased), the three car deal would become the best buy, and the two cars alternative would be eliminated. The reader’s choices would be to buy either no car or three cars. But the reader may not want more than one car, or at least not be willing to pay as much for a second or third car as the dealer is asking. Restated, the reader’s marginal utility (extra satisfaction or benefit) for the second and third cars may be less than the marginal cost of purchasing them. In such a case there would be a welfare loss if more than one car were purchased. For example, if the reader would be willing to pay only $20,000 for a second car, a loss of $9,000 in welfare would result from purchasing the second car, and so on. In this example the best buy plan is not a better buy than purchasing only one car since welfare is reduced if we buy more than one car. In fact, the best buy plan is an inferior purchase.
30 (iii) Effects of Not Discounting Environmental Benefits
The policy of not discounting environmental benefits has at least two implications for project selection which I will demonstrate in this section. The first is that not discounting
environmental benefits leads to a bias towards selecting projects that take longer to construct; the second is that the failure to discount leads to a bias towards selecting projects that are delayed in their beginning of implementation. As Viscusi (2007) points out, a zero discount rate sets up an anomaly in which delaying action is always preferable. The discussion below places this idea in the context of Corps environmental project evaluations, i.e., in performing CE\ICA.
How refraining from discounting benefits affects outcomes can be shown with a simple example. Assume that within one year a project can be constructed for $1 million that will produce some number of habitat units when construction is complete, and that the Corps’ contractor has agreed to accept payment at the completion of construction. If a 5% rate of return can be gained in the market, the Corps can set aside $1,000,000 x 1/(1.05), or $952,381 to pay for the project since this will grow to $1,000,000 by the time that payment must be made. The $952,381 is the present value of the project cost at the time that the contract to construct it is let.
Now let us suppose that the Corps decides to build the same project over a two year period, and will pay the contractor $500,000 when the project is half finished at the end of Year 1, and the same amount at the end of Year 2 when the project is completed. The Corps could pay for the project by setting aside $500,000 x 1/(1.05) for the first payment, and $500,000 x
1/(1.05)^2 for the second payment, a total of $929,705. This would represent a savings of $22,676. In general, the longer payments are delayed, the lower the cost per habitat unit provided. Restated, the longer it takes to implement a plan the more efficient it appears to be. Intuitively, tying up resources for a longer time period before any benefits are received would seem less efficient.
Why does the Corps not take as long as possible to construct all of its projects? For the Corps’ NED projects, where benefits and costs are denominated in dollars, there is no incentive to delay costs since a longer construction period also delays benefits, and benefits are discounted at the same rate as costs. For environmental projects, where benefits not discounted, there is no cancelling out of the “cost delay” benefit gained by increasing the construction period.