ENGINEERING AND GINNING
Effects of Adding Moisture at the Gin Lint Slide
on Cotton Bale Microbial Activity and Fiber Quality
David T.W. Chun *and W. Stanley Anthony
D. T.W. Chun , USDA-ARS Cotton Quality Research Station, P.O. Box 792, Clemson, SC 29633; W. S. Anthony, USDA-ARS Cotton Ginning Research Unit, 111 Experiment Station Road, P.O. Box 256, Stoneville, MS 38776.
* Corresponding author: [email protected] and [email protected]
ABSTRACT
The effects of adding water to ginned cotton to reduce bale-packaging forces, to provide possible beneficial effects on fiber quality and processing at the mill, and to increase bale weight on cotton bale microbial activity and fiber quality were studied under conditions where excess moisture was added to determine if any fiber degradation occurred within four months of storage. Water was added at the gin lint slide at 0, 5.9, 9.1, 21.8, and 25.0 kg per bale as an over spray before press-ing into bales and storpress-ing. After 116 d, samples were removed for fiber quality and microbial activity testing. Fiber length, immature fiber, and dust particles were reduced by the addition of moisture. Neps and short fiber content increased with increased levels of moisture. Color went from middling (31) to strict low middling-spot-ted (43) as moisture content increased. Fiber became darker and more yellow with the higher moistures. Microbial activity was influenced by moisture content. The large increase in mold ac-tivity, which may be considered an unnecessary health risk, is a concern. Microbial activity was not uniformly dispersed throughout the treated bales and this spotty behavior may contribute to difficulties during laydown at the mills.
B
efore cotton is spun, cotton fibers must be removed from the seed, cleaned, and the excess moisture removed. Seed cotton moisture plays an important role on ginning efficiency. Seed cotton is usually dried to reduce moisture content because dry cotton is more easily cleaned, which produces a better leaf grade. Since drying can lower fiber strength, which causes more fibers to break during ginning,excessive drying may result in lower yarn quality. Bale presses, which have to exert more pressure on dry cotton, may experience increased strain. On the other hand, high seed cotton moisture may preserve fiber strength. The cotton is not as easily cleaned and becomes more difficult to separate into individual locks, resulting in lower leaf grade and the possibility of wads that can choke or even stop gin machinery completely. The optimum moisture content of lint at the gin stand is probably between 5.0 and 8.5%, the optimum range is 6.0 to 8.0%, and 7.0% lint moisture content is the average optimum most frequently used for efficient, quality separation of lint from the seed. Because most classing systems offer premiums for better leaf grade, these incentives tend to encourage more drying to improve trash removal. Cotton is usually dried, cleaned, ginned, and packaged at moisture contents well below its eventual equilibrium moisture content in storage.
which led to decreased neps and short fiber content in the opening room process stock, decreased neps and short fiber content and improved fiber alignment in the card sliver, and decreased percentage of comber noils at the combing step.
Humidified air or direct water spray are the two methods used to restore moisture to cotton. Under most circumstances, humidified air rarely adds more than 2% moisture to a bale, so direct water spray with or without a surfactant is more commonly used because greater quantities of moisture can be added to the bale. At the same time, greater care must be exercised when excess moisture is added and cotton is stored wet, because some fiber properties may be lowered and the results of microbial activity may further reduce the value of the cotton (Bargeron et al., 1986; Fleming and Thaysen,1921; Griffin and Harrell, 1957; Hall and Elting, 1951).
The objective of this study was to determine if the effects of moisture sprayed on fiber at the lint slide adversely affected fiber quality, bale packaging, and fiber quality during storage.
MATERIALS AND METHODS
Cotton and moisture treatment. Cotton was collected from the 2000 harvest year. Enough seed cotton from Stoneville 4892BR (Stoneville Pedigreed Seed; Memphis, TN) for five bales was harvested 11 Oct. 2000. The seed cotton was stored under atmo-spheric conditions in trailers under a covered trailer storage shed. On 25 May 2001, the cotton was ginned in a full-scale gin at the Cotton Ginning and Research Laboratory, Stoneville, MS. Moisture treatments consisted of additional moisture applied at the lint slide after ginning and before baling. The moisture treatments consisted of a non-treated control and four levels of water applied to the cotton. Approximately 635 kg (1400 pounds) of seed cotton were ginned for each approximately 226.8 kg (500-pound) bale treat-ment and each treattreat-ment bale was placed in a 0.15 mm (six-mil) thick plastic bag with two additional layers of plastic bags placed over the first bag. This covering method was used to maintain the moisture in the bale, as high as possible, since this study was conducted to establish the response of fiber proper-ties to specific moisture levels. The industry typically uses in order of increasing permeability, polyethylene bags with small diameter holes, woven polypropyl-ene, or burlap. The bales were stored under ambient conditions for a period of 116 d.
The ginning sequence consisted of a cylinder cleaner, stick machine, cylinder cleaner, extractor feeder/gin stand, and one saw-type lint cleaner. For the non-treated control (Treatment 1), no moisture overspray was applied. For the water treatments 2, 3, 4 and 5, three conventional spray nozzles applied water as an overspray to the surface of the cotton as the lint came down the lint slide. The water treat-ments consisted of sufficient water oversprays for approximately 4.54, 9.07, 18.14, and 22.68 kg (10, 20, 40, and 50 pounds, respectively) per 226.8-kg (500-pound) bale of cotton for treatments 2, 3, 4, and 5, respectively. The amount of water overspray was regulated by using three nozzle tips with 0.025, 0.025, 0.0508, or 0.076 mm (0.001, 0.001, 0.002, or 0.003 inch, respectively) orifice diameters, for treatments 2, 3, 4 and 5, respectively. These nozzle tips were attached to a pipe connected to a standard residential water hose. Since the pressure and water volume were from a municipal source, the output of the tips at various valve settings was calibrated by capturing water from the tips.
Before each of the water applications, five samples were taken as the cotton came up the battery condenser for HVI evaluation, and nine samples were taken for moisture evaluation. After the moisture treatment, nine samples were taken for lint moisture evaluation from each of the treated cottons. Each of the cottons was pressed into a bale for a total of 5 bales, each consisting of one of the 4 water applica-tions and the non-treated control. The bales were pressed to a platen separation of about 48.26 cm (19 inches) (Table 1). The bales were then weighed and placed in storage.
Table 1. Target and actual level of moisture added to bales (226.8-kg bales) during ginning
Treatment moisture (kg)Target moisture (kg)Actual weight (kg)Bale z Bale press pressure (N/cm2) Cotton moisture at lint flue (%)
1 0.00 0.00 242 1681 6.0
2 4.54 5.81 231 1155 4.8
3 9.07 8.84 233 1147 5.1
4 18.14 21.73 258 1253 5.5
5 22.68 25.08 246 920 5.2
z Calculated from difference in lint moisture.
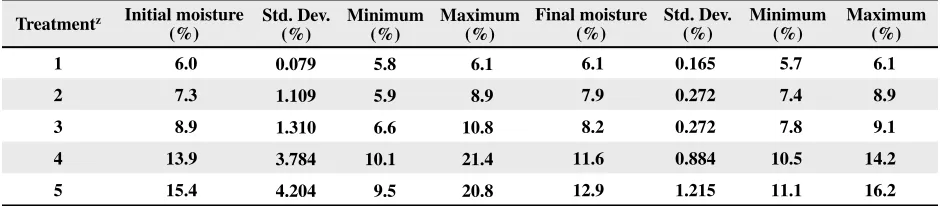
Table 2. Average and standard deviation of percentage moisture, and minimum and maximum percentage moisture at baling (initial) and after storage (final) for 116 d from 25 May to 18 Sept. 2001
Treatmentz Initial moisture
(%) Std. Dev. (%) Minimum (%) Maximum (%) Final moisture (%) Std. Dev. (%) Minimum (%) Maximum (%)
1 6.0 0.079 5.8 6.1 6.1 0.165 5.7 6.1
2 7.3 1.109 5.9 8.9 7.9 0.272 7.4 8.9
3 8.9 1.310 6.6 10.8 8.2 0.272 7.8 9.1
4 13.9 3.784 10.1 21.4 11.6 0.884 10.5 14.2
5 15.4 4.204 9.5 20.8 12.9 1.215 11.1 16.2
z Target amount of water sprayed on treatments 2 through 5 was 4.54, 9.07, 18.14, and 22.68 kg per 226.8-kg bale,
respec-tively. Treatment 1 was the control with no water added.
The storage period was ended after 116 d on 18 Sept. 2001. The bales that had a universal density (53.3 cm x 139.7 cm x 78.7 cm with an approximate density of 448.5 kg/m3) were laid on their side with
the compression layers perpendicular to the floor in the full-scale gin. Before the bale ties were removed, the area between the exterior ends, starting at about 7.6 cm from each end, was divided and marked into 10 equal zones or layers along the compres-sion layers. The ties were cut and the comprescompres-sion layers were separated at each marked layer/zone, and samples were taken from within each zone. The samples taken at each layer/zone consisted of 10 samples for moisture content, 5 samples for Ad-vanced Fiber Information System (AFIS), 3 samples for High Volume Instrument (HVI) classification, and 10 samples for biological degradation evalua-tion. The AFIS and moisture analyses, determined by the oven method (ASTM, 1971), were conducted at the Stoneville Gin Laboratory. The Agricultural Marketing Service Classing Office at Memphis, TN, conducted the HVI classification analysis. The HVI and AFIS samples were conditioned to meet ASTM requirements before the samples were tested. The samples for the biological degradation study con-sisted of 100-gram samples double-bagged with two polyethylene bags in order to reduce drastic moisture composition changes during transport. The samples
were immediately transported by government vehicle and arrived at the Cotton Quality Research Station at Clemson, South Carolina, the same day.
Determination of microbial populations. The determination of microbial populations associated with the cotton samples in each moisture treatment consisted of assays for the total bacteria, Gram-nega-tive bacteria, and fungal populations. On arrival at Cotton Quality Research Station at Clemson, the samples were sorted, randomized, and sub-sampled immediately for microbial population assays. Mi-crobial assay were made from 1.0 gram of lint from each sample for total bacteria and total gram-negative bacterial populations using the method described by Chun and Perkins (1996), and for fungal populations using the method described by Chun and McDonald (1987). Because of the size of the study, the incuba-tion periods at room temperature (20 ± 2°C) were extended and ranged from 4 to 11 d for the bacterial assays and from 10 to 17 d for the fungal popula-tion assay.
subsamples were randomly taken from each of these zones for assay. The samples from all the treatment bales were then randomly assigned a number from 1 to 300, and the samples assayed sequentially for a completely randomized split block design. Microbial populations (colony forming unit per gram lint; cfu) were corrected for dry weight, and transformed for analysis using log10 (cfu + 1). Data were analyzed
us-ing release 8.00 of SAS (SAS Institute Inc.; Cary, NC) and mean separations conducted using Duncan’s mul-tiple range test. Additional testing, data manipulation, and statistics were obtained using Microsoft EXCEL 2000 (Microsoft Corporation; Redmond, WA).
RESULTS AND DISCUSSION
After storage from 25 May to 18 Sept. 2001, some moisture was lost from most of the treatments, even though the bales were triple sealed in poly-ethylene bags (Table 2). Upon opening the bales, unusually strong earthy and musty odors escaped from the polyethylene bags covering the water-aug-mented bales. Visible water damage in the form of yellow or dark discolorations was observed on the surface of the bales of treatments 4 and 5, which were heavily augmented with water (Figure 1). The two bales with no overspray and just a small amount of added water (treatments 1 and 2) increased in water content slightly from 6.0 to 6.1% and 7.3 to 7.9%, respectively. These did not exhibit water damage or unusual odors. In addition, the range of moisture content was narrower and less variable than the rest of the moisture treatments (Table 2). The distribution of moisture within the bale after storage is illustrated in Figures 2 and 3 for the low and high moisture bales, respectively.
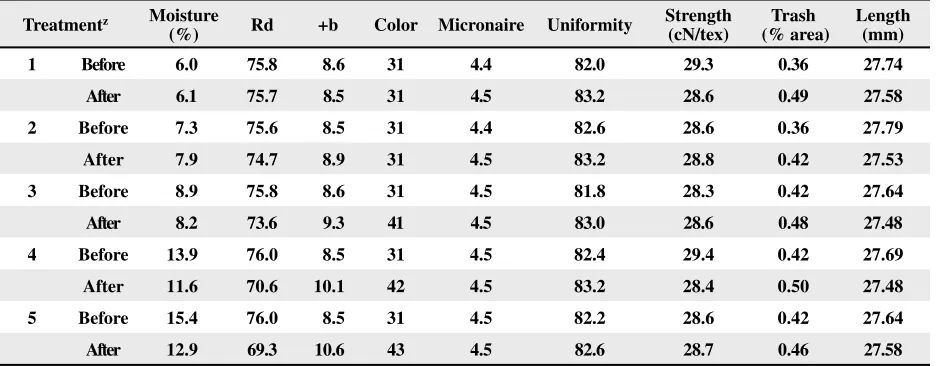
Since bale replications were not used, only trends in data can be given. The AFIS data in Table 3 is the average of 5 subsamples at 10 layers and 3 analyses per subsample. The AFIS results indicate that fiber length, immature fiber, and dust particles were reduced by moisture. Short fiber content and neps increased with increasing moisture content. HVI sample classification before and after storage is presented in Table 4. The HVI color value de-creased from middling (31) to strict low middling spotted (43) as moisture content at the end of storage increased from 6.1 to 12.9% (Figure 4). Reflectance (Rd) averaged 75.7, 74.7, 73.6, 70.6, and 69.3, and yellowness (+b) averaged 8.5, 8.9, 9.3, 10.1, and 10.6 for moisture levels 1, 2, 3, 4, and 5, respectively.
Figure 1. Typical yellow or dark discoloration water damage observed when the polyethylene coverings were removed from the bales in which moisture was added.
Bale layer
1 2 3 4 5 6 7 8 9 10
M
oi
st
ur
e
(%)
5.6 5.8 6.0 6.2 6.4
Figure 2. Average moisture at each of the 10 equal layers delineated within the bale, which begin approximately 76.2 mm from the exterior of the bale, for the bale with 4.54 kg water per 226.5-kg bale.
Figure 3. Average moisture at each of the 10 equal layers delineated within the bale, which begin approximately 76.2 mm from the exterior of the bale, for the bale with 22.68 kg water per 226.5-kg bale.
Bale layer
1 2 3 4 5 6 7 8 9 10
M
oi
st
ur
e
(%)
As moisture increased, the bales became darker and more yellow, which supports previous research (Brushwood and Chun, 1998; Chun and Brushwood, 1998; Fischer et al., 1980; Nickerson, 1964). Treat-ment 2 with 5.81 kg of water added per bale increased in yellowness and grayness.
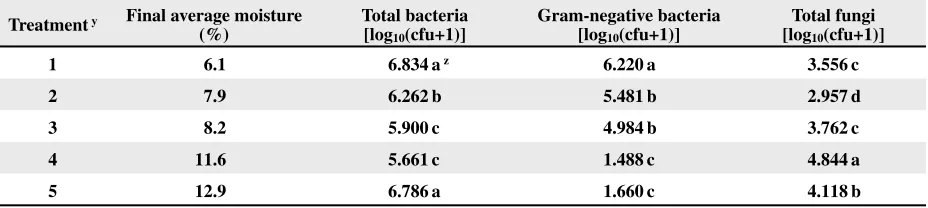
Microbial populations were influenced by the add-ed moisture, but not in a consistent manner (Table 5). While total bacterial populations varied significantly from one treatment to another, the values could also be representative of the inherent variation in cotton. On the other hand, the Gram-negative bacterial popu-lations decreased in numbers with increasing added moisture. This is inversely correlated with the increase in yellowness and grayness associated with increased moisture (Table 4), and contradicts the observation by Fischer et al. (1980) that the yellowness of raw cottons was significantly and positively correlated
Figure 4. Effect of moisture content on color grade of the cotton after storing the bale for 116 days from 25 May to 18 Sept. 2001. The five moisture levels are the final moisture levels for treatments 1 through 5, which were oversprayed with 0, 4.54, 9.07, 18.14, and 22.68 kg per 226.8-kg bale, respectively.
Table 3. Advanced Fiber Information System of water-treated balesx
Treatmenty by width Length (mm)
Upper quartile
(mm) z
Short fiber (w:w, %)
Immature
fiber (%) ratio (%) NepsMaturity Seed coat neps (g-1) Dust (g-1) Trash (g-1)
Visible foreign matter (g-1)
1 24.42 29.32 8.52 3.65 0.90 188.78 11.76 504.32 109.44 2.00
2 24.05 29.07 9.04 3.68 0.89 203.72 10.10 389.40 91.40 1.64
3 23.98 28.91 8.75 3.56 0.89 201.76 10.06 389.50 96.04 1.70
4 24.02 29.01 9.09 3.47 0.90 208.66 10.56 418.76 104.44 1.90
5 23.88 28.91 9.39 3.47 0.89 212.40 10.54 411.18 100.84 1.84
x Each number is based on 50 subsamples with 3 readings per subsample.
y Target amount of water sprayed on treatments 2 through 5 was 4.54, 9.07, 18.14, and 22.68 kg per 226.8-kg bale,
respective-ly. Treatment 1 was the control with no water added.
z Upper quartile by weight.
Table 4. Average HVI data before and after bale storage
Treatmentz Moisture
(%) Rd +b Color Micronaire Uniformity Strength (cN/tex) (% area)Trash Length (mm)
1 Before 6.0 75.8 8.6 31 4.4 82.0 29.3 0.36 27.74
After 6.1 75.7 8.5 31 4.5 83.2 28.6 0.49 27.58
2 Before 7.3 75.6 8.5 31 4.4 82.6 28.6 0.36 27.79
After 7.9 74.7 8.9 31 4.5 83.2 28.8 0.42 27.53
3 Before 8.9 75.8 8.6 31 4.5 81.8 28.3 0.42 27.64
After 8.2 73.6 9.3 41 4.5 83.0 28.6 0.48 27.48
4 Before 13.9 76.0 8.5 31 4.5 82.4 29.4 0.42 27.69
After 11.6 70.6 10.1 42 4.5 83.2 28.4 0.50 27.48
5 Before 15.4 76.0 8.5 31 4.5 82.2 28.6 0.42 27.64
After 12.9 69.3 10.6 43 4.5 82.6 28.7 0.46 27.58
z Target amount of water sprayed on treatments 2 through 5 was 4.54, 9.07, 18.14, and 22.68 kg per 226.8-kg bale,
respec-tively. Treatment 1 was the control with no water added. “Before” data is the average of 5 subsamples for moisture and 9 for HVI, and “after” data is the average of 100 subsamples.
Moisture (%)
6.1 7.9 8.2 11.6 12.9
Color grade
0 10 20 30 40 50 60 70 80
with Gram-negative bacterial populations. To explain this inconsistency, one must remember that bacterial population determinations are measurements of the viable bacteria present in the cotton. It is possible that the added water stimulated growth and broke the dormancy of many of the Gram-negative bacteria that then began to die because conditions were not suitable for sustained growth. This trend seems to be an acceleration of the normal decline in bacterial survival under conventional cotton storage (Chun and Perkins, 1996). Nevertheless, while the Gram-negative bacterial populations tended to decline, their remains were left behind intact on the cotton. Chun and Perkins (1996) showed that under long-term storage, Gram-negative bacterial populations declined during storage, but endotoxin, which is a component of the cell wall of Gram-negative bacteria and an indicator of the pres-ence of Gram-negative bacteria, remained constant. A likely occurrence here is that more Gram-negative bacteria were stimulated in the short-term with the increased added moisture and because conditions were not suitable for sustained growth, the die-off was greater with added moisture.
The fungal populations showed a tendency to increase with added moisture (Table 5). This could account for the increased grayness as the amount of added water was increased, as evidenced by the darkened areas of fungal growth on the bale surface (Figure 1). Thus the added moisture may potentially lower the color grade of the cotton. In addition, this condition may also be a serious health concern be-cause the increased presence of fungal components may greatly aggravate the allergic response of sus-ceptible workers, which would be an unnecessary health risk. This supports earlier work by Bargeron et al. (1986) that demonstrated bales containing the most moisture produced dust with the greatest mi-crobiological activities.
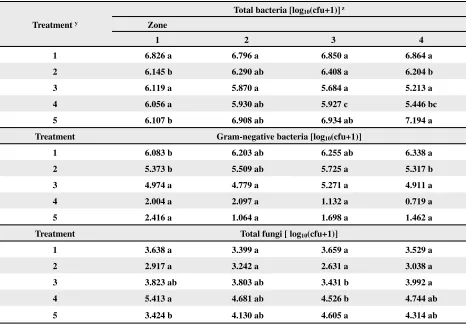
When the dispersal of the various microbial populations was examined (Table 6), the localization of the microbial populations showed greater variabil-ity through the zones when water was added, except for the Gram-negative bacteria, which probably was exhibiting greater die-off with added moisture resulting in a reduction in the number of surviving species and hence the lower variation. In general, the distribution of the microbial populations and mois-ture content are not the same throughout a bale and appears to be more variable with increasing amounts of moisture added before storage (Table 6; Figures 2 & 3; Anthony, 2003). The greater variability in the zones with added moisture will probably add to the inherent variability of cotton and this increased spottiness in a bale could possibly make lay downs more difficult at the mill.
In conclusion, the overspray addition of water after ginning increases bale weight, but at the risk of increasing yellowness and grayness, which low-ers the color grade. The greater fungal mass on the water-treated bales adds an unnecessary potential health risk to the workers who will be handling the cotton in the mills. While adding water does inflate the bale weight, the added weight might be offset by penalties or a lower classification of the cotton due to increased yellowness and grayness. The change in color grade occurs after official classification, so it may or may not occur before mill consump-tion depending upon the length of storage. Studies showing little or no effect by added moisture on fiber quality exist in the literature (Backe, 2003; Chun et. al., 2003; Griffin and Harrell, 1957), as do literature indicating damage to fiber quality (Anthony, 2002a; Anthony 2002b; Bargeron et al., 1986; Chun and Anthony, 2002). But if the users of cotton become adversely affected by excess moisture without being compensated by shorter conditioning times to get a
Table 5. Overall average microbial population in treated bales
Treatment y Final average moisture
(%) Total bacteria [log10(cfu+1)]
Gram-negative bacteria [log10(cfu+1)]
Total fungi [log10(cfu+1)]
1 6.1 6.834a z 6.220a 3.556c
2 7.9 6.262b 5.481b 2.957d
3 8.2 5.900c 4.984b 3.762c
4 11.6 5.661c 1.488c 4.844a
5 12.9 6.786a 1.660c 4.118b
y Target moisture levels for treatments 2 through 5 were 4.54, 9.07, 18,14, and 22.68, respectively. Treatment 1 was the
control with no water added.
z Means within a column followed by the same letter are not significantly different according to Duncan’s multiple range
higher moisture content that would lead to improved processing (McAlister, 1997), the reputation of the gins and producers of such practices may suffer and indirectly tarnish the reputation of the entire cotton industry. Further studies using different bagging and levels of added moisture are underway to address the question of optimal moisture levels and will be reported later.
DISCLAIMER
Mention of a trademark, warranty, proprietary product or vendor does not constitute a guarantee by the U.S. Department of Agriculture and does not imply approval or recommendations of the product to the exclusion of others that may also be suitable.
REFERENCES
Anthony, W.S. 2002a. Impact of moisture added at lint slide on cotton color. Cotton Gin and Oil Mill Press 103(6):8-12 Anthony, W.S. 2002b. Effects on fiber quality of adding
mois-ture at the gin lint slide. p. 1-21. In Proc. Fifteenth An-nual Engineered Fiber Selection Conference, Memphis, TN 10-12 June 2002. Cotton Incorporated, Cary, NC. Available online at http://www.cottoninc.com/efsnew/ 2002Conf_SAnthony.pdf (verified 24 May 2002). Anthony, W.S. 2003. Survey of moisture restoration at
mid-south gins in 2002. Cotton Gin and Oil Mill Press 104 (7):10-12.
Anthony, W.S., D.W. Van Doorn, and D. Herber. 1994. Packaging lint cotton. p. 119-142. In Cotton Ginners Handbook. USDA Handb. 503. U.S. Gov. Print. Office, Washington, D.C.
Table 6. Average microbial population in each zone of the treated bale
Treatment y
Total bacteria [log10(cfu+1)] z
Zone
1 2 3 4
1 6.826 a 6.796 a 6.850 a 6.864 a
2 6.145 b 6.290 ab 6.408 a 6.204 b
3 6.119 a 5.870 a 5.684 a 5.213 a
4 6.056 a 5.930 ab 5.927 c 5.446 bc
5 6.107 b 6.908 ab 6.934 ab 7.194 a
Treatment Gram-negative bacteria [log10(cfu+1)]
1 6.083 b 6.203 ab 6.255 ab 6.338 a
2 5.373 b 5.509 ab 5.725 a 5.317 b
3 4.974 a 4.779 a 5.271 a 4.911 a
4 2.004 a 2.097 a 1.132 a 0.719 a
5 2.416 a 1.064 a 1.698 a 1.462 a
Treatment Total fungi [ log10(cfu+1)]
1 3.638 a 3.399 a 3.659 a 3.529 a
2 2.917 a 3.242 a 2.631 a 3.038 a
3 3.823 ab 3.803 ab 3.431 b 3.992 a
4 5.413 a 4.681 ab 4.526 b 4.744 ab
5 3.424 b 4.130 ab 4.605 a 4.314 ab
y Target amount of water sprayed on treatments 2 through 5 was 4.54, 9.07, 18.14, and 22.68 kg per 226.8-kg bale,
respec-tively. Treatment 1 was the control with no water added.
z Means within a row followed by the same letter are not significantly different according to Duncan’s multiple range test
American Society for Testing and Materials (ASTM). 1971. Standard method of test for moisture in cotton by oven-drying (D 2495). p. 419-426. In Annual Book of ASTM Standards. ASTM, West Conshohocken, PA.
Backe, E.E. 2003. The effect of moisture restoration at gin-ning on HVI and AFIS fiber properties. p. 738-741. In Proc. Beltwide Cotton Conf., Nashville, TN, 6-10 Jan., 2003. Natl. Cotton Counc. Am, Memphis, TN. Bargeron, J.D., H.H. Perkins, Jr., and M. Kinoshita. 1986.
Bactericide and moisture affect cotton dust microbiologi-cal activity. p. 63-64. In Proc. Beltwide Cotton Prod. Res. Conf., Las Vegas, NV, 8-9 Jan. 1986. Natl. Cotton Counc. Am, Memphis, TN.
Brushwood, D.E. and D.T.W. Chun. 1998. Carbohydrate, strength, and colour changes on high-moisture treated honeydew contaminated cottons. Can. Textile J. 115(5):40-43.
Chun, D.T.W. and W.S. Anthony. 2002. Biological degrada-tion of cotton bales due to excess moisture. In Proc. Beltwide Cotton Conf., Atlanta, GA, 8-12 Jan. 2002. Natl Cotton Counc. Am., Memphis, TN.
Chun, D.T, and D. Brushwood. 1998. High moisture storage effects on cotton stickiness. Textile Res. J. 68(9):642-648.
Chun, D.T.W., D.D. McAlister and D. Cobb. 2003. Microbial activity of stored cotton bales that had been baled at dif-ferent moisture levels. p. 1982-1985. In Proc. Beltwide Cotton Conf., Nashville, TN. 6-10 Jan. 2003. Natl. Cot-ton Counc. Am., Memphis, TN.
Chun, D. and R.E. McDonald. 1987. Seasonal trends in the population dynamics of fungi, yeasts, and bacteria on fruit surface of grapefruit in Florida. Proc. Fla. State Hort. Soc. 100:23-25.
Chun, D.T.W. and H.H. Perkins, Jr. 1996. Effects of conven-tional cotton storage on dust generation potential, bacte-rial survival, and endotoxin content of lint and dust. Ann. Agric. Environ. Med. 3:19-25.
Fischer, J.J., P.R. Morey, and P.E. Sasser. 1980. Gram-nega-tive bacterial content and fiber properties of raw cotton. Textile Res. J. 50(12):735-739
Fleming, N. and A.C. Thaysen. 1921. XLVI. On the deteriora-tion of cotton on wet storage. Biochem. J. 15:407-414 Griffin, Jr., A.C. and E.A. Harrell. 1957. Effects of moisture
added lint slide on lint quality and bale weight in humid cotton-growing areas. USDA Production Res. Rep. 14. U.S. Gov. Print. Office, Washington, D.C.
Hall, L.T. and J.P. Elting. 1951. Cavitomic cotton, a progress report. Textile Res. J. 21(08) 580-590.
Mangialardi, Jr., G.J. and A.C. Griffin. 1977. Restoring mois-ture to cotton at midsouth gins. USDA Tech. Bull. 1553. U.S. Gov. Print. Office, Washington, DC.
McAlister, D.D. 1997. The impact of moisture on cotton fiber quality and processing. p. 147-159. In Proc. Tenth Annual Engineered Fiber Selection System Research Fo-rum, 6-7 Nov. 1997, Raleigh, NC. Cotton Incorporated, Raleigh, NC
Nickerson, D. 1964. Pattern of color change emerges from 3-year storage study of cotton grades. Textile Res. J. 34(7):645-647.