Comparison of physical activity and
body composition in a cohort of
children born extremely preterm or with
extremely low birth weight to matched
term-born controls: a follow-up study
Mette Engan, 1,2 Maria Vollsæter,1,2 Knut Øymar,2,3 Trond Markestad,1,2
Geir Egil Eide,4,5 Thomas Halvorsen,1,2 Petur Juliusson,1,2 Hege Clemm1,2
To cite: Engan M, Vollsæter M,
Øymar K, et al. Comparison of physical activity and body composition in a cohort of children born extremely preterm or with extremely low birth weight to matched term-born controls: a follow-up study. BMJ Paediatrics Open 2019;3:e000481. doi:10.1136/ bmjpo-2019-000481
►Additional material is published online only. To view please visit the journal online (http:// dx. doi. org/ 10. 1136/ bmjpo- 2019- 000481).
Received 8 March 2019 Revised 8 May 2019 Accepted 28 May 2019
For numbered affiliations see end of article.
Correspondence to Dr Mette Engan; metteengan@ hotmail. com
© Author(s) (or their employer(s)) 2019. Re-use permitted under CC BY-NC. No commercial re-use. See rights and permissions. Published by BMJ.
AbstrACt
Objectives To compare physical activity and body composition in a cohort of children born extremely preterm/extremely low birth weight (EP/ELBW) with term-born (TB) controls.
Methods A regional cohort of children born during 1999–2000 at gestational age <28 weeks or with birth weight <1000 g and their individually matched TB controls were examined in 2010–2011. Information on physical activity was obtained from parental questionnaires, and body composition was determined by anthropometry and dual X-ray absorptiometry.
results Fifty-seven EP/ELBW and 57 TB controls were included at a mean age of 11.6 years. Compared with the TB children, the EP/ELBW-born children exercised less often (22% vs 44% exercised more than 3 days per week), had lower physical endurance and poorer proficiency in sports and play and were less vigorous during exercise (p<0.05). They also had lower values (mean; 95 % CI) for muscle mass (0.9; 0.3–1.5 kg), total bone mineral density z-score (0.30; 0.13–0.52 units) and fat mass ratio (0.14; 0.06–0.21 units). The association between physical activity and bone mineral and skeletal muscle mass accrual was significantly weaker for the EP/ELBW-born than the TB children.
Conclusions The EP/ELBW-born children were less physically active, had signs of an unfavourable body composition with less muscle mass and lower bone mineral density than the TB controls. The association between physical activity and the measures of body composition was weaker in the group of EP/ELBW-born children.
IntrOduCtIOn
Children born extremely preterm (EP; ie, before 28 weeks’ gestation) or with extremely low birth weight (ELBW; ie, <1000 g) are considered to be at increased risk of cardi-ovascular disease and osteoporosis.1 The reasons may be complex and probably include prenatal conditions like placental insuffi-ciency and later exposures like infections,
immobilisation and suboptimal nutrition.2 Most of the skeletal muscle mass3 and 80% of skeletal mineralization is normally acquired during the last trimester.4 EP/ELBW-born individuals are deprived of these valuable intrauterine weeks, and they are usually shorter and lighter with lower lean body mass (LBM), lower bone mass and a higher percentage of total body fat (%BF) at term equivalent age than infants born at term.5–7 It is uncertain to what extent these differences track into later life and how nutrition and physical activity (PA) modify the anthropom-etry and body composition in children born EP/ELBW.8 9 However, suboptimal bone and muscle mass may persist and lead to compro-mised skeletal and muscle health.10–12
PA is associated with numerous health bene-fits including reduced risk of cardiovascular disease and osteoporosis through improved insulin sensitivity, reduced blood pressure, enhanced endothelial function and increased bone mineralisation.13 14 There is inconsis-tent evidence on whether children and young adults born EP/ELBW differ from children born at term regarding PA.15–18 Moreover, we do not know if PA has the same beneficial effects in individuals born EP/ELBW as in those born at term. Therefore, the purpose of this study was to compare exercise habits and body composition in schoolchildren born EP/ELBW with term-born children and to assess the association between PA and body composition in the two groups.
MethOds Participants
This follow-up cohort study in a high-in-come country included 57 children born EP
on September 12, 2020 by guest. Protected by copyright.
(gestational age (GA) <28 weeks) or with ELBW (<1000 g) in the Western Norway Regional Health Authority during 1999–2000 participating in the Project Extreme Prematurity, which is a part of the WestPaed Research Group. The EP/ELBW children were included at birth and later examined at 2 and 5 years of age before this study was performed in 2010–2011. Neonatal care had been provided at one of two regional neonatal inten-sive care units. Medical data were obtained from clinical examinations and hospital records. Using information from birth protocols at the maternity wards, the next born individuals of the same sex, born at term (TB, GA >37 weeks) with a birth weight (BW) above the lower 10th percentile of Norwegian children (>3.0 kg)19 at the same maternity ward as the participating EP/ELBW-born index case were invited as controls in 2010. If the parent of the first invited term-born individual declined participation, the next was invited and so on until one TB control was recruited for each participating preterm born index child. One average 1.6 controls had to be invited to recruit a full 1:1 TB control group.
PA questionnaires
Exercise habits were reported on questionnaires by the
parents. A validated question from the WHO Health
Behaviour in Schoolchildren Survey was used to determine the frequency of leisure time PA: apart from at school, how often do you usually exercise so much that you get out of breath or sweat?20
Anthropometry
Height, weight, subscapular and triceps skinfolds and waist circumference were measured. Subscapular to triceps skinfold ratio (STR) and waist-to-height ratio (WHtR) were calculated as estimates of truncal fat mass (FM). Z-scores for BW and anthropometric measures were calculated with reference to Norwegian growth curves.19 21 22 Small for gestational age (SGA) was defined as a BW <10th percentile for GA.19
dual-energy X-ray absorptiometry (dXA)
DXA is a validated method to determine body composi-tion.23 The participants were examined at two different centres of rheumatology on a Lunar Prodigy and Lunar Prodigy Advanced DXA scan (GE Medical systems Lunar, Madison Wsconsin, USA). Daily calibration with a local phantom provided by the manufacturer was performed at the two DXA centres, and the preterm and their matched TB controls were examined at the same centre according to geographic affiliation.
Whole-body less head and regional body composition were measured, and bone mineral density (BMD) z-scores were calculated using sex and age specific paediatric reference standards provided by Lunar Prodigy enCORE2009 soft-ware version 13.20.033.23
Data on bone mineral content (BMC) (total BMD, lumbar spine BMD (lumbar vertebra 1–4) and left and right total hip BMD (BMDth)), fat compartments (total
FM, %BF, FM ratio ((arms+legs FM)/truncal FM) and fat mass index (FMI: FM normalised for height2)) and skel-etal muscle mass (LBM, appendicular lean mass (ALM),
ALM index (ALMI: ALM/height2) and LBM index
(LBMI: LBM/height2) were collected.
blood samples
Blood for analyses of vitamin D (25-hydroxy vitamin D), oestradiol, testosterone, luteinising hormone and folli-cle-stimulating hormone was drawn at the consultation.
Puberty
The questionnaire contained a five-level question on puberty development, where parents were asked to compare their offspring to peers (delayed, somewhat delayed, similar, somewhat ahead or ahead of peers).
statistics
Data are presented as means with SD or medians with ranges, as appropriate, or as mean group differences with 95% CIs based on the t-distribution with the appropriate df. To compare findings between the EP/ELBW and TB groups, a mixed linear model and Wilcoxon’s signed-rank test were used. Independent sample t-tests were used to compare the SGA and the non-SGA preterm individuals. Leisure time exercise were adjusted for socioeconomic status defined by the maternal education (high educa-tion defined by minimum 3 years of college or university degree) and single parenthood. A mixed linear regres-sion model adjusted the estimate of the body components for body size (height z-score and weight z-score), parental reported puberty and PA (days per week with exercise). Vitamin D level did not change the effect of EP/ELBW birth and was not included in the model. An interaction term was constructed to test differences between the EP/ ELBW and TB groups regarding association between PA and body composition. P values have not been formally adjusted for multiple comparisons due to the complexity of the analyses and should be interpreted with caution. Accordingly, as a rule of thumb, we consider only p values <0.01 as statistically significant in the interpretation of the results. Analyses were performed using IBM SPSS statistics V.14.
ethics
The mothers gave written informed consent.
Patient and public involvement
Patient representatives were involved in the study design of this and several other studies as part of the national follow-up study on EP/ELBW children.
results Participants
Of 108 premature EP/ELBW children, 19 had died and 57 (29 males) consented to participate in the follow-up study. The participants needed more ventilator treat-ment but did not differ from those who declined on
on September 12, 2020 by guest. Protected by copyright.
Table 1 Characteristics of the 89 surviving EP/ELBW-born children and the 57 term-born children in the regional cohort of Western Norway health region in 1999–2000
Characteristics
EP/ELBW born
P value* Term born P value†
Assessed Not assessed
Participants, n 57 32 57
Female gender, n (%) 28 (49) 12 (38) 0.29 26 (46)
Birth weight (g), mean (SD) 842 (175) 837 (142) 0.74 3700 (434) Gestational age (weeks), median (range) 27 (24–31) 27 (23-30) 0.68 Small for gestational age, 0.10 percentile, n (%) 20 (35) 6 (19) 0.11
Ventilator treatment, n (%) 51 (89) 21 (66) 0.01
Days on ventilator, median (range) 5 (0–24) 2.5 (0–29) 0.01
Bronchopulmonary dysplasia, n (%) 31 (54) 12 (38) 0.13
Periventricular leucomalacia, n (%) 4 (7) 3 (9) 0.70
Necrotising enterocolitis, n (%) 1 (2) 1 (3) 0.59
Gastrostomy tube, n (%) 0 (0) 1 (3) 0.36
Cerebral palsy at 5 years, n (%) 3 (5) 5 (16) 0.13
Eating difficulties any time, n (%) 16 (28) 7 (22) 0.52
Growth hormone treatment, n (%) 2 (4) 0 (0) 0.53
Assessment at 11 years of age
Reduced mobility, n (%) 2 (4) 0 (0) 0.16
Single parenthood, n (%) 13 (23) 6 (10) 0.052
Mother higher education‡, n (%) 31 (54) 35 (61) 0.85
Hearing impairment, n (%) 6 (11) 2 (4) 0.16
Visual impairment, n (%) 11 (19) 5 (9) 0.06
Inhaled corticosteroids, n (%) 3 (5) 3 (5) 0.66
The enrolled subjects were examined in 2010–2011.
*P value for differences between the participating extremely preterm/extremely low birth weight (EP/ELBW)-born children and the EP/ELBW-born children not participating. Independent sample t-test, Mann-Whitney test and χ2 exact test as appropriate.
†P value for differences between the participation EP/ELBW-born and the TB control group. Wilcoxon signed-ranks test. ‡High education defined by minimum 3 years of college or university degree.
EP/ELBW, Extremely preterm/extremely low birth weight; TB, term born.
other characteristics (table 1). Seven of the EP/ELBW-born children declined DXA scanning, and three were excluded from the DXA analyses because they were of minority ethnicity. One of the included participants who underwent DXA scanning had mild cerebral palsy (CP) affecting one leg. One subject who was not scanned was excluded from analyses on PA because of deafness and hemiplegic CP. Among the TB controls, 57 (31 males) completed the questionnaires, 54 showed up for exam-inations and 49 underwent DXA scanning. Mean age (SD) at examination was 11.6 (0.7) years for both groups.
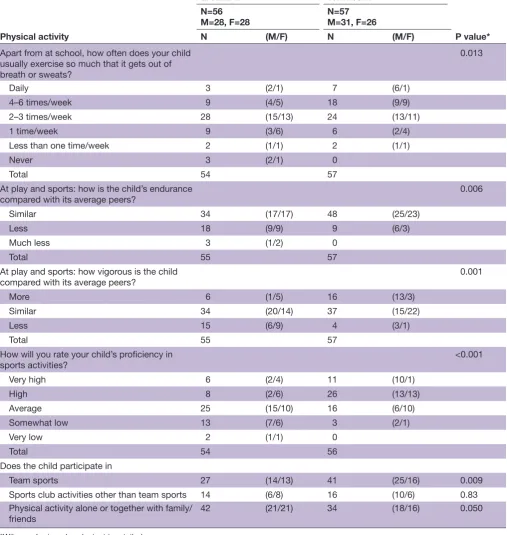
exercise and participation in sports activities
Twenty-two per cent of the EP/ELBW-born and 44% of the TB children exercised more than 3 days/week, and the overall mean (95% CI) difference was 0.9 (0.2 to 1.6) days/week adjusted for socioeconomic status, p=0.009 There was no statistically significant gender difference.
More EP/ELBW-born than TB participants were reported to have lower physical endurance, poorer
proficiency in sports and play and to be less vigorous during exercise, when compared with their peers (table 2).
Nearly 50% of the EP/ELBW and 72% of the TB participated in team sports. The difference was mainly explained by the EP/ELBW boys not participating at the same level as TB boys (52% vs 81%, p=0.005). The EP/ ELBW-born children participated in PA together with family or friends more often than the TB children (75% vs 60%, p=0.050).
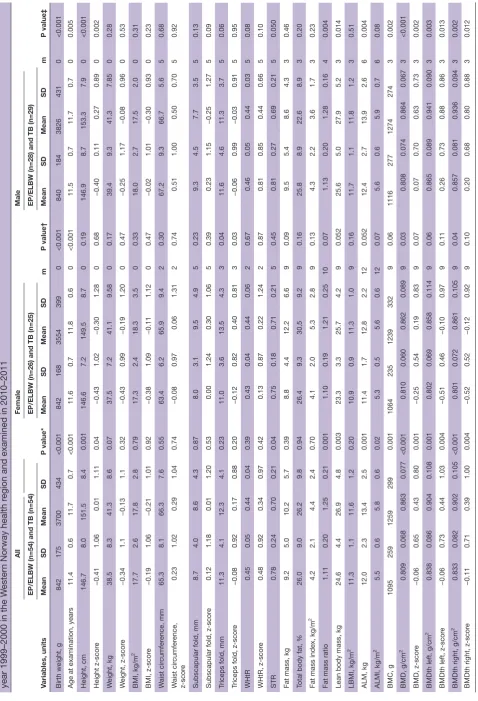
body composition
The mean (95% CI) height was 4.6 (2.0 to 7.2) cm and the weight was 2.8 (0.3 to 5.8) kg lower in the EP/ELBW than the TB children. The z-score for height were lower in the EP/ELBW group but not statistically significant (p=0.04). The mean z-score for weight, BMI, waist circumference, subscapular skinfold, triceps skinfold and the z-scores for these measures did not differ significantly (table 3). The FM and %BF were similar, but the STR was 11% higher
on September 12, 2020 by guest. Protected by copyright.
Table 2 Comparing reported physical activity and participation in sports between the 56 EP/ELBW-born subjects and the 57 term-born age-matched and gender-matched controls in the Western Norway Health Region in 1999–2000 as part of the Project Extreme Prematurity
Physical activity
EP/ELBW Term born
P value* N=56
M=28, F=28 N=57M=31, F=26
N (M/F) N (M/F)
Apart from at school, how often does your child usually exercise so much that it gets out of breath or sweats?
0.013
Daily 3 (2/1) 7 (6/1)
4–6 times/week 9 (4/5) 18 (9/9)
2–3 times/week 28 (15/13) 24 (13/11)
1 time/week 9 (3/6) 6 (2/4)
Less than one time/week 2 (1/1) 2 (1/1)
Never 3 (2/1) 0
Total 54 57
At play and sports: how is the child’s endurance
compared with its average peers? 0.006
Similar 34 (17/17) 48 (25/23)
Less 18 (9/9) 9 (6/3)
Much less 3 (1/2) 0
Total 55 57
At play and sports: how vigorous is the child compared with its average peers?
0.001
More 6 (1/5) 16 (13/3)
Similar 34 (20/14) 37 (15/22)
Less 15 (6/9) 4 (3/1)
Total 55 57
How will you rate your child’s proficiency in
sports activities? <0.001
Very high 6 (2/4) 11 (10/1)
High 8 (2/6) 26 (13/13)
Average 25 (15/10) 16 (6/10)
Somewhat low 13 (7/6) 3 (2/1)
Very low 2 (1/1) 0
Total 54 56
Does the child participate in
Team sports 27 (14/13) 41 (25/16) 0.009
Sports club activities other than team sports 14 (6/8) 16 (10/6) 0.83 Physical activity alone or together with family/
friends 42 (21/21) 34 (18/16) 0.050
*Wilcoxon’s signed-ranks test two tailed.
EP/ELBW, extremely preterm/extremely low birth weight; F, female; m, male.
(p=0.04) and the FM ratio was 11% lower (p=0.001) in the EP/ELBW than the TB children. After adjusting for size and reported puberty, the mean (95% CI) difference in STR was 0.09 (0.01 to 0.17) units (p=0.04), and the mean difference in FM ratio was 0.14 (0.06 to 0.21) units (p=0.001).
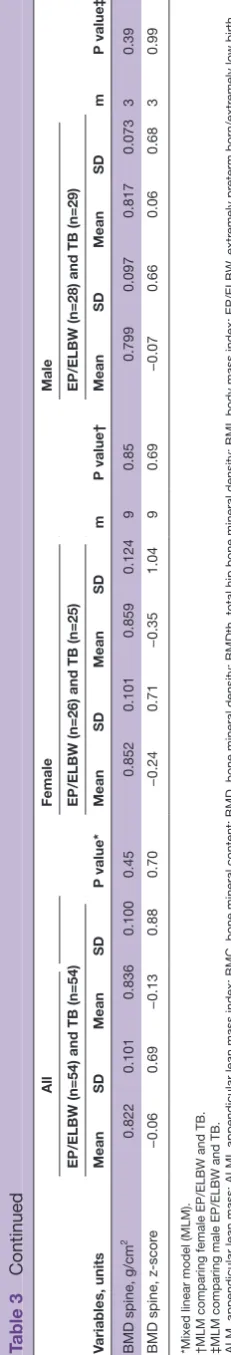
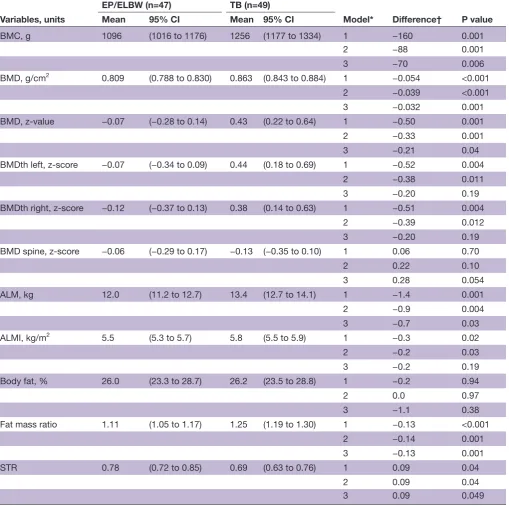
The EP/ELBW-born children had lower LBM, ALM, total BMD z-score and BMDth z-scores. The mean (95% CI) difference in ALM was 0.9 (0.3 to 1.5) kg (p=0.004), and the difference in total BMD z-score was 0.33 (0.13 to 0.52) units (p=0.001) after adjusting for size and
puberty (table 4). The EP/ELBW children had close
on September 12, 2020 by guest. Protected by copyright.
Table 3
Comparing anthr
opometry and body composition between the 54 EP/ELBW childr
en and their 54 age-matched and gender
-matched term-bor
n contr
ols bor
n
year 1999–2000 in the W
ester
n Norway health r
egion and examined in 2010–2011
Variables, units All P value* Female m P value† Male m P value‡
EP/ELBW (n=54) and TB (n=54)
EP/ELBW (n=26) and TB (n=25)
EP/ELBW (n=28) and TB (n=29)
Mean SD Mean SD Mean SD Mean SD Mean SD Mean SD
Birth weight, g
842 175 3700 434 <0.001 842 168 3554 399 0 <0.001 840 184 3826 431 0 <0.001
Age at examination, years
11.4 0.6 11.7 0.7 <0.001 11.6 0.7 11.8 0.6 0 <0.001 11.5 0.7 11.7 0.7 0 0.005 Height, cm 146.7 8.0 151.5 8.4 0.001 146.6 7.2 149.5 8.7 0 0.19 146.9 8.7 153.3 7.9 0 <0.001 Height z-scor e −0.41 1.06 0.01 1.11 0.04 −0.43 1.02 −0.30 1.28 0 0.68 −0.40 0.11 0.27 0.89 0 0.002 W eight, kg 38.5 8.3 41.3 8.6 0.07 37.5 7.2 41.1 9.58 0 0.17 39.4 9.3 41.3 7.85 0 0.28 W eight, z-scor e −0.34 1.1 −0.13 1.1 0.32 −0.43 0.99 −0.19 1.20 0 0.47 −0.25 1.17 −0.08 0.96 0 0.53 BMI, kg/m 2 17.7 2.6 17.8 2.8 0.79 17.3 2.4 18.3 3.5 0 0.33 18.0 2.7 17.5 2.0 0 0.31 BMI, z-scor e −0.19 1.06 −0.21 1.01 0.92 −0.38 1.09 −0.11 1.12 0 0.47 −0.02 1.01 −0.30 0.93 0 0.23 W aist cir cumfer ence, mm 65.3 8.1 66.3 7.6 0.55 63.4 6.2 65.9 9.4 2 0.30 67.2 9.3 66.7 5.6 5 0.68 W aist cir cumfer ence, z-scor e 0.23 1.02 0.29 1.04 0.74 −0.08 0.97 0.06 1.31 2 0.74 0.51 1.00 0.50 0.70 5 0.92
Subscapular fold, mm
8.7 4.0 8.6 4.3 0.87 8.0 3.1 9.5 4.9 5 0.23 9.3 4.5 7.7 3.5 5 0.13
Subscapular fold, z-scor
e 0.12 1.18 0.01 1.20 0.53 0.00 1.24 0.30 1.06 5 0.39 0.23 1.15 −0.25 1.27 5 0.09
Triceps fold, mm
11.3 4.1 12.3 4.1 0.23 11.0 3.6 13.5 4.3 3 0.04 11.6 4.6 11.3 3.7 5 0.06
Triceps fold, z-scor
e −0.08 0.92 0.17 0.88 0.20 −0.12 0.82 0.40 0.81 3 0.03 −0.06 0.99 −0.03 0.91 5 0.95 WHtR 0.45 0.05 0.44 0.04 0.39 0.43 0.04 0.44 0.06 2 0.67 0.46 0.05 0.44 0.03 5 0.08 WHtR, z-scor e 0.48 0.92 0.34 0.97 0.42 0.13 0.87 0.22 1.24 2 0.87 0.81 0.85 0.44 0.66 5 0.10 STR 0.78 0.24 0.70 0.21 0.04 0.75 0.18 0.71 0.21 5 0.45 0.81 0.27 0.69 0.21 5 0.050
Fat mass, kg
9.2 5.0 10.2 5.7 0.39 8.8 4.4 12.2 6.6 9 0.09 9.5 5.4 8.6 4.3 3 0.46
Total body fat, %
26.0 9.0 26.2 9.8 0.94 26.4 9.3 30.5 9.2 9 0.16 25.8 8.9 22.6 8.9 3 0.20
Fat mass index, kg/m
2 4.2 2.1 4.4 2.4 0.70 4.1 2.0 5.3 2.8 9 0.13 4.3 2.2 3.6 1.7 3 0.23
Fat mass ratio
1.11 0.20 1.25 0.21 0.001 1.10 0.19 1.21 0.25 10 0.07 1.13 0.20 1.28 0.16 4 0.004
Lean body mass, kg
24.6 4.4 26.9 4.8 0.003 23.3 3.3 25.7 4.2 9 0.052 25.6 5.0 27.9 5.2 3 0.014 LBMI, kg/m 2 11.3 1.1 11.6 1.2 0.20 10.9 0.9 11.3 1.0 9 0.16 11.7 1.1 11.8 1.2 3 0.51 ALM, kg 12.0 2.3 13.4 2.5 0.001 11.4 1.7 12.8 2.2 12 0.052 12.4 2.7 13.9 2.6 6 0.004 ALMI, kg/m 2 5.5 0.6 5.8 0.6 0.02 5.3 0.5 5.6 0.6 12 0.07 5.6 0.6 5.9 0.7 6 0.08 BMC, g 1095 259 1259 299 0.001 1064 235 1239 332 9 0.06 1116 277 1274 274 3 0.002 BMD, g/cm 2 0.809 0.068 0.863 0.077 <0.001 0.810 0.060 0.862 0.089 9 0.03 0.808 0.074 0.864 0.067 3 <0.001 BMD, z-scor e −0.06 0.65 0.43 0.80 0.001 −0.25 0.54 0.19 0.83 9 0.07 0.07 0.70 0.63 0.73 3 0.002
BMDth left, g/cm
2 0.838 0.086 0.904 0.108 0.001 0.802 0.069 0.858 0.114 9 0.06 0.865 0.089 0.941 0.090 3 0.003
BMDth left, z-scor
e −0.06 0.73 0.44 1.03 0.004 −0.51 0.46 −0.10 0.97 9 0.11 0.26 0.73 0.88 0.86 3 0.013
BMDth right, g/cm
2 0.833 0.082 0.902 0.105 <0.001 0.801 0.072 0.861 0.105 9 0.04 0.857 0.081 0.936 0.094 3 0.002
BMDth right, z-scor
e −0.11 0.71 0.39 1.00 0.004 −0.52 0.52 −0.12 0.92 9 0.10 0.20 0.68 0.80 0.88 3 0.012 Continued
on September 12, 2020 by guest. Protected by copyright.
Variables, units
All
P value*
Female
m
P value†
Male
m
P value‡
EP/ELBW (n=54) and TB (n=54)
EP/ELBW (n=26) and TB (n=25)
EP/ELBW (n=28) and TB (n=29)
Mean
SD
Mean
SD
Mean
SD
Mean
SD
Mean
SD
Mean
SD
BMD spine, g/cm
2
0.822
0.101
0.836
0.100
0.45
0.852
0.101
0.859
0.124
9
0.85
0.799
0.097
0.817
0.073
3
0.39
BMD spine, z-scor
e
−0.06
0.69
−0.13
0.88
0.70
−0.24
0.71
−0.35
1.04
9
0.69
−0.07
0.66
0.06
0.68
3
0.99
*Mixed linear model (MLM). †MLM comparing female EP/ELBW and TB. ‡MLM comparing male EP/ELBW and TB. ALM, appendicular lean mass; ALMI, appendicular lean mass index; BMC, bone mineral content; BMD, bone mineral density; BMDth, t
otal hip bone mineral density; BMI, body mass index; EP/ELBW
, extr
emely pr
eterm bor
n/extr
emely low birth
weight; LBMI, lean body mass index; STR, subscapular
- triceps skinfold ratio; TB, term bor
n; WHtR, waist-to-height ratio; m, missing; Fat mass ratio, (arms+legs fat mass)/truncal fat mass.
Table 3
Continued
to significantly lower ALMI (p=0.02), but LBMI did not differ between the groups.
When adjusting for PA, the mean differences in ALM, BMC and BMD were reduced by 20% and the mean differences in BMD z-score by 36%. The measures for truncal fat deposit (STR and FM ratio) remained similar or were only slightly reduced (table 4).
small for gestational age
Twenty of the EP/ELBW children (13 men and 7 women) were born SGA. Their mean (95% CI) height z-score was 0.88 (0.33 to 1.43) units lower than those who were not SGA. LBM, ALM, BMC, BMD and regional BMD were close to significantly reduced in the SGA group but not when comparing the respective values normalised for height2 or z-scores (online supplementary file).
blood samples and puberty
We found no statistically significant group differences in unadjusted or seasonally adjusted D vitamin values. The values for testosterone, LH and FSH did not differ significantly between the EP/ELBW and TB boys, and the values of oestradiol, LH and FSH did not differ signif-icantly between the respective groups of girls. There were no significant differences in reported puberty between the EP/ELBW and TB stratified by gender (online supplementary file).
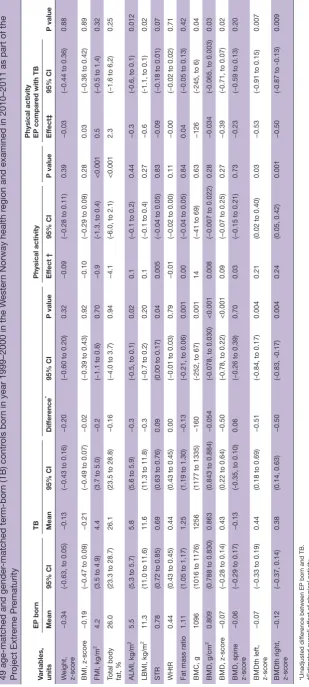
PA and body composition
Increased PA was associated with statistically significantly lower fat components (%BF and FMI) and higher BMDth z-scores in the total group of participants (table 5).
Analyses of interaction were performed to investigate if associations between PA and body composition differed in the EP/ELBW compared with the TB control group. We found there was an overall tendency for PA to have less positive effect on ALM, ALMI, total BMD z-score and BMDth z-scores in the EP/ELBW-born children compared with the TB children (table 5); however, this was statistically significant only for the BMDth z-scores.
dIsCussIOn
Our main findings were that the EP/ELBW-born chil-dren were less physically active and that the EP/ELBW-born children had an unfavourable body composition with increased truncal fat deposit, less skeletal muscle mass and lower BMD compared with the TB controls. The association between PA and body composition was weaker in the EP/ELBW than the TB group.
exercise and participation in sports activities
Our results are in line with other studies that report less
PA among ELBW-born or very low BW-born children24
or young adults.25 26 However, Welsh et al18 did not reveal differences between school-children born before 25 weeks GA and TB controls when PA was measured by accelerometers.18 Differences in methodology as well as population lifestyle factors could explain these diverging
on September 12, 2020 by guest. Protected by copyright.
Table 4 Results from mixed linear regression analyses of bone mineral density, skeletal muscle mass, fat component and fat distribution measures in 47 EP/ELBW-born children and their 49 term-born age-matched and gender-matched controls in the Western Norway health region in 1999–2000 that were examined in 2010–2011
Variables, units
EP/ELBW (n=47) TB (n=49)
Model* Difference† P value
Mean 95% CI Mean 95% CI
BMC, g 1096 (1016 to 1176) 1256 (1177 to 1334) 1 −160 0.001
2 −88 0.001
3 −70 0.006
BMD, g/cm2 0.809 (0.788 to 0.830) 0.863 (0.843 to 0.884) 1 −0.054 <0.001
2 −0.039 <0.001
3 −0.032 0.001
BMD, z-value −0.07 (−0.28 to 0.14) 0.43 (0.22 to 0.64) 1 −0.50 0.001
2 −0.33 0.001
3 −0.21 0.04
BMDth left, z-score −0.07 (−0.34 to 0.09) 0.44 (0.18 to 0.69) 1 −0.52 0.004
2 −0.38 0.011
3 −0.20 0.19
BMDth right, z-score −0.12 (−0.37 to 0.13) 0.38 (0.14 to 0.63) 1 −0.51 0.004
2 −0.39 0.012
3 −0.20 0.19
BMD spine, z-score −0.06 (−0.29 to 0.17) −0.13 (−0.35 to 0.10) 1 0.06 0.70
2 0.22 0.10
3 0.28 0.054
ALM, kg 12.0 (11.2 to 12.7) 13.4 (12.7 to 14.1) 1 −1.4 0.001
2 −0.9 0.004
3 −0.7 0.03
ALMI, kg/m2 5.5 (5.3 to 5.7) 5.8 (5.5 to 5.9) 1 −0.3 0.02
2 −0.2 0.03
3 −0.2 0.19
Body fat, % 26.0 (23.3 to 28.7) 26.2 (23.5 to 28.8) 1 −0.2 0.94
2 0.0 0.97
3 −1.1 0.38
Fat mass ratio 1.11 (1.05 to 1.17) 1.25 (1.19 to 1.30) 1 −0.13 <0.001
2 −0.14 0.001
3 −0.13 0.001
STR 0.78 (0.72 to 0.85) 0.69 (0.63 to 0.76) 1 0.09 0.04
2 0.09 0.04
3 0.09 0.049
*Comparing the EP/ELBW and TB pairs: model 1: unadjusted; model 2: adjusted for height z-score, weight z-score and parental-reported puberty; model 3: adjusted for height z-score, weight z-score, parental-reported puberty and physical activity.
†Estimate of difference between EP/ELBW-born and term-born children.
ALM, appendicular lean mass;ALMI, appendicular lean mass index; BMC, bone mineral content; BMD, bone mineral density; BMDth, total hip bone mineral density; EP/ELBW, extremely preterm/extremely low birth weight; STR, subscapular-triceps skinfold ratio; TB, term born; Fat mass ratio, (arms+legs fat mass)/truncal fat mass.
results in that potential differences in PA may become more apparent in societies where children in general are more active.
Several factors have been suggested to contribute to lower PA in preterm-born children, including reduced muscle mass, altered muscle fibre composition, reduced
lung function and reduced physical fitness.27 Other important aspects are their increased risk of shortcom-ings due to clumsiness, hyperactivity, inattention and lower physical confidence.28 Our findings imply that EP/ ELBW-born children are less inclined to attend team sports but instead prefer to perform PA alone or together
on September 12, 2020 by guest. Protected by copyright.
Table 5
Results fr
om mixed linear r
egr
ession analyses of ef
fect of leisur
e time physical activity on body composition in 47 extr
emely pr
eterm (EP) bor
n childr
en and their
49 age-matched and gender
-matched term-bor
n (TB) contr
ols bor
n in year 1999–2000 in the W
ester
n Norway health r
egion and examined in 2010–2011 as part of the
Pr
oject Extr
eme Pr
ematurity
Variables, units
EP bor
n
TB
Physical activity
Physical activity EP compar
ed with TB
P value Mean 95% CI Mean 95% CI Dif fer ence * 95% CI P value Ef fect † 95% CI P value Ef fect‡ 95% CI W eight, z-scor e −0.34
(-0.63, to 0.05)
−0.13
(−0.43 to 0.16)
−0.20
(−0.60 to 0.20)
0.32
−0.09
(−0.28 to 0.11)
0.39
−0.03
(−0.44 to 0.36)
0.88
BMI, z-scor
e
−0.19
(−0.47 to 0.09)
−0.21
(−0.49 to 0.07)
−0.02
(−0.39 to 0.43)
0.92
−0.10
(−0.29 to 0.09)
0.28
0.03
(−0.36 to 0.42)
0.89
FMI, kg/m
2
4.2
(3.5 to 4.9)
4.4
(3.7 to 5.0)
−0.2
(−1.1 to 0.8)
0.70
−0.9
(-1.3, to 0.4)
<0.001
0.5
(−0.5 to 1.4)
0.32
Total body fat, %
26.0
(23.3 to 28.7)
26.1
(23.5 to 28.8)
−0.16
(−4.0 to 3.7)
0.94
−4.1
(-6.0, to 2.1)
<0.001
2.3
(−1.6 to 6,2)
0.25
ALMI, kg/m
2
5.5
(5.3 to 5.7)
5.8
(5.6 to 5.9)
−0.3
(-0.5, to 0.1)
0.02
0.1
(−0.1 to 0.2)
0.44
−0.3
(-0.6, to 0.1)
0.012
LBMI, kg/m
2
11.3
(11.0 to 11.6)
11.6
(11.3 to 11.8)
−0.3
(−0.7 to 0.2)
0.20
0.1
(−0.1 to 0.4)
0.27
−0.6
(-1.1, to 0.1)
0.02
STR
0.78
(0.72 to 0.85)
0.69
(0.63 to 0.76)
0.09
(0.00 to 0.17)
0.04
0.005
(−0.04 to 0.05)
0.83
−0.09
(−0.18 to 0.01)
0.07
WHtR
0.44
(0.43 to 0.45)
0.44
(0.43 to 0.45)
0.00
(−0.01 to 0.03)
0.79
−0.01
(−0.02 to 0.00)
0.11
−0.00
(−0.02 to 0.02)
0.71
Fat mass ratio
1.11
(1.05 to 1.17)
1.25
(1.19 to 1.30)
−0.13
(-0.21, to 0.06)
0.001
0.00
(−0.04 to 0.05)
0.84
0.04
(−0.05 to 0.13)
0.42
BMC, g
1096
(1016 to 1176)
1256
(1177 to 1335)
−160
(-252, to 67)
0.001
14
(−41 to 69)
0.63
−126
(-245, to 6)
0.04
BMD, g/cm
2
0.809
(0.788 to 0.830)
0.863
(0.843 to 0.884)
−0.054
(-0.078, to 0.030)
<0.001
0.008
(−0.007 to 0.022)
0.28
−0.034
(-0.065, to 0.003)
0.03
BMD, z-scor
e
−0.07
(−0.28 to 0.14)
0.43
(0.22 to 0.64)
−0.50
(-0.78, to 0.22)
<0.001
0.09
(−0.07 to 0.25)
0.27
−0.39
(-0.71, to 0.07)
0.02
BMD, spine z-scor
e
−0.06
(−0.29 to 0.17)
−0.13
(-0.35, to 0.10)
0.06
(−0.26 to 0.39)
0.70
0.03
(−0.15 to 0.21)
0.73
−0.23
(−0.59 to 0.13)
0.20
BMDth left, z-scor
e
−0.07
(−0.33 to 0.19)
0.44
(0.18 to 0.69)
−0.51
(-0.84, to 0.17)
0.004
0.21
(0.02 to 0.40)
0.03
−0.53
(-0.91 to 0.15)
0.007
BMDth right, z-scor
e −0.12 (−0.37, 0.14) 0.38 (0.14, 0.63) −0.50 (-0.83, -0.17) 0.004 0.24 (0.05, 0.42) 0.001 −0.50
(-0.87 to -0.13)
0.009
*Unadjusted dif
fer
ence between EP bor
n and TB.
†Estimated overall ef
fect of physical activity
.
‡Estimated dif
fer
ence in ef
fect of P
A on EP bor
n compar
ed with TB (interaction term). Boldface denotes significant gr
oup dif
fer
ences.
ALMI, appendicular lean mass index; BMC, bone mineral content; BMD, bone mineral density; BMDth, total hip bone mineral density
; LBMI, lean body mass index; P
A, physical activity; STR, subscapular
-triceps skinfold ratio; WHtR,
waist-to-height ratio; Fat mass ratio, (arms+legs fat mass)/truncal fat mass.
on September 12, 2020 by guest. Protected by copyright.
with family members. This could reflect the neuromus-cular and social interaction difficulties these children may experience.
Habits of PA track from childhood into adulthood,29 and therefore, our results suggest that the long-term health of EP/ELBW-born children may be negatively affected.
body composition
Preterm-born children have been reported to have increased truncal fat deposit and insulin resistance, established risk factors for developing type 2 diabetes mellitus.30 31 Our study supports these observations since the EP/ELBW-born children had a lower FM ratio and a close to significantly higher STR, indicating greater truncal fat deposits.
There is a positive association between BW and muscle strength, which is maintained during life.32 Skeletal muscle mass, fat-free mass and muscle strength have been found to be reduced in children and adults born preterm compared with those born at term.26 27 33 This is in line with our results, where the EP/ELBW-born children had approximately 1 kg less skeletal muscle mass than the TB children.
In addition to providing strength and mobility, skeletal muscle is insulin sensitive and an important regulator of glucose metabolism and therefore relevant in preventing cardiovascular and metabolic disease.34 We suggest that the EP/ELBW-born children’s lower muscle mass may negatively affect long-term health outcome by reducing their engagement and abilities in PA and by contributing to an ineffective metabolism.
There is an association between low BW and low peak bone mass later in life.11 35 36 In our study, the mean total BMD z-score and BMDth z-scores in the EP/ELBW-group were within normal ranges but nevertheless lower than in the TB group. As reduced peak BMD is regarded the most important determinant of osteoporosis and frac-tures in later adulthood,37 the EP/ELBW-born children may be at increased risk.
Mean BMD z-score in the TB group was greater than expected, especially among the men. The reason may be that the TB controls were more active than the chil-dren in the reference material38 or that there are secular trends towards greater BMD values in Norwegian boys.
Measures of body composition are influenced by the size of the body. BMD is correlated with weight, height and puberty, and these measures were adjusted for by height and weight z-score in addition to parental reported puberty. However, DXA-derived BMD is based on the two-dimensional projected area of a three-dimen-sional structure, and it is possible that smaller bones was found to have lower BMD than larger bones. The skeletal muscle mass (ALM and LBM)) and FM were normalised for height squared, and we additionally adjusted ALMI for height and weight z-score to take into account the height and weight difference between the individuals at the given age (table 4, model 2). FM ratio and STR
are less influenced by height and weight as reflected in table 4.
PA and body composition
PA is associated with numerous health benefits on a range of non-communicable diseases.13 14 However, EP/ ELBW-born children’s benefits from exercise are not well studied.
The associations between PA and bone mineral and skeletal muscle mass accrual were weaker in the EP/ ELBW than in the TB group. The less enduring and less vigorous physical engagement in PA among the EP/ ELBW-born children may be one explanation, but it may also imply that EP/ELBW-born children benefit less from exercise compared with TB.
Nevertheless, the EP/ELBW-born children should be encouraged to be more physically active to achieve their potential peak bone and muscle mass.
The impact of the perinatal stress the preterm born individuals are exposed to is far from fully understood. One may hypothesise that early epigenetic adaptation and metabolic programming can explain later develop-ment of an unfavourable body composition.39 Future studies should try to establish optimal growth patterns for preterm children to facilitate better and individu-alised nutritional treatment. Furthermore, studies are needed to assess to what extent the frequency, volume and intensity of PA might improve body composition of the preterm born children.
strengths and limitations
The major strength of this study was the population-based and controlled design with a relatively high rate of attendance and that the participants were representative of the complete cohort. Recruitment of TB controls was based on the ‘next-born subject principle’, minimising the risk of selection bias. Potential bias introduced by a two-centre design was limited by paired statistical anal-ysis with EP/ELBW and TB controls who were recruited and examined at the same institution. Moreover, poten-tial inaccuracies introduced by collecting data on exer-cise habits and pubertal staging by suboptimal methods are likely to pertain similarly to the EP/ELBW and TB groups, thus allowing for group comparisons.
The EP/ELBW children were recruited based on either GA below <28 weeks or BW less than 1000 g irrespectively of GA. Therefore, the results cannot be generalised to EP-born individuals in general.
The exercise habits were determined by questionnaires rather than more objective methods like accelerometers and diaries, which represent a limitation to the study. Especially, we assume the report on unstructured exer-cise activity to be inaccurate. The association between PA and body composition must therefore be interpreted with caution.
Pubertal stage was not assessed by clinical examination, but rather with parental report, and the dietary intake for calcium and vitamin D was not recorded, factors that can
on September 12, 2020 by guest. Protected by copyright.
influence the interpretation of BMD. However, a recent meta-analysis concluded that preterm born children enter puberty at the same age as term born children.40 In addition, our paired analysis on the question regarding puberty did not find differences between the groups.
The p value has not been formally adjusted for multiple comparison and subsequent studies should be performed to confirm our observed associations.
COnClusIOns
Compared with TB controls, the EP/ELBW-born school children were less physically active, and our study suggests that they had an unfavourable body composi-tion with increased truncal fat, less skeletal muscle mass and reduced BMD. Physical activity was less associated with mineral and skeletal muscle mass accrual in the EP/ ELBW-born group.
What is known about the subject?
► Physical activity is associated with several health benefits and has
preventive effects on several non-communicable diseases like os-teoporosis and cardiometabolic disease.
► There is a positive association between birth weight and muscle
strength and peak bone mass, which is maintained across the life course.
► We lack knowledge on how physical activity impacts body
compo-nents in children born extremely preterm or at extremely low birth weight.
What this study adds?
► The children born extremely preterm or with extremely low birth
weight (EP/ELBW) were less physically active than term born children.
► The children born EP/ELBW had an unfavourable body
composi-tion with less muscle mass, reduced bone mineral density and in-creased truncal fat.
► Physical activity was less associated with mineral and skeletal
muscle mass accrual in the EP/ELBW-born group compared with term-born controls.
Author affiliations
1Department of Paediatrics and Adolescent Medicine, Haukeland University
Hospital, Bergen, Norway
2Department of Clinical Science, University of Bergen, Bergen, , Norway
3Department of Paediatrics and Adolescent Medicine, Stavanger University Hospital,
Stavanger, Norway
4Department of Global Public Health and Primary Care, University of Bergen,
Bergen, , Norway
5Centre for Clinical Research, Haukeland Universitetssjukehus, Bergen, Norway
Contributors ME conceptualised and designed the study, carried out the initial
analyses, drafted the initial manuscript and revised the manuscript. HC designed the data collection instruments, conceptualised and designed the study, carried out the initial analyses, drafted the initial manuscript and revised the manuscript. PJ and GEE supervised and carried out the advanced analysis and interpretation of data and critically reviewed the manuscript for important intellectual content. MV, TM and KØ designed the data collection instruments, collected data and reviewed and revised the manuscript. TH designed the data collection instruments, coordinated and supervised data collection and critically reviewed the manuscript
for important intellectual content. All authors approved the final manuscript as submitted and agree to be accountable for all aspects of the work.
Funding This study was supported by the Western Norway Regional Health
Authority and the Norway's Research Council.
Competing interests None declared.
Patient consent for publication Not required.
Provenance and peer review Not commissioned; externally peer reviewed.
data availability statement Data are available on reasonable request.
Open access This is an open access article distributed in accordance with the
Creative Commons Attribution Non Commercial (CC BY-NC 4.0) license, which permits others to distribute, remix, adapt, build upon this work non-commercially, and license their derivative works on different terms, provided the original work is properly cited, appropriate credit is given, any changes made indicated, and the use is non-commercial. See: http:// creativecommons. org/ licenses/ by- nc/ 4. 0/.
reFerenCes
1. Doyle LW, Anderson PJ, Givens MH. Adult outcome of extremely
preterm infants. Pediatrics 2010;126:342–51.
2. Rauch F, Schoenau E. Skeletal development in premature infants: a
review of bone physiology beyond nutritional aspects. Arch Dis Child
Fetal Neonatal Ed 2002;86:82F–5.
3. Brown LD. Endocrine regulation of fetal skeletal muscle growth:
impact on future metabolic health. J Endocrinol 2014;221:R13–R29.
4. Givens MH, Macy IG. The chemical composition of the human fetus.
J Biol Chem 1933;102:7–17.
5. Johnson MJ, Wootton SA, Leaf AA, et al. Preterm birth and body
composition at term equivalent age: a systematic review and
meta-analysis. Pediatrics 2012;130:e640–9.
6. Giannì ML, Roggero P, Liotto N, et al. Body composition in late
preterm infants according to percentile at birth. Pediatr Res
2016;79:710–5.
7. Huysman WAet al. Growth and body composition in preterm infants
with bronchopulmonary dysplasia. Arch Dis Child Fetal Neonatal Ed
2003;88:46F–51.
8. Morrison KM, Ramsingh L, Gunn E, et al. Cardiometabolic health in
adults born premature with extremely low birth weight. Pediatrics
2016;138. doi:10.1542/peds.2016-0515
9. Scheurer JM, Zhang L, Gray HL, et al. Body composition trajectories
from infancy to preschool in children born premature versus
full-term. J Pediatr Gastroenterol Nutr 2017;64:e147–53.
10. Buttazzoni C, Rosengren B, Tveit M, et al. Preterm children born
small for gestational age are at risk for low adult bone mass. Calcif
Tissue Int 2016;98:105–13.
11. Smith CM, Wright NP, Wales JKH, et al. Very low birth weight
survivors have reduced peak bone mass and reduced insulin
sensitivity. Clin Endocrinol 2011;75:443–9.
12. García-Hermoso A, Cavero-Redondo I, Ramírez-Vélez R, et al.
Muscular strength as a predictor of all-cause mortality in an apparently healthy population: a systematic review and
meta-analysis of data from approximately 2 million men and women. Arch
Phys Med Rehabil 2018;99:2100–13.
13. Warburton DER, Nicol CW, Bredin SSD. Health benefits of physical
activity: the evidence. CMAJ 2006;174:801–9.
14. Penedo FJ, Dahn JR. Exercise and well-being: a review of mental and physical health benefits associated with physical activity.
Current Opinion in Psychiatry 2005;18:189–93.
15. Lowe J, Watkins WJ, Kotecha SJ, et al. Physical activity in
school-age children born preterm. The Journal of Pediatrics
2015;166:877–83.
16. Tikanmäki M, Kaseva N, Tammelin T, et al. Leisure time physical
activity in young adults born preterm. The Journal of Pediatrics
2017;189:135–42.
17. Tikanmäki M, Tammelin T, Kaseva N, et al. Objectively measured
physical activity and sedentary time in young adults born preterm—
The ester study. Pediatric research 2016;81.
18. Welsh L, Kirkby J, Lum S, et al. The EPICure Study: maximal
exercise and physical activity in school children born extremely
preterm. Thorax 2010;65:165–72.
19. Skjærven R, Gjessing HK, Bakketeig LS. Birthweight by gestational
age in Norway. Acta Obstet Gynecol Scand 2000;79:440–9.
20. Rangul V, Holmen TL, Kurtze N, et al. Reliability and validity of two
frequently used self-administered physical activity questionnaires in
adolescents. BMC Med Res Methodol 2008;8.
21. Júlíusson PB, Roelants M, Nordal E, et al. Growth references for
0-19 year-old Norwegian children for length/height, weight, body
mass index and head circumference. Ann Hum Biol 2013;40:220–7.
on September 12, 2020 by guest. Protected by copyright.
22. Brannsether B, Roelants M, Bjerknes R, et al. Waist circumference and waist-to-height ratio in Norwegian children 4-18 years
of age: Reference values and cut-off levels. Acta Paediatrica
2011;100:1576–82.
23. Kelly TL, Wilson KE, Heymsfield SB. Dual energy X-ray
absorptiometry body composition reference values from NHANES.
PLoS ONE 2009;4:e7038.
24. Nixon PA, Washburn LK, Mudd LM, et al. Aerobic fitness and
physical activity levels of children born prematurely following
randomization to postnatal dexamethasone. J Pediatr
2011;158:65–70.
25. Kaseva N, Wehkalampi K, Strang-Karlsson S, et al. Lower
conditioning leisure-time physical activity in young adults born
preterm at very low birth weight. PLoS ONE 2012;7:e32430.
26. Rogers M, Fay TB, Whitfield MF, et al. Aerobic capacity, strength,
flexibility, and activity level in unimpaired extremely low birth weight.
Pediatrics 2005;116:e58–65.
27. Keller H, Bar-Or O, Kriemler S, et al. Anaerobic performance in
5- to 7-yr-old children of low birthweight. Med Sci Sports Exerc
2000;32:278–83.
28. Fevang SKE, Hysing M, Sommerfelt K, et al. Mental health assessed
by the Strengths and Difficulties Questionnaire for children born extremely preterm without severe disabilities at 11 years of age:
a Norwegian, national population-based study. Eur Child Adolesc
Psychiatry 2017;26:1523–31.
29. Telama R, Yang X, Laakso L, et al. Physical activity in childhood and
adolescence as predictor of physical activity in young adulthood.
Am J Prev Med 1997;13:317–23.
30. Patel P, Abate N. Body fat distribution and insulin resistance.
Nutrients 2013;5:2019–27.
31. Hofman PL, Regan F, Jackson WE, et al. Premature birth and later
insulin resistance. N Engl J Med 2004;351:2179–86.
32. Dodds R, Denison HJ, Ntani G, et al. Birth weight and muscle
strength: a systematic review and meta-analysis. J Nutr Health Aging
2012;16:609–15.
33. Giannì ML, Roggero P, Piemontese P, et al. Boys who are born
preterm show a relative lack of fat-free mass at 5 years of age
compared to their peers. Acta Paediatrica 2015;104:e119–23.
34. Kajantie E, Hovi P. Is very preterm birth a risk factor for adult
cardiometabolic disease? Semin Fetal Neonatal Med 2014;19.
35. Balasuriya CND, Evensen KAI, Mosti MP, et al. Peak bone mass
and bone microarchitecture in adults born with low birth weight
preterm or at term: a cohort study. J Clin Endocrinol Metab
2017;102:2491–500.
36. Hovi P, Andersson S, Järvenpää A-L, et al. Decreased bone mineral
density in adults born with very low birth weight: a cohort study.
PLoS Medicine 2009;6:e1000135.
37. Cummings SR, Black DM, Nevitt MC, et al. Bone density at various
sites for prediction of hip fractures. The study of osteoporotic
Fractures Research Group. Lancet 1993;341:72–5.
38. Lang JJ, Tremblay MS, Léger L, et al. International variability in 20 m
shuttle run performance in children and youth: who are the fittest from a 50-country comparison? A systematic literature review with
pooling of aggregate results. Br J Sports Med 2018;52.
39. Allin Met al. Neurological abnormalities in young adults born
preterm. J Neurol Neurosurg Psychiat 2006;77:495–9.
40. James E, Wood CL, Nair H, et al. Preterm birth and the timing of
puberty: a systematic review. BMC Pediatr 2018;18.
on September 12, 2020 by guest. Protected by copyright.