O R I G I N A L R E S E A R C H
An LC-MS/MS Bioanalytical Assay for the
Determination of Gilteritinib in Rat Plasma and
Application to a Drug
–
Drug Interaction Study
This article was published in the following Dove Press journal: Drug Design, Development and Therapy
Qiong Wang1
Zhe Chen 1
Dingwen Chen1
Xia-yan Ye2
1Department of Pharmacy, Wenzhou
People’s Hospital, Wenzhou, Zhejiang 325000, People’s Republic of China;
2Department of Brain Surgery, The
People’s Hospital of Lishui, Lishui, Zhejiang 323000, People’s Republic of China
Background: Gilteritinib, a novel, potent FLT3/AXL inhibitor, was recently approved in
Japan and USA for the treatment of adult patients who have relapsed or refractory acute myeloid leukemia (AML) with a FLT3 mutation.
Purpose and Methods: In this study, we aimed to develop and validate a sensitive and
simple ultra performance liquid chromatography tandem mass spectrometry (UPLC-MS/MS) method for the quantification of gilteritinib in plasma and to investigate whether CYP3A4 inhibitors (fluconazole and itraconazole) could influence the pharmacokinetics of gilteritinib from a drug–drug interaction study in rats. Sample preparation was done by a simple protein crash with acetonitrile containing the internal standard (IS) pirfenidone, followed by UPLC-MS/MS quantification.
Results: The assay was successfully validated in a 1–500 ng/mL calibration range for
gilteritinib, where the lower limit of quantification (LLOQ) was set at 1 ng/mL. The intra-day and inter-intra-day precisions for gilteritinib were less than 10.6%, and the accuracies were in the range of −14.5% to 11.1%. Recovery and matrix effect of the analyte and IS were acceptable, and the analyte was stable during the assay and storage in plasma samples. The validated UPLC-MS/MS method was successfully applied to a drug–drug interaction study between gilteritinib and CYP3A4 inhibitors (fluconazole and itraconazole) in rats. Itraconazole significantly increased the exposure of gilteritinib, and affected the pharmaco-kinetics of gilteritinib in rats, notfluconazole.
Conclusion: A further clinical study should be conducted to investigate the effect of
itraconazole on the metabolism of gilteritinib in subjects.
Keywords:gilteritinib, drug–drug interaction, pharmacokinetic, UPLC-MS/MS, CYP3A4
inhibitors
Introduction
Advances in the understanding of the molecular basis for acute myeloid leukemia (AML) have generated new potential targets for treatment. FMS-like tyrosine kinase 3 (FLT3) is one of the most frequently mutated genes in AML and mutations in this gene are
associated with poor overall survival.1,2AXLplays a role in the activation ofFLT3and
has been implicated in the pathogenesis of AML. Gilteritinib (Figure 1A), a highly
specific, novel, potentFLT3/AXLinhibitor, has demonstrated antileukemic activity in
patients with AML.3–5Recently, it was approved in Japan and USA for the treatment of
adult patients who have relapsed or refractory AML with aFLT3mutation.6After oral
administration, gilteritinib is primarily metabolized in the liver by the activity of
Correspondence: Xia-yan Ye The People’s Hospital of Lishui, No.15 Dazhong street, Liandu District, Lishui, Zhejiang, People's Republic of China Email [email protected]
Drug Design, Development and Therapy
Dove
press
open access to scientific and medical research
Open Access Full Text Article
Drug Design, Development and Therapy downloaded from https://www.dovepress.com/ by 118.70.13.36 on 24-Aug-2020
CYP3A4.7It is also reported that strong CYP3A4 inhibitors may increase gilteritinib exposure and the frequency of adverse reactions, even serious or life-threatening toxicity.6Therefore, it is suggested that co-administration of gilteritinib with strong or moderate CYP3A4 inhibitors should be avoided. However, the possibility of pharmacokinetic interaction between
gilter-itinib and CYP3A4 inhibitors (such asfluconazole, and
itraco-nazole) have not been investigated in detail.
As pharmacokinetic and drug–drug interaction
informa-tion are important for dosing optimizainforma-tion, and therefore maximizing treatment effectivity and minimizing the risk of emergence of adverse reactions, it is necessary to develop
and validate a sensitive analytical method for the quantifi
ca-tion of gilteritinib in biologicalfluids. Until now, only one
paper assessed the pharmacokinetic profile of gilteritinib in
patients with AML.5 However, this analytical method did
not offer enough data for repeating in other laboratories (e.g.
plasma extraction procedure, chromatography conditions, parameters of the method, etc). Thus, this method does not meet the requirement of high sample throughput in
bioana-lysis for pharmacokinetic or drug–drug interaction study.
Therefore, we designed, developed and validated a sen-sitive and quick ultra performance liquid chromatography tandem mass spectrometry (UPLC-MS/MS) method allow-ing the determination of gilteritinib in plasma with simple
sample preparation, and investigated the effects offl
ucona-zole and itraconaucona-zole on the exposure and pharmacokinetic changes of gilteritinib in rats by comparing the plasma con-centrations and pharmacokinetic parameters of gilteritinib.
Purpose and Methods
Chemicals Materials
Gilteritinib,fluconazole, itraconazole (all purity >98%) and
pirfenidone (IS, purity >98%,Figure 1B) were supplied by
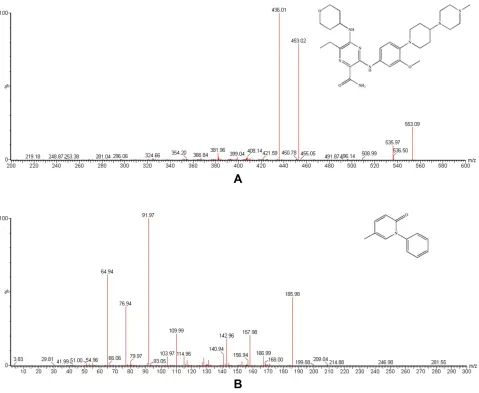
Figure 1Mass spectra of gilteritinib (A) and pirfenidone IS, (B) in this study.
Drug Design, Development and Therapy downloaded from https://www.dovepress.com/ by 118.70.13.36 on 24-Aug-2020
Beijing Sunflower and Technology Development Co., Ltd (Beijing, China). Acetonitrile and methanol were HPLC grade and offered from Merck Company (Darmstadt, Germany). Analytical grade of formic acid was purchased
from Beijing Sunflower and Technology Development Co.,
Ltd. Ultrapure water was prepared using a Milli-Q Water
Purification System (EMD Millipore).
Animal Experiments
Healthy male Sprague Dawley rats with body weight of
180–220 g, were used and obtained from Laboratory
Animal Center of Wenzhou Medical University
(Zhejiang, China). Rats were raised under standard tem-perature, humidity, and light conditions, and fed standard rodent diet and water. This experiment was approved by the Animal Care and Use Committee of Wenzhou Medical University, according to National Institutes of Health
(NIH) Guidelines for the welfare and use of animals.8
Gilteritinib,fluconazole, and itraconazole were all
sus-pended in 0.5% carboxymethyl cellulose sodium (CMC-Na). Thirty Sprague Dawley rats were randomly divided
intofive groups (n=6) and orally administered the
approx-imate equivalent volume solutions: Group A (the control group, 0.5% CMC-Na); Group B (single dose
administra-tion of 20 mg/kg fluconazole half an hour before
experi-ment); Group C (20 mg/kg fluconazole once daily for
seven days before experiment); Group D (single dose administration of 20 mg/kg itraconazole half an hour before experiment); Group E (20 mg/kg itraconazole once daily for seven days before experiment). Thirty min-utes later, 10 mg/kg gilteritinib was orally administered to each rat. At the time points of 0, 0.333, 0.667, 1, 2, 4, 9, 12, 24, 36 and 48 h, approximately 0.3 mL of blood samples were withdrawn from the tail vein into hepari-nized 1.5 mL polythene tubes. Subsequently, after centri-fugation at 4000 g for 10 min at room temperature, 100 µL
plasma was taken after the separation and stored at−20°C
until analysis.
Instrumentations and Analytical
Conditions
LC-MS/MS method was conducted by a Waters Acquity ultra performance liquid chromatography (UPLC) system coupled with a Waters Xevo TQ-S triple quadrupole tandem mass spectrometer (Milford, MA, USA). The Masslynx 4.1 software (Waters Corp., Milford, MA, USA) was used for data acquisition, processing and instrument control.
The chromatographic separation of gilteritinib and IS was carried out on an Acquity BEH C18 column (2.1 mm
× 50 mm, 1.7μm). Meanwhile, the mobile phase used for
the analysis was acetonitrile (solvent A) and 0.1% formic
acid in water (solvent B) delivered at a flow rate of
0.40 mL/min. The procedures for the linear gradient
elu-tion were conducted as follows: 0–0.5 min, 10% A;
0.5–1.0 min, 10–90% A; 1.0–2.0 min, 90% A; and
2.0–2.1 min, 90–10% A. Then, 10% A from 2.1 to 3.0
min was maintained for equilibration. The entire run time was 3.0 min for an injection volume of 2.0 µL. The samples were maintained at 10°C in an autosampler, while the column oven temperature was set at 40°C.
Mass spectrometric determination was performed by an electrospray ionization (ESI) source set in the positive ion mode. General parameters, such as gas, voltage and tem-perature, were optimized as follows: cone gas, 150 L/h, desolvation gas, 1000 L/h, collision gas, 0.15 mL/min, capillary voltage, 2.0 kV, desolvation temperature, 800° C. Multiple reaction monitoring (MRM) mode was selected and used, in which the ion transitions for
gilter-itinib and IS were m/z 553.1→ 436.0 and m/z 186.0 →
92.0, respectively. The cone voltage and collision energy were 30 V and 30 eV for gilteritinib and were 20 V and 25 eV for IS, respectively.
Standard Solutions, Calibration Standards
and Quality Control (QC) Samples
Standard stock solutions of 1.00 mg/mL of both gilteritinib and IS were prepared by dissolving the compounds in an appropriate amount of methanol for calibration curve and quality control (QC) samples. Two series of working solu-tions were obtained by diluting the stock solusolu-tions with methanol so as to prepare the plasma standard points of the calibration curve and the plasma QC samples with con-centrations of 1, 5, 10, 20, 50, 100, 200, 500 ng/mL and 2, 40, 400 ng/mL, respectively. The IS working solution was prepared at 100 ng/mL by dilution of its stock solution with methanol. All stock and working solutions were
stored at−20°C for further use.
Sample Preparation
A volume of 100 µL of the actual sample, 20 µL IS working solution was added and mixed for 1.0 min. Then, the plasma samples were mixed with 300 µL of acetonitrile for protein precipitation, and each tube was thoroughly vortexed for 1.0 min and centrifugated at
Dovepress Wang et al
Drug Design, Development and Therapy downloaded from https://www.dovepress.com/ by 118.70.13.36 on 24-Aug-2020
13,000 g for 10 min at nominally 4°C. Finally, 100 µL of the obtained supernatant was transferred to an autosampler vial and 2.0 µL was injected into the UPLC-MS/MS system for analysis.
Method Validation
This study was conducted in compliance with the FDA
principle on the bioanalytical method validation,9 which
needs to examine the following parameters: the selectivity,
calibration curve, lower limit of quantification (LLOQ),
accuracy and precision, matrix effect, recovery and stabi-lity at various test conditions.
Statistical Analysis
The mean plasma gilteritinib concentration-time curve was explored by Origin 8.0 (Originlab Company, Northampton, MA, USA), and the pharmacokinetic parameters of gilter-itinib were calculated by DAS (Drug and Statistics) soft-ware (Version 2.0, Shanghai University of Traditional Chinese Medicine, China) in noncompartmental mode. Statistical comparisons of the main pharmacokinetic para-meters within each group were carried out with the Statistical Package for the Social Sciences (version 17.0; SPSS Inc., Chicago, IL, USA) by one-way analysis of
variance coupled with the Dunnett’s test. In all cases,
aP-value below 0.05 was deemed statistically significant.
Results and Discussion
Method Development and Optimization
Gilteritinib and IS (200 ng/mL in methanol: water 50:50, v/v for each substance) were directly infused into the mass spectrometer, and the conditions of product ion mass spec-tra of gilteritinib and IS were optimized. Different settings that produced the highest sensitivity by monitoring the product ion transition were compared. In positive full
mass scan (as shown in Figure 1), gilteritinib and IS
generated a protonated molecular ion [M+H]+, and the
most abundant fragment ions for MRM were m/z 553.1
→ 436.0 and m/z 186.0 → 92.0, with collision energy
values of 30 eV and 25 eV for gilteritinib and IS, respectively.
Different analytical columns were evaluated and
com-pared, and BEH C18 (2.1 mm × 50 mm, 1.7 μm) column
displayed efficient separation, short chromatographic retention
time and peak symmetry. Considering the addition of formic acid might enhance the chromatograms and signals of the analyte and IS in the mobile phase, thus, the optimized mobile
phase comprised acetonitrile and 0.1% formic acid in water. In addition, the excessive numbers of plasma samples generated
in pharmacokinetic or drug–drug interaction study, a simple
and quick sample preparation method is always preferable. Although plasma protein precipitation may introduce endo-genous components that cause matrix effects during LC-MS /MS analysis, an appropriate retention time and gradient elu-tion could overcome matrix effects to some extent. Therefore, acetonitrile was employed for sample preparation in this study.
Method Validation
Selectivity
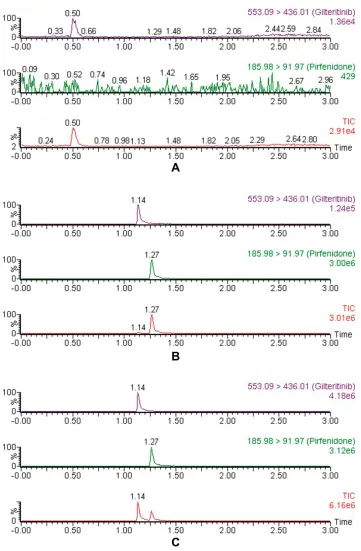
The chromatograms of blank plasma from six separate batches, blank plasma spiked with gilteritinib at LLOQ (1 ng/mL) and IS, and the real plasma sample of rat
were shown inFigure 2. The retention times of gilteritinib
and IS were 1.14 and 1.27 min, respectively. No apparent interferences from endogenous substance were observed at the retention times of the analyte and IS.
Calibration Curve and LLOQ
In the range of 1–500 ng/mL gilteritinib, the calibration
curve exhibited an excellent linearity. The sensitivity of the method was measured by LLOQ and established as 1
ng/mL, with sufficient accuracy and precision (Table 1).
Accuracy and Precision
The accuracy and precision of the developed LC-MS/MS assay were investigated on three separate days. As
pre-sented in Table 1, the intra- and inter-day accuracy for
gilteritinib was within −4.0 to 4.3% and −14.5 to 11.1%,
respectively. The intra- and inter-day precision for
gilter-itinib was≤9.2% and≤10.6%, respectively.
Recovery and Matrix Effect
At three QC levels, the recovery of gilteritinib in rat plasma ranged from 84.6% to 91.9% and the mean recov-ery of the IS was 90.6 ± 6.6%. Moreover, the matrix effect was evaluated and indicated within the acceptable limit
(96.1–102.4%) for gilteritinib, while the matrix effect of
the IS was 99.8 ± 5.9%. All the results were shown in
Table 2. Therefore, the matrix effect on the ionization of
the analyte appeared to be insignificant and did not affect
the accuracy of the optimized LC-MS/MS method.
Stability
Stability experiments were performed to determine whether gilteritinib was stable under typical sample
Drug Design, Development and Therapy downloaded from https://www.dovepress.com/ by 118.70.13.36 on 24-Aug-2020
storage and analysis conditions in rat plasma. It was found to be stable when plasma gilteritinib samples were in the auto-sampler (10°C) for at least four hours and at room
temperature for at least 24 h, three complete freeze (−20°
C)/thaw (RT) cycles and at−20°C for at least 31 days.
Animal Study
The established method was successfully employed for
mea-suring the plasma concentrations of gilteritinib in a drug–
drug interaction study between gilteritinib and CYP3A4
inhibitors (fluconazole and itraconazole) in rats. After
Figure 2Representative chromatograms of gilteritinib and IS in rat plasma: (A) blank plasma; (B) blank plasma spiked with standard solution at LLOQ (1 ng/mL) and IS; (C) sample obtained from a rat at 1.0 h after oral administration of 10 mg/kg gilteritinib.
Dovepress Wang et al
Drug Design, Development and Therapy downloaded from https://www.dovepress.com/ by 118.70.13.36 on 24-Aug-2020
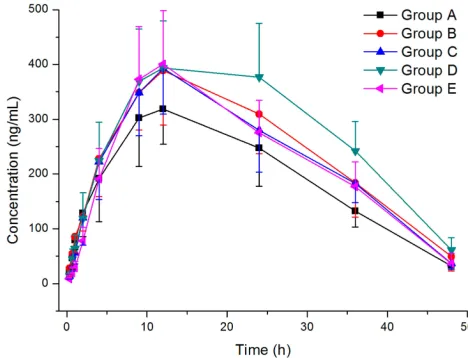
a single oral administration of 10 mg/kg gilteritinib, the average plasma concentration-time curves of gilteritinib in different treatment groups of rats were demonstrated in
Figure 3, and the main pharmacokinetic parameters by
non-compartment model analysis were summarized inTable 3.
Fluconazole and itraconazole are widely used in the treatment of opportunistic fungal infections, and, as shown
by interaction studies in humans, itraconazole is a strong
CYP3A4 inhibitor,10–12 whereas fluconazole inhibits
CYP3A4, CYP2C9, and CYP2C19.13,14 In this study, an
dose of 20 mg/kg offluconazole and itraconazole was
admi-nistered only once in Group B and Group D, and once daily for seven days in Group C and Group E, respectively. On the seventh day, 10 mg/kg gilteritinib was co-administered half
an hour after fluconazole and itraconazole administration.
When compared with Group A, although co-administered
withfluconazole increased the AUC and Cmaxof gilteritinib
(P>0.05), it had no relevant effect on the exposure of gilter-itinib in Group B and Group C. These results were consistent
with the literature,15where there was no meaningful
phar-macokinetic drug–drug interaction between vismodegib and
fluconazole. However, itraconazole produced an increase in
Table 1The Precision and Accuracy of Gilteritinib in Rat Plasma
(n=6)
Analyte Concentration (ng/mL)
Intra-day Inter-day
RSD %
RE %
RSD %
RE%
1 15.6 5.0 10.8 −5.9
2 14.9 −4.0 10.6 −14.5
Gilteritinib 40 5.7 7.6 4.7 12.2
400 4.4 1.2 2.2 −1.3
Table 2Recovery and Matrix Effect of Gilteritinib in Rat Plasma
(n=6)
Analyte Concentration Added (ng/mL)
Recovery (%) Matrix Effect (%)
Mean ±SD
RSD (%)
Mean ±SD
RSD (%)
2 84.6 ±
11.8
13.9 96.1 ±
13.5 14.0
Gilteritinib 40 90.9 ±
7.4
8.1 102.4
± 12.1 11.8
400 91.9 ±
5.2
5.7 101.9
± 7.6 7.4
Figure 3Mean plasma concentration-time curves of gilteritinib in different treat-ment groups of rats. Group A: the control group (0.5% CMC-Na); Group B: single dose administration of 20 mg/kgfluconazole; Group C: 20 mg/kgfluconazole once daily for seven days; Group D: single dose administration of 20 mg/kg itraconazole; Group E: 20 mg/kg itraconazole once daily for seven days. (n=6).
Table 3The Main Pharmacokinetic Parameters of Gilteritinib in Different Treatment Groups of Rats
Parameters Group A Group B Group C Group D Group E
AUC0→t(ng/mL•h) 9293.46 ± 1831.43 11,581.94 ± 2450.85 11,125.64 ± 2442.76 13,248.15 ± 2864.19* 11,000.25 ± 2329.76
AUC0→∞(ng/mL•h) 11,471.26 ± 2361.26 13,799.11 ± 2621.59 14,025.59 ± 2987.81 15,263.71 ± 3724.04* 12,568.87 ± 3641.61
MRT0→t(h) 19.50 ± 1.53 20.04 ± 1.48 19.98 ± 1.34 21.37 ± 1.01 19.91 ± 0.90
MRT0→∞(h) 21.84 ± 2.29 23.05 ± 2.74 21.18 ± 2.08 25.70 ± 2.86 22.08 ± 1.93
t1/2(h) 14.34 ± 2.25 14.73 ± 2.82 14.76 ± 2.42 16.16 ± 2.50 14.44 ± 2.28
Tmax(h) 11.00 ± 1.55 11.05 ± 1.56 12.00 ± 1.61 15.50 ± 2.68* 12.05 ± 2.10
CLz/F (L/h) 0.90 ± 0.19 0.79 ± 0.16 0.74 ± 0.16 0.70 ± 0.22 0.86 ± 0.27
Cmax(ng/mL) 341.45 ± 65.07 411.16 ± 75.05 399.08 ± 83.80 426.77 ± 88.82* 406.81 ± 97.77
Notes:Group A: the control group (0.5% CMC-Na); Group B: single dose administration of 20 mg/kgfluconazole; Group C: 20 mg/kgfluconazole once daily for seven days; Group D: single dose administration of 20 mg/kg itraconazole; Group E: 20 mg/kg itraconazole once daily for seven days. (n=6, mean ±SD). Compared with Group A, *P<0.05.
Drug Design, Development and Therapy downloaded from https://www.dovepress.com/ by 118.70.13.36 on 24-Aug-2020
total gilteritinib systemic exposure in Group D, where the changes in exposure parameters of gilteritinib were consid-ered relevant, but not in Group E. Therefore, concomitant use of gilteritinib with strong CYP3A4 inhibitors should be avoided as the combined use increases gilteritinib exposure. If concomitant use of a strong CYP3A4 inhibitor is unavoid-able, the results of this study support a dose reduction of gilteritinib. As the study of the effects of CYP3A4 inhibitors on gilteritinib metabolism were performed in rats with a few, further research should be done.
Conclusions
In conclusion, a simple, sensitive and reliable UPLC-MS /MS method was fully developed and validated to deter-mine the plasma concentration of gilteritinib in rat plasma
for the first time. The applicability of the optimized
UPLC-MS/MS method was demonstrated in a drug–drug
interaction study between gilteritinib and CYP3A4
inhibi-tors (fluconazole and itraconazole), where itraconazole
increased the exposure of gilteritinib in rats. Therefore, adaptation of the dose of gilteritinib might be required when administered concomitantly with itraconazole.
Disclosure
The authors report no conflicts of interest in this work.
References
1. Cancer Genome Atlas Research N, Ley TJ, Miller C, et al. Genomic and epigenomic landscapes of adult de novo acute myeloid leukemia. N Engl J Med. 2013;368(22):2059–2074. doi:10.1056/NEJMoa1 301689
2. Levis M. FLT3 mutations in acute myeloid leukemia: what is the best approach in 2013? Hematol Am Soc Hemat. 2013;2013:220–226. doi:10.1182/asheducation-2013.1.220
3. Usuki K, Sakura T, Kobayashi Y, et al. Clinical profile of gilteritinib in Japanese patients with relapsed/refractory acute myeloid leukemia: an open-label Phase 1 study. Cancer Sci. 2018;109(10):3235–3244. doi:10.1111/cas.13749
4. Ueno Y, Mori M, Kamiyama Y, et al. Evaluation of gilteritinib in combination with chemotherapy in preclinical models of FLT3-ITD (+) acute myeloid leukemia. Oncotarget. 2019;10(26):2530–2545. doi:10.18632/oncotarget.26811
5. Perl AE, Altman JK, Cortes J, et al. Selective inhibition of FLT3 by gilteritinib in relapsed or refractory acute myeloid leukaemia: a multicentre,first-in-human, open-label, phase 1–2 study. Lancet Oncol.2017;18(8):1061–1075. doi:10.1016/S1470-2045(17)30416-3 6. Dhillon S. Gilteritinib: first global approval. Drugs. 2019;79
(3):331–339. doi:10.1007/s40265-019-1062-3
7. Astellas Pharma. XOSPATA (gilteritinib): US prescribing infor-mation. 2018. Available from: https://www.accessdata.fda.gov/drug satfda_docs/label/2018/211349s000lbl.pdf. Accessed December 24, 2018.
8. Clark JD, Gebhart GF, Gonder JC, Keeling ME, Kohn DF Special report: the 1996 guide for the care and use of laboratory animals. ILAR J.1997;38(1):41–48. doi:10.1093/ilar.38.1.41
9. Center for Drug Evaluation and Research of the U.S. Department of Health and Human Services Food and Drug Administration, Guidance for industry; Bioanalytical method validation.2018. Available from:
http://www.fda.gov/Drugs/GuidanceComplianceRegulatoryInformation/ Guidances/ucm064964.htm. Accessed August 2, 2018.
10. Zhou X, Pant S, Nemunaitis J, et al. Effects of rifampin, itraconazole and esomeprazole on the pharmacokinetics of alisertib, an investiga-tional aurora a kinase inhibitor in patients with advanced malignancies.Invest New Drugs.2018;36(2):248–258. doi:10.1007/ s10637-017-0499-z
11. Barbour AM, Punwani N, Epstein N, et al. Effect of Itraconazole or rifampin on itacitinib pharmacokinetics when administered orally in healthy subjects. J Clin Pharmacol. 2019;59(12):1641–1647. doi:10.1002/jcph.1484
12. Dai D, Yang H, Nabhan S, et al. Effect of itraconazole, food, and ethnic origin on the pharmacokinetics of ivosidenib in healthy subjects.Eur J Clin Pharmacol. 2019;75(8):1099–1108. doi:10.10 07/s00228-019-02673-6
13. Kaukonen KM, Olkkola KT, Neuvonen PJ. Fluconazole but not itraconazole decreases the metabolism of losartan to E-3174. Eur J Clin Pharmacol.1998;53(6):445–449. doi:10.1007/s002280050405 14. Yang J, Atkins WM, Isoherranen N, Paine MF, Thummel KE. Evidence of CYP3A allosterism in vivo: analysis of interaction betweenfluconazole and midazolam.Clin Pharmacol Ther.2012;91 (3):442–449. doi:10.1038/clpt.2011.178
15. Malhi V, Colburn D, Williams SJ, et al. A clinical drug-drug inter-action study to evaluate the effect of a proton-pump inhibitor, a combined P-glycoprotein/cytochrome 450 enzyme (CYP)3A4 inhi-bitor, and a CYP2C9 inhibitor on the pharmacokinetics of vismodegib. Cancer Chemother Pharmacol. 2016;78(1):41–49. doi:10.1007/s00280-016-3020-z
Drug Design, Development and Therapy
Dove
press
Publish your work in this journal
Drug Design, Development and Therapy is an international, peer-reviewed open-access journal that spans the spectrum of drug design and development through to clinical applications. Clinical outcomes, patient safety, and programs for the development and effective, safe, and sustained use of medicines are a feature of the journal, which has also
been accepted for indexing on PubMed Central. The manuscript management system is completely online and includes a very quick and fair peer-review system, which is all easy to use. Visit http://www. dovepress.com/testimonials.php to read real quotes from published authors.
Submit your manuscript here:https://www.dovepress.com/drug-design-development-and-therapy-journal
Dovepress Wang et al
Drug Design, Development and Therapy downloaded from https://www.dovepress.com/ by 118.70.13.36 on 24-Aug-2020