ESTIMATION OF OPTIMUM FIELD PLOT SIZE AND SHAPE IN PADDY YIELD TRIAL
M. Asif Masood, Irum Raza* and Muhammad Yaseen**
ABSTRACT:- The present study was designed to estimate the optimum plot size with the shape for field research experiments on paddy yield trial considering the effect of plot size on variability in yield of crop as well as studying the coefficients of variation of different plot sizes and shapes of plots. The Smith's index of soil heterogeneity was computed to estimate optimum plot size and shape using yield data of the 12m×24m recorded separately from each basic unit of 1m×1m (288 basic units). Soil productivity contour map described graphically the productivity level of the experimental site. The index of soil heterogeneity (b = 0.491) indicated a degree of low similarity among the experimental plots. Variance per unit area and coefficient of variation decreased rapidly with an increase in the plot size. Based on the coefficient of variation the optimum plot size for paddy yield trial was estimated to be 6m×12m with rectangle shape for Rice Research Institute, Kala Shah Kaku, Lahore. This estimated plot size is larger than the plot size of 3m×5m generally used for paddy yield in the study area.
Key Words: Paddy; Plot Size; Plot Shape; Soil Heterogeneity; Variance; Coefficient of Variation; Yield Trial; Pakistan.
* Social Sciences Research Institute, National Agricultural Research Centre, Islamabad, Pakistan. ** Department of Mathematics and Statistics, University of Agriculture, Faisalabad, Pakistan. Corresponding author: [email protected]
INTRODUCTION
It is important for the crop scientists to have knowledge on field plot techniques, the study of size and shape of plot best suited for a particular type of experiment. It is of utmost importance to use the most efficient shape, size and arrange-ments of plots in a particular experi-ment for obtaining the reliable results. The precision of significance tests in field trial is largely controlled by size and shape of plots, which are further controlled by the size, and shape of area available for the particular trial, the nature of fertility or other variation.
The problem was therefore
field-plot techniques.
Gomez and Gomez (1984) described that uniformity trial involves planting an experimental site with a single crop variety, applying cultural and management practices as uniformly as possible. All sources of variability, except that due to native soil differences, are kept constant. The planted area is sub divided into small units of the same size (generally referred to as basic units) from which separate measurements of productivity, such as grain yield are made. The size of the basic unit is governed mostly by available resources. The smaller the basic unit, the more detailed is the measurement of soil heterogeneity.
In field experiments, soil variability is one of the important external sources of variation. This variability may be random or systematic. Usually researchers use block experiments to minimize this source of variation. Leilah and Al-Khateeb (2007) carried out a study to estimate the optimum plot size, shape and number in the desert rangeland of Saudi Arabia. The weighted index of soil heterogeneity was estimated to be 0.69 which showed lower correlation between adjacent plots. Bhatti and Rashid (2005) studied the effect of shape and size of plots on spatial variability in cotton yields using statistical procedures such as frequency plot analysis and semivariogram analysis to study the nature and magnitude of variability in the yield.
Mohammad et al. (2001) studied size and shape of plots for wheat trials in field experiments on 29 different data sets using the index of h e t e r o g e n e i t y a n d u l t i m a t e l y estimated the plot sizes under
different situations for plant height, grain yield and straw yield. Their first method was based on the techniques proposed by Lin et al. (1983) and Binns (1982) while the second met-hod used was of Smith's empirical relation. Nasr (1997) estimated the optimum plot size, shape and number of replications for wheat yield trials under different fertilizer conditions.
The objectives of the present study were to estimate the optimum plot size and shape for field research experiments on paddy yield trial; to determine the effect of plot size on variability in yield; and to study the coefficients of variation of different plot sizes and shapes.
MATERIALS AND METHOD
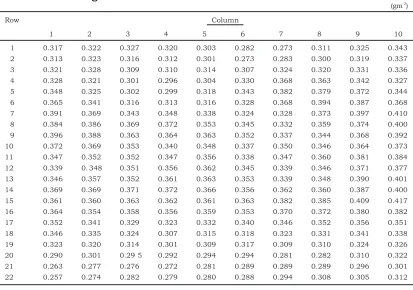
The data were collected from Rice Research Institute, Kala Shah Kaku, Lahore, Punjab on paddy yield trial in close collaboration with Rice Programme, NARC, Islamabad. A single rice line T5 in crop area of 12m × 24m was selected randomly to consider all management practices as uniform as possible (Table 1). Yield data were recorded separately from each basic unit of 1m×1m. Grains from each of the 288 basic units were harvested, bagged, threshed, cleaned, dried, and weighed separately. Yield differences between these basic units were taken as a measure of the area's soil heterogeneity. Yield moving averages o f 3 m × 3 m b a s i c u n i t s w e r e calculated from an experiment covering 12m×24m (Table 2).
Table 1. Yield from an experiment covering 12m×24 m
averages of adjacent units. Serial correlation was computed to check the presence of the fertility gradients. Two serial correlation coefficients one for the horizontal and the other for vertical arrangement were calculated from the paddy yield trial data. Mean squares among strips were computed to indicate the direction of the fertility gradient .
Smith's index of soil hetero-geneity was used to derive optimum plot size. The index gives a single value as a quantitative measure of soil heterogeneity in an area. The value of the index indicates the degree of correlation between adjacent experimental plots. Its value varies between unity and zero. The larger the value of the index, the lower is the correlation between adjacent plots, indicating that fertile spots are distributed randomly or in patches. To calculate Smith's index of soil heterogeneity, variance per unit area Vx, variance between plots, Vx1, and coefficients of variation for plots of various sizes and shapes were calculated to determine plot size and shape of plot.
RESULTS AND DISCUSSION
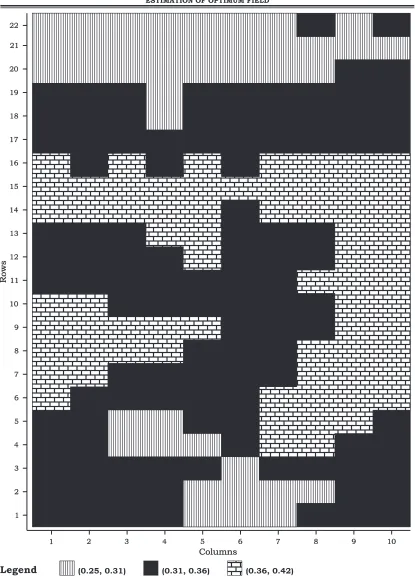
The fertility contour map of a field measuring 24m×12m basic units and from moving averages of 3m×3m basic units (Figure 1) were d r a w n . T h e s e c o n t o u r m a p s graphically depict the productivity level of the experimental site. The values of the vertical and horizontal serial correlation coefficients are 0.314 and 0.341 respectively. Both coefficients are low which indicates that some fertility gradient is present. However, the horizontal serial correlation coefficient was little
high than vertical implying that the fertility gradient was more pronou-nced horizontally than vertically. Mean square for horizontal strips (0.014) was relatively higher than mean square for vertical strips (0.006), which concurs with the contour map and indicates that trend of soil fertility, was more pronounced along the length than along the width of the field. It corroborates the results by Gomez and Gomez (1984) that is due to high horizontal serial correlation coeffi-cient and mean square between strips, the contour map was more pronounced horizontally than vertically.
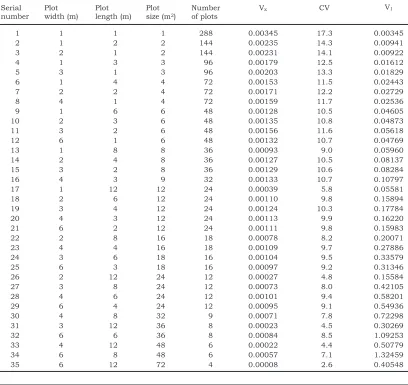
Coefficients of variation for plots of various sizes and shapes, between plot variance Vx and variance per basic unit area Vx1, indicate that as the plot size increases, coefficients of variation and variance per unit area decreases and this decrease is maximum with the rectangle shape plot of 6m×12m (Table 3). This decrease in the coefficient of variation and variance per unit area imply that the plot of rectangular shape of 6m×12m basic unit was the most effective in reducing soil variation and is therefore considered the optimum plot size (Figure 2 and 3). The value of soil heterogeneity index was 0.491 which showed a degree of low relationship among the experimental units. Similar results were found by Gomez and Gomez (1984) to study the shape and size of plots in field experiments and spatial variability.
1 1
2 3 4 5 6 7 8 9 10 11 12 13 14 15 16 17 18 19 20 21 22
2 3 4 5 6 7 8 9 10
Columns
R
o
w
s
Legend (0.25, 0.31) (0.31, 0.36) (0.36, 0.42)
0 20 40 60 0.003 0.002 0.001 0.000 2
Plot Size (m )
V a ri a n c e p e r u n it a re a 0 6 8 10 12 14 16
10 20 30 40 50 60 70
C
V
Size
Figure 2. R e l a t i o n s h i p b e t w e e n variance per unit area and plot size
Figure 3. Relationship between CV per unit area and plot size
Table 3. Smith's Index of Soil Heterogeneity
Plot width (m) 1 1 2 1 3 1 2 4 1 2 3 6 1 2 3 4 1 2 3 4 6 2 4 3 6 2 3 4 6 4 3 6 4 6 6 Plot length (m) 1 2 1 3 1 4 2 1 6 3 2 1 8 4 2 3 12 6 4 3 2 8 4 6 3 12 8 6 4 8 12 6 12 8 12 Plot size (m2)
also conducted research to find optimum plot size, shape and orientation for field experiments and spatial variability.
The results of the study revealed that there was a considerable variation in yield data gathered from different plot sizes. Plot size of 6m×12m was found optimum for field experiment on paddy line T5 using the coefficient of variance technique. Among the three shapes of the plots like rectangle, square and strip, the rectangle shape was found suitable for large plot size due to the decrease in the values of the coefficient of variation with each unit increase in the plot size. The estimated plot size of 6mx12m with rectangle shape at Rice Research Institute, Kala Shah Kaku, Lahore, Punjab is recommended for future field experiments on paddy yield trials. Researchers of the relevant Research Station may use the estimated plot size in the study to have better control over the variability of the field experiment. Keeping in view the results of coefficients of variation, rectangle shape plots are also suggested when the researchers are not familiar with the fertility pattern of the experi-mental area. Suitable plot size with shape shall improve the quality of research results in this way contributing to the generation of more sound and viable technologies which will ultimately help to reduce the productivity deficit.
LITERATURE CITED
Ali, M. A. and Singh, A. K. 1986. Size and shape of plots and blocks for field experiments with rice in Chhattisgarh plains. Indian J.
Agric. Sci. 56(6): 466-472.
Bhatti, A. U. and Rashid, M. 2005. Shape and size of plots in field experiments and spatial varia-bility. Sarhad J. Agric. 21(2): 251-256.
Binns, M. R. 1982. The choice of plot size in randomized block experiments. J. Am. Soc. Hort. Sci. 107: 17-19.
Gomez, K. A. and Gomez, A. A. 1984. Statistical procedures for Agricultural Research (2nd edn.). John Wiley and Sons, New York, USA.
Katyal, V. and Rajput, R. K. 1978. Effect of size and shape of plots and blocks on variability in the yield of rice grown on saline sodic soils. Indian J. Agri. Sci. 48(10): 614-618.
Khan, N. A. Khan, M. I. and Masood, M. A. 2001. Determining experimental plot size and number of replication based on data from randomized complete block experiments. Sarhad J. Agric. 17(2): 271-275.
Leilah, A. A. and Al-Khateeb, S. A. 2007. Convenient quadrat size, shape and number in the desert rangeland of Saudi Arabia. Pakistan J. Agric. Res. 20(1-2): 62-70.
Lin, C. S. Poushinsky, G. and Jui, P. Y. 1983. Simulation study of three adjustment methods for the modified augmented design and comparison with the balanced lattice square design. J. Agric. Sci. 100(03): 527-534. Masood, M. A. and Javed, M. A.
2003. Variability in field experiments in maize crop in Pakistan. Pakistan J. Agric. Sci. 40(3-4): 207-209.
Ahmad, S. 2001. Size and shape of plots for wheat yield trials in field experiments. Inter. J. Agric. and Biol. 3(4): 397–402.
Nasr, S. M. 1997. Estimation of optimum plot size, shape and number of replications for wheat yield trials under different fertilization conditions. Egyptian J. Agric. Res. 75(4): 1175-1189. Ortiz, R. 1995. Plot techniques for
assessment of bunch weight in
banana trials under two systems of crop management. Agron. J. 87(1): 63-69.
Sills, G. R. and Nienhuis, J. 1993. Field plot technique affects snap bean yield evaluation. J. Am. Soc. Hort. Sci. 118(5): 672-674. Warren, J. A. and Mendez, I. 1981.