Biogeosciences, 7, 569–583, 2010 www.biogeosciences.net/7/569/2010/
© Author(s) 2010. This work is distributed under the Creative Commons Attribution 3.0 License.
Biogeosciences
Changes in mobility and solubility of the redox sensitive metals Fe,
Mn and Co at the seawater-sediment interface following CO
2
seepage
M. V. Ardelan and E. Steinnes
Norwegian University of Science and Technology, Department of Chemistry, 7491 Trondheim, Norway Received: 7 April 2009 – Published in Biogeosciences Discuss.: 12 June 2009
Revised: 26 October 2009 – Accepted: 6 January 2010 – Published: 11 February 2010
Abstract. The impact of CO2seepage on the solubility and distribution of the redox-sensitive metals iron, manganese, and cobalt in seawater and sediment pore water has been studied in experiments in laboratory-scale 0.6 m3chambers. The mobility and solubility of Fe, Mn and Co were inves-tigated in seawater, membrane filtered seawater, and DGT samplers deployed in water and sediment during a 26 day CO2seepage study.
During the first phase of the experiment of CO2 seep-age (0–16 days), total acid-leachable (pH 1) and “dissolved” (<0.2 µm) concentrations of Fe, Mn and Co (DFe, DMn and DCo) in the seawater increased significantly; the ratios of concentrations of DFe, DMn and DCo in the CO2chamber to the corresponding values in the control chamber (RDFe,
RDMnandRDCo) were as high as 6, 65 and 58, respectively. The second phase of experiment consisted of an additional 10 days of incubation, where the concentrations of all the metals studied still increased but at reduced rates for DMn and DCo. The highest values ofRDFe,RDMnandRDCowere about 3 for all metals during this part of the experiment.
DGT (diffusive gradients in thin film) labile fractions de-noted FeDGT, MnDGT and CoDGT were, respectively 50, 25 and 22 times higher in the CO2seepage chamber than in the control chamber in the first phase of the experiment. During the second phase, all DGT labile metal concentrations still increased considerably, most notably for Fe. The ratio of FeDGTin the CO2 chamber to that in the control (RDGT-Fe) was still high, about 5, in the second phase of the experiment, whereas the increase in MnDGT and CoDGT slowed down. Our results indicate that acidification following CO2seepage
Correspondence to: M. V. Ardelan
enhances the mobility and solubility of Fe Mn and Co in sed-iment and overlying water with contribution of changing in redox conditions and seepage related re-suspension.
1 Introduction
Finding appropriate disposal methods for atmospheric CO2 as a means of mitigating CO2-induced global warming has been an important topic in recent years. One of the mitiga-tion measures suggested is the injecmitiga-tion of large amounts of CO2into deep saline aquifers. In the North Sea, a pioneer-ing injection program has been run by the Statoil company since 1996 at the Sleipner Vest platform (Korbol and Kad-dour, 1995). The success of this disposal strategy is depen-dent on the permanent retention of CO2in the aquifer. Large-scale leakage from manmade storage sites is not considered probable (Hawkins, 2004). However, man-made puncture in the cap rock formation due to oil wells, natural fractures (Lewicki et al., 2007), and CO2 reactions with the sealing cap-rock which consists of highly reactive rocks (Gherardi et al., 2007) may cause leakage of the stored CO2 into the overlaying sediment and seawater. Therefore, the possible effects associated with such a leakage and a subsequent seep-age need to be studied.
570 M. V. Ardelan and E. Steinnes: Mobility and solubility of the redox sensitive metals a large increase in Fe solubility after injections of CO2 in
saline sedimentary aquifers. Their geochemical modeling re-sults show that the dissolution of iron oxyhydroxides could mobilize toxic trace metals and toxic organic compounds into groundwater (Kharaka et al., 2006).
The chemical erosion rate is known to be enhanced by the acidity from magmatic CO2releases (Aiuppa et al., 2000). Thus, possible CO2 leakage from geological storage sites into surface sediment and deep sea seepage is likely to cause metal release to the pore water (interstitial) of the sediment and to the sediment-water interface, followed by an enhanced metal flux to the water column.
If seepage occurs, CO2acidification i) can adversely affect benthic organisms that have calcium carbonate shells (Shi-rayama and Thornton, 2005), ii) may cause high mortality rates for nearby in faunal deep-sea communities (Barry et al., 2004) and, iii) may have significant impacts on the structure and function of microbial communities and consequently on nutrient (Widdicombe and Needham, 2007) and trace metal flux at the sediment-seawater interface.
The increase in various trace metals in the acidified seawa-ter by CO2seepage may have effects on organisms in the sur-face sediment and seawater. Therefore the indirect biological effects of CO2seepage may extend beyond the direct effects. Moreover, stripping the already low dissolved O2from sedi-ment pore water by the excess CO2gas in addition to the oxy-gen consumption by organic matter oxidation in the sediment and the sediment-water interface can cause a quick reduction in redox potential (pE) in the leakage zone. Changing the two master parameters, pH and pE, may lead to a cascade of biogeochemical alterations with detrimental effects in the marine systems. Decreasing pH and pE together will change the solubility, speciation, mobility, and biological availability of redox-sensitive metals in the pore water, sediment-water interface, and the water column ( ¨Ozt¨urk, 1995; Hamilton et al., 1996; Morford and Emerson, 1999). The change in pH, pE and the availability of Fe and Mn will affect bacterial pro-duction (Coffin et al., 2004) and cause a significant change in the microbial community structure (Nold and Zwart, 1998). In turn, changes in the microbial community may alter the fundamental cycling of carbon, iron, manganese, oxygen and some other vital elements that control the ecosystem.
In this study we performed a laboratory-scale experiment involving the direct release of CO2through a sediment layer and overlying seawater in a chamber in order to gain more insight into the possible effects of CO2leakage on the geo-chemistry of the redox-sensitive metals Fe, Mn, and Co in sediments near the sediment-water interface. To our knowl-edge, our study is the first experimental research on the im-pact of CO2leakage on the solubility and distribution of trace metals in seawater and sediment pore water. While the exper-imental set up was a batch type due to logistic constraint, we try to simulate a more realistic situation of continuous water exchange over the sediment by replacing the overlying water during the experiment. Since there was no record of any
leak-age from the man-made CO2storage zones, our selection of the magnitude and duration of the artificial CO2seepage was chosen to stay a pH between 6.5–7, which is representing a minimal seepage.
2 Materials and methods
2.1 Experimental setting and sampling
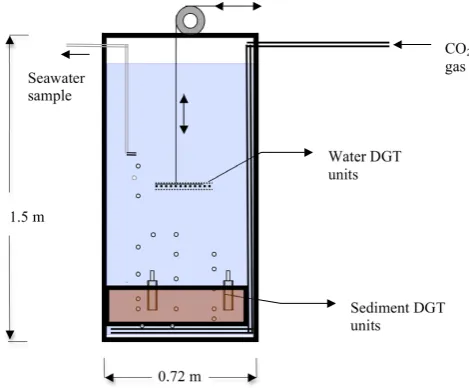
The seawater in the chambers was mixed continuously by vertically moving the disk where diffusive gradients in thin film (DGT, see below) units were deployed (Fig. 1). Tripli-cate seawater samples were taken from the tanks (see Fig. 1) and filtered using a Sartobran cartridge (double layer Sarto-rius filter with 0.4–0.2 µm pore size). Both non-filtered (to-tal acid-leachable me(to-tal – TMe) and filtered seawater sam-ples (DMe) were diluted into acid-washed PE tubes (10 ml) by Milli-Q water (18.2 m) and were acidified by trace-metal free HNO3(Scan-pure, Chem. Scan AS) to 0.1 M final HNO3 concentration. TMe samples were centrifuged for 1 min with 1000 rpm in order to settle the remaining refractory particles at the bottom of the PE tube immediately before the measure-ments.The final determinations of metals were preformed by high-resolution Inductively-Coupled Plasma Mass Spec-trometry (HR-ICP-MS).
Diffusive gradients in thin film (DGT) samplers for wa-ter and sediment (Davison et al., 2000) were purchased from Analytica AB (Sweden). DGT units consist of a 0.4 µm pore-size cellulose acetate filter, a polyacrylamide hydrogel dif-fusion layer, and a Chelex-100 impregnated binding phase. Chelex-100 is a strong complexing resin with immunodi-acetic acid functional ligands. The pore size within the poly-acrylamide hydrogel is dependent upon the amount and type of the cross-linker used, and varies within the range 2–20 nm (Sangi et al., 2002). The DGT units were used to collect the “DGT labile” fraction of metals which have an affinity to the Chelex-100 resin, i.e. the free cation, inorganic complexes, and weak metal organic complexes with relatively fast dis-sociation kinetics (Zhang and Davison, 1995; Scally et al., 2003).
M. V. Ardelan and E. Steinnes: Mobility and solubility of the redox sensitive metals 571
1
Ardelan & Steinnes, Fig. 1
Seawater sample
CO2
gas
Water DGT units
Sediment DGT units 1.5 m
[image:3.595.48.283.63.257.2]0.72 m
Fig. 1.
Schematic representation of the CO
2seepage chamber.
figure
33
Fig. 1. Schematic representation of the CO2seepage chamber.
were developed for CO2exposure experiments (Fig. 1). The chambers have two sections; a lower sediment section con-sisting of 35 cm depth for sediment in a PE container (0.58 m diameter), which is removable, and an upper water section with a capacity of ca. 450 L. The chambers were equipped with various sampling units. Pure CO2gas was used as the experimental treatment while N2gas was used in the control in order to mimic the sediment suspension occurring in the CO2reactor.
Prior to the experiments, all sampling bottles, hoses, tubes and all other plastic ware were acid washed carefully. Fur-ther, the chambers were conditioned for two days with sea-water pumped from a depth of 90 m (1 m above the sea floor) in the Trondheim Fjord, Norway, after which the water was removed again from the chambers.
Sediment samples for CO2 seeping experiments in the laboratory-scale non-pressurized reactors/chambers were taken by box corer from the Trondheim Fjord (at 61◦4100N
and 10◦0051) at the depth of 250 m. Seawater was again
pumped from a depth of 90 m in the Trondheim Fjord and the chambers were equilibrated for 3 days before the actual start of the experiment.
The first phase of experiment lasted for 16 days. After completion of the first phase the water was removed from the chambers and new seawater was pumped onto the sediment layer for a second phase of experiment lasting 10 days in or-der to mimic the real water-sediment interaction situation as far as possible. The sediment and water were purged inter-mittently with pure CO2gas from a sprinkler hose with holes (GARDENA, 05–17/A–B) placed as a spiral below the sed-iment layer. The flow rate of CO2was around 0.045 L s−1 (with 1.5 bar pressure). The cumulative total CO2 seepage time was, respectively 65 and 50 min during the first and second phases of the experiment. At beginning of the
ex-periments the duration of seepage was about 20 min d−1 in the first days in order to bring pH<7, and after that the CO2 seepage was about 3 min d−1. Experiments were performed at 6.5±0.3◦C. The CO2seepage chamber was placed under an exhaust hood in order to remove excess CO2from the lab-oratory.
The seawater in the chambers was mixed continuously by vertically moving the disk where diffusive gradients in thin film (DGT, see below) units were deployed (Fig. 1). Tripli-cate seawater samples were taken from the tanks (see Fig. 1) and filtered using a Sartobran cartridge (double layer Sarto-rius filter with 0.4–0.2 µm pore size). Both non-filtered (total acid-leachable metal – TMe) and filtered seawater samples (DMe) were diluted into acid-washed PE tubes (10 ml) by Milli-Q water (18.2 m) and were acidified by trace-metal free HNO3 (Scan-pure, Chem. Scan AS) to 0.1 M final HNO3 concentration. TMe samples were centrifuged for 1 min with 1000 rpm in order to settle the remaining refractory particles at the bottom of the PE tube immediately before the measure-ments. The final determinations of metals were preformed by high-resolution. Inductively-Coupled Plasma Mass Spec-trometry (HR-ICP-MS).
Diffusive gradients in thin film (DGT) samplers for wa-ter and sediment (Davison et al., 2000) were purchased from Analytica AB (Sweden). DGT units consist of a 0.4 µm pore-size cellulose acetate filter, a polyacrylamide hydrogel dif-fusion layer, and a Chelex-100 impregnated binding phase. Chelex-100 is a strong complexing resin with immunodi-acetic acid functional ligands. The pore size within the poly-acrylamide hydrogel is dependent upon the amount and type of the cross-linker used, and varies within the range 2–20 nm (Sangi et al., 2002). The DGT units were used to collect the “DGT labile” fraction of metals which have an affinity to the Chelex-100 resin, i.e. the free cation, inorganic complexes, and weak metal organic complexes with relatively fast dis-sociation kinetics (Zhang and Davison, 1995; Scally et al., 2003) DGT water samplers were deployed for 9 days in the first experiment and 2, 4, 6 and 9 days in the second ex-periment. DGT water samplers were attached to a moving (12 cm s−1) platform at the medium depth of the water phase. Standard sediment DGT units (Analytica AB, Sweden) with an overall size of 24×4×0.5 cm and a 15×1.8 cm active win-dow were deployed for 9 days in order to determine the ver-tical profiles of trace metals in the upper 15 cm of the sur-face sediment. The DGT-sediment units were degassed prior to deployment by immersing them for 12 h in Chelex-100 treated 0.01 M NaCl under nitrogen gas. The available metal fraction was collected on Chelex-100 resin.
Testing the sediment re-suspension effects on trace metal solubility and transport
572 M. V. Ardelan and E. Steinnes: Mobility and solubility of the redox sensitive metals observed as a change in the turbidity. Despite the fact that
re-suspension time of sediment was short (each gas seepage was about 3 min a day), it was still necessary to de-couple the ef-fects of acidification and sediment re-suspension. Therefore, we applied an equal amount N2 seepage to induce similar re-suspension in the control chamber.
The flow rate of N2was adjusted to be equal to the flow rate of CO2 (0.045 L s−1 with 1.5 bar pressure). Hence the shear stress of the two gases could create a similar amount of resuspension.
In order to distinguish the effect of re-suspension from that of CO2, and from the combined effects of re-suspension and CO2on the solubility and transport of trace metals two dif-ferent sampling procedures were employed: on day 9 in the first experiment and on day 3 in the second, the sampling was performed when sediment suspension was still active in both the CO2and the control chambers. On the contrary, for the sampling on day 15 in the first experiment and on days 6 and 9 in the second experiment we waited 6 h in order to al-low settling of the re-suspended sediment after CO2and N2 seepage in CO2and control chambers, respectively.
2.2 Analyses
2.2.1 DGT extractions
The elution of metals from the Chelex 100 binding phase was carried out by immersion in 1.0 ml of 2.0 M HNO3 (Scan-pure, Chem. Scan AS) in a PE centrifuge tube for 24 h, at 60◦C with gentle agitation by a heater-shaker at 70 rpm
(Grant, OLS 200). The elution extracts were diluted with Milli-Q water (18.2 M, Millipore) to 10 ml prior to metal de-terminations. The mean flux of metal in the pore water at the surface of the device during its deployment was derived from the determined mass of metal in the DGT Chelex-100 layer. For the sediment DGT units, after discarding the membrane filter and diffusive gel, the resin gel was sliced at 3-cm inter-vals (each section being 5.4 cm2) using a Teflon-coated stain-less steel razor. Details of the methods and calculations of flux and time-average concentrations can be found in Garmo et al. (2003). All sample treatments and digestion of Chelex 100-gel layer from DGT units were done in a Class 100 trace metal clean laboratory.
2.2.2 ICPMS analysis
Trace metal determinations in total and filtered water sam-ples plus the eluted DGT fractions were carried out using HR-ICP-MS (Thermo Finnigan Element) as previously re-ported (Garmo et al., 2003). The accuracy of the determi-nations of total and dissolved fractions of metals were ver-ified by regular analysis of the standard reference materials CASS-4 (Nearshore Seawater Reference material for Trace Metals), NASS-5 (Seawater Reference material for Trace Metals), both supplied from National Research Council of
Canada, and a spike solution which was prepared in our lab-oratory (Table 1a). Precision (RSD) was determined from routine replicate analyses of standards and seawater samples (Table 1b). The blanks and detection limits of the measure-ments of dissolved fractions and DGT labile fractions are shown in Table 1. Details of DGT applications for trace metal determination in natural waters and sediments can be found elsewhere (Zhang et al., 1995, 2002; Harper et al., 1998; Davison et al., 2000; Munksgaard and Parry, 2003; Fones et al., 2004; Larner et al., 2006).
During the analysis by HR-ICP-MS, plasma and mass spectrometer parameters were optimized daily at medium resolution (r: 4000). The mass window was 100%. Further, the nebulizer gas flow optimization was performed daily. Flushing of the sampler probe and sample loop was done by 0.3 M ultra pure HNO3. The sample uptake rate to plasma was 0.25 mL min−1and the sample/peak ratio was 20. Each sample analysis used 0.8 ml sample and 1.2 ml washing acid. In order to lower the instrumental Fe blank values, 0.3 M ul-tra pure HNO3was run before sample measurements.
2.2.3 Sediment analysis
The readily oxidizable organic carbon content was deter-mined by the Walkey-Black method (Loring and Lantala, 1992). Briefly, about 0.5 gr dry sediment is oxidized with potassium dichromate and concentrated H2SO4. The excess dichromate is titrated with 0.5N ferrous ammonium sulfate solution. Oxidation of Cl−1can be prevented by the use of Ag2SO4in the digestion mixture.
A modified sequential extraction technique of the Bureau Communautaire de Refrence (BCR) (Usero et al., 1998) was applied to determine acid soluble, reducible, and residual Fe, Mn and Co in the sediment. About 0.5 g sediment were treated with 10 ml 0.11 M ultra pure acetic acid (Sigma) for 16 h to extract the easily soluble Fe, Mn and Co fractions (exchangeable ions and carbonates). After removal of the liquid fraction, the same sediment was dried at 70◦C and treated with 10 ml 0.1 M hydroxylamine (NH2OH HCI) and 0.01M ultra pure HNO3mixture to extract reducible fractions of metals (iron-manganese oxides). Finally, the sediment was treated with 7.7 M ultra pure HNO3 in an “easyClave” laboratory microwave reactor (MLS/Milestone) under 50 atm pressure and 240◦C to extract residual fractions of metals
from the sediment. All extraction solutions were diluted with Milli Q water (18.2 m) to appropriate levels before analysis by HR-ICP-MS.
2.3 DGT calculations
Calculations of time-averaged DGT-labile metal concentra-tions in water were undertaken using the equation
CDGT=
m·L
M. V. Ardelan and E. Steinnes: Mobility and solubility of the redox sensitive metals 573
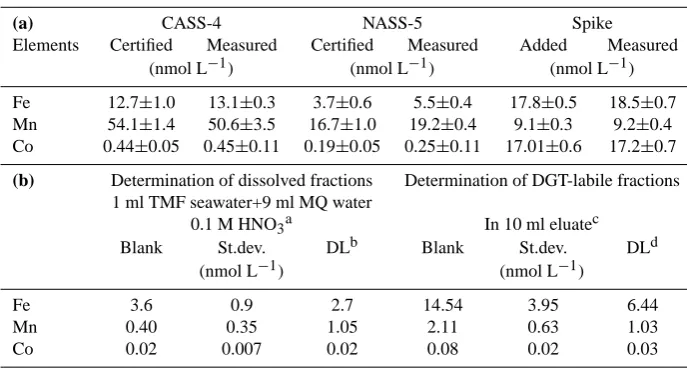
Table 1. (a) Accuracy and standard deviations of direct measurements of Fe, Mn and Co determination (by 10% dilution with Milli-Q water)
by HR-ICP-MS using CASS-4, NASS-5 (Nearshore Seawater Reference Material for Trace Metals and Seawater Reference Material for Trace Metals, respectively, from National Research Council of Canada) and spikes in synthetic seawater. (b) Blanks and detection limits of the methods for determination of dissolved and DGT-labile fractions of Fe, Mn and Co.
(a) CASS-4 NASS-5 Spike
Elements Certified Measured Certified Measured Added Measured (nmol L−1) (nmol L−1) (nmol L−1)
Fe 12.7±1.0 13.1±0.3 3.7±0.6 5.5±0.4 17.8±0.5 18.5±0.7 Mn 54.1±1.4 50.6±3.5 16.7±1.0 19.2±0.4 9.1±0.3 9.2±0.4 Co 0.44±0.05 0.45±0.11 0.19±0.05 0.25±0.11 17.01±0.6 17.2±0.7
(b) Determination of dissolved fractions Determination of DGT-labile fractions 1 ml TMF seawater+9 ml MQ water
0.1 M HNO3a In 10 ml eluatec
Blank St.dev. DLb Blank St.dev. DLd
(nmol L−1) (nmol L−1)
Fe 3.6 0.9 2.7 14.54 3.95 6.44
Mn 0.40 0.35 1.05 2.11 0.63 1.03
Co 0.02 0.007 0.02 0.08 0.02 0.03
aTrace metal free (TMF) seawater was prepared treating seawater with UVc and Chelex-100 resin. bDetection limit: 3 times standard deviation of the blank.
c10 ml eluate: unexposed Chelex-100 impregnated gel from both DGT units for water and sediments were eluted similarly as samples. dDetection limit of DGT methods are calculated by Eq. (1) based on 3 time standard deviation of the blanks and 2 day exposure time of DGT units.
See text for more explanation.
wheremis the mass collected by Chelex-100 in the DGT unit, L is the total thickness of the diffusion for both Fe and Mn and 3.44×10⁻⁶cm−2s−1for Co) were calculated by interpolation amongreported diffusion coefficients (Zhang, 2007).
The flux of DGT-labile metals in the sediment pore water was calculated by the equation
FDGT=
m
T·A (2)
where FDGT (nmol cm−2s−1) is the flux of metal through the active DGT surface into Chelex-100 layer andAis the cross sectional area of the DGT unit.
Some trace metals are apparently strongly bound to the sediment and may have a limited re-supply of DGT labile fraction from the solid phase to the pore water and to the surface of the DGT unit (Larner et al., 2006). Calculated concentrations based on accumulated elements in the DGT and its diffusion coefficients in the gel may thus not repre-sent the actual dissolved metal concentration in the sediment pore water because of the possible non-steady state concen-tration of the elements at the DGT surface. In this study we therefore decided to use the flux to the DGT unit rather than concentration in sediment pore water.
We follow the convention referring to the 0.2 µm filterable fraction of Fe, Mn and Co as “dissolved” metal (DMe), al-though it has been shown that the filtrate after membrane
filtration may contain a substantial fraction associated with colloidal material (Benes and Steinnes, 1974). In calculation of the concentrations of DGT-labile fractions of trace met-als on the basis of their “apparent” diffusion coefficient, it should taken into consideration that the diffusion coefficients of organic-metal complexes are about one or two orders of magnitude lower than the free metal ion diffusion coefficients in the gel under the same conditions (Zhang and Davison, 1999; Li et al., 2005). The metals in seawater which are strongly complexed with large organic ligands would be con-siderably underestimated the average diffusion coefficient in calculation of DGT-labile concentration. This is especially true for Fe, where 99% of DFe exist as complexes with or-ganic ligands in seawater (Rue and Bruland, 1995; Wu and Luther, 1995) and sediments pore water. Therefore we also presented the total accumulated mass of the metal in the DGT units in the figures together with the calculated time-averaged DGT labile concentrations.
2.4 pH, TIC, TAlk andpCO2
[image:5.595.124.468.117.301.2]574 M. V. Ardelan and E. Steinnes: Mobility and solubility of the redox sensitive metals
2 Ardelan & Steinnes, Fig. 2
Fig. 2.
Variation of pH (
a
and
b
), total inorganic carbon, TIC (
c
and
d
), and partial pressure/fugacity of
CO
2(
p
CO
2) (
e
and
f
) during both phases of the experiment in CO
2seepage (full triangles) and in the
control (open circles) chambers.
34
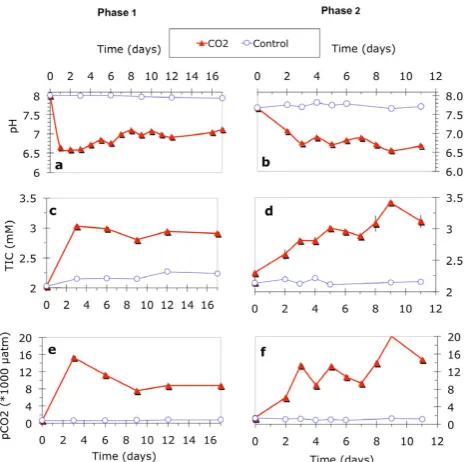
Fig. 2. Variation of pH (a and b), total inorganic carbon, TIC (c and
d), and partial pressure/fugacity of CO2(pCO2) (e and f) during
both phases of the experiment in CO2seepage (full triangles) and in the control (open circles) chambers.
at 6◦C. In order to convert the measured pH (pHNBS) to pHtotal, the apparent activity coefficient of H+(fH+) was de-termined by a four-point titration of 50 ml seawater using 15 ml standard acid with normality in the range of 0.008– 0.014 NHCl. The partial pressure/fugacity of CO2(pCO2) and TIC was calculated after the conversion of pHNBS to pHtotal( ¨Ozt¨urk et al., 2003). The maximum relative standard deviation of pH and TAlk measurements are about 0.5% and 3%, respectively, causing a maximum error of<10% in the
pCO2calculations.
3 Results and discussion
3.1 pH, TIC andpCO2
The fluctuations in pH, TIC, andpCO2in the two consecu-tive experiments are shown in Fig. 2. In the CO2 chamber, pH decreased from 7.9 and 7.7 to 6.6 and 7.0, respectively, at the beginning of the first and the second experiment, and fluc-tuated between 6.5 and 7.0 during the experiments (Fig. 2a and b). pCO2increased from about 620 to 15 000 µatm and from 1300 to 20 000 in the first and the second experiments, respectively (Fig. 2e and f). TAlk and TIC increased from about 2.1 and 2.0 to about 2.5 and 3.4, (Fig. 2c–f), respec-tively, in the two experiments, presumably due to dissolution of CaCO3in the sediment.
Ardelan & Steinnes
Fig. 3 Phase 1 Phase 2
285 912 463
23765 100 1 000 10 000 100 000 0 10 T o t. F e (n M ) Days a 6370 2020 3120 140 9380 7010. 15170 100 1 000 10 000 100 000
0 5 10
Days b 0 50 100 150 200
0 5 10 15
D. Fe (n M ) Days c 0 50 100 150 200
0 5 10
Days d 400 e 400 g ) f 5,9 251 0 100 200 300 0 500 1 000 9 Fe DG T (n M ) Fe DG T M a ss ( ng) Days e 0 100 200 300 0 500 1 000
2 4 6 9
Fe DG T (n M ) Fe DG T M a ss ( n g Days f 0 50 100 150
0 250 500
Dept
h (
mm)
FeDGTflux (fmol cm-2s-1) g
0 50 100 150
0 250 500 FeDGTflux (fmol cm-2s-1)
[image:6.595.51.287.61.292.2] [image:6.595.312.542.64.394.2]h
Fig. 3.
Concentrations of total acid-leachable Fe (TFe), dissolved Fe(DFe) and DGT labile Fe (Fe
DGT
)
in water during the first (
a
,
c
, and
e
) and second (
b
,
d
and
f
) phases of the experiment in CO
2
seepage
(full triangles) and in the control (open circles) chambers. Note that scales of TFe are logarithmic (a, b).
The amounts of Fe collected in the DGT units are shown by columns (e and f): light columns for control,
dark columns for CO
2
chamber. Flux of Fe
DGT
from the sediment into DGT units in the first (g) and
second (h) phases of the experiment in CO
2
(full triangles) and control chamber (open circles). The time
average flux of Fe
DGT
in the sediment, for CO
2
and control chambers were indicated by a broken line
and dotted line, respectively.
35
Fig. 3. Concentrations of total acid-leachable Fe (TFe), dissolved
Fe(DFe) and DGT labile Fe (FeDGT) in water during the first (a,
c, and e) and second (b, d and f) phases of the experiment in CO2
seepage (full triangles) and in the control (open circles) chambers. Note that scales of TFe are logarithmic (a, b). The amounts of Fe collected in the DGT units are shown by columns (e and f): light columns for control, dark columns for CO2chamber. Flux of FeDGTfrom the sediment and pore water into DGT units in dif-ferent sections of the sediment during the first (g) and second (h) phases of the experiment in CO2(full triangles) and control cham-bers (open circles). The average flux of FeDGTfrom sediment in the DGT unit, for CO2and control chambers were indicated by a broken line and dotted line, respectively.
3.2 Fe, Mn and Co
When CO2seepage was in effect, the distribution of Fe, Mn and Co in seawater was changed and these metals were mo-bilized and transported from the sediment to the overlying water both as dissolved (<0.2 µm) and suspended particulate forms of the metals (Figs. 3a–d, 4a–d, 5a–d).
M. V. Ardelan and E. Steinnes: Mobility and solubility of the redox sensitive metals 575
Ardelan & Steinnes
Fig. 4 Phase 1 Phase 2
23. 0 200 400 600 800
0 5 10
Days
b
50
44 11
2 103 1 870
1 10 100 1 000 10 000
0 5 10 15
T. M n ( n M ) Days a 36 24 7
1 930 1 807
1 10 100 1 000 10 000
0 5 10 15
D. Mn ( n M) Days c 14 0 200 400 600 800
0 5 10
Days d 15.6 348 0 100 200 300 0 500 1 000 1 500 9 Mn DG T (nM ) Mn DG T M a ss ( ng) Days e 0 100 200 300 0 500 1 000 1 500
2 4 6 9
Mn DG T (nM ) Mn DG T M a ss ( ng) Days f 0 50 100 150
0 100 200 300
MnDGT flux(fmol cm-2s-1)
h
0 50 100 150
0 100 200 300
Depth (m
m
)
MnDGTflux(fmol cm-2s-1)
[image:7.595.52.282.62.413.2]g
Fig. 4.
Concentrations of total acid-leachable Mn (TMn), dissolved Mn(DMn) and DGT labile Mn
(Mn
DGT
) in water during the first (
a
,
c
, and
e
) and second (
b
,
d
and
f
) phases in CO
2
seepage (full
triangles) and in the control (open circles) chambers. Note that scales of TMn and DMn in the first phase
of the experiment (a and b) are logarithmic. The amounts of Mn collected in the DGT units are shown by
columns (e and f): light columns for control, dark columns for CO
2
chambers.Flux of Mn
DGT
from the
sediment into DGT units in the first
(g)
and second
(h)
phases of the experiment are shown in CO
2
(full
triangles) and control chamber (open circles). The time average flux of Mn
DGT
in the sediment, for CO
2
and control chambers were indicated by a broken line and dotted line, respectively.
36
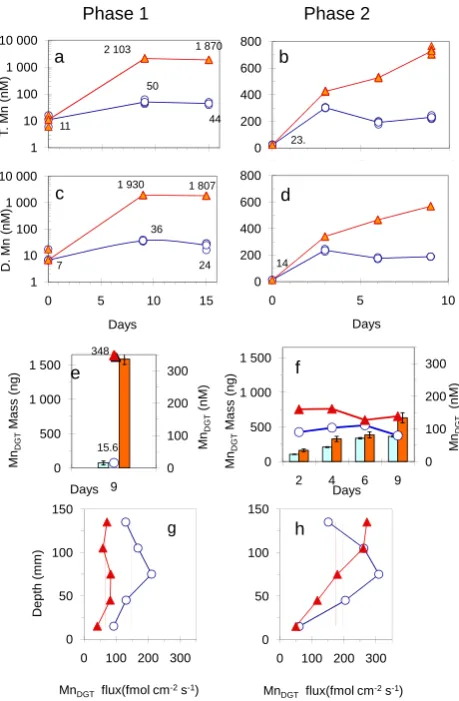
Fig. 4. Concentrations of total acid-leachable Mn (TMn), dissolved
Mn (DMn) and DGT labile Mn (MnDGT) in water during the first (a,
c, and e) and second (b, d and f) phases in CO2seepage (full
trian-gles) and in the control (open circles) chambers. Note that scales of TMn and DMn in the first phase of the experiment (a and b) are log-arithmic. The amounts of Mn collected in the DGT units are shown by columns (e and f): light columns for control, dark columns for CO2chambers. Flux of MnDGTfrom the sediment and pore water into DGT units in the first (g) and second (h) phases of the experi-ment are shown in CO2(full triangles) and control chamber (open circles). The average flux of MnDGTin the sediment, for CO2and control chambers were indicated by a broken line and dotted line, respectively.
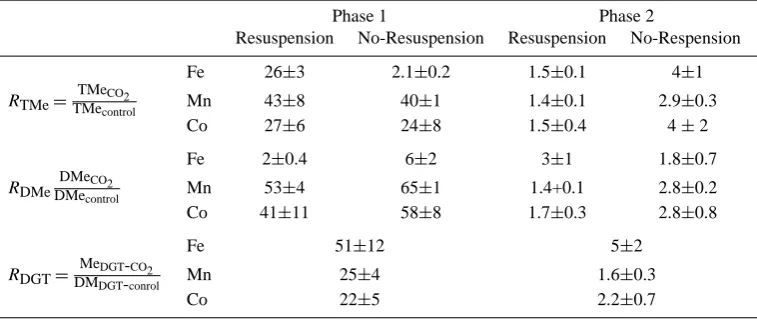
leachable, dissolved, and DGT labile fractions in seawater in the CO2chamber to the corresponding concentrations in the control chamber (RTMe,RDMe andRDGT) were calculated, respectively (see Table 3).
Sediment analyses show similar characteristics of the sed-iments used in both chambers (Table 4). Regarding CaCO3, water and organic matter contents, sediments in both cham-bers were nearly similar. Trace metal contents showed some variations. While easily soluble fractions of Fe in the sed-iment increased in both chambers, easily reducible fraction
Ardelan & Steinnes
Fig. 5 Phase 1 Phase 2
0 5 10 15 20
0 5 10
Days b
0,28 0,63 0,34
0 5 10 15 20
0 5 10 15
T. C o ( n M ) Days a 0 2 4 6 8 10
0 Days5 10
d 0,12 0,13 0,10 0 2 4 6 8 10
0 5 10 15
D. Co (n M ) Days c 2.5 2 12
) e )12 f 2
0.1 0 1 2 0 4 8 12 9 Co DG T (nM ) Co DG T M a ss (n g Days 0 1 2 0 4 8
2 4 6 9
Co DG T (nM ) Co DG T M a ss (n g Days 0 50 100 150
0 400 800
CoDGTflux (fmol cm-2s-1)
h
0 50 100 150
0 400 800
Dept
h (m
m
)
CoDGT flux (fmol cm-2s-1)
[image:7.595.314.542.64.397.2]g
Fig. 5.
Concentrations of total acid-leachable Co (TCo), dissolved Co(DCo) and DGT labile Co (Co
DGT
)
in water during the first (
a
,
c
, and
e
) and second (
b
,
d
and
f
) phases of the experiment in CO
2
seepage
(full triangles) and in the control (open circles) chambers. The amounts of Co collected in the DGT units
are shown by columns (e and f): light columns for control, dark columns for CO
2
chambers. Flux of
Co
DGT
from the sediment into DGT units in the first
(g)
and second
(h)
phases of the experiment are
shown in CO2 (full triangles) and control chamber (open circles). The time average flux of Co
DGT
in the
sediment, for CO
2
and control chambers were indicated by a broken line and dotted line, respectively.
37
Fig. 5. Concentrations of total acid-leachable Co (TCo), dissolved
Co(DCo) and DGT labile Co (CoDGT) in water during the first (a, c, and e) and second (b, d and f) phases of the experiment in CO2seepage (full triangles) and in the control (open circles) cham-bers. The amounts of Co collected in the DGT units are shown by columns (e and f): light columns for control, dark columns for CO2 chambers. Flux of CoDGTfrom the sediment and pore water into DGT units in the first (g) and second (h) phases of the experiment are shown in CO2(full triangles) and control chamber (open cir-cles). The average flux of CoDGT in the sediment, for CO2 and control chambers were indicated by a broken line and dotted line, respectively.
576 M. V. Ardelan and E. Steinnes: Mobility and solubility of the redox sensitive metals
Table 2. The proportion of dissolved fractions of Fe, Mn and Co in the total acid-leachable metals.
DMe % of TMe
Phase 1 Phase 2
Control CO2 Control CO2
Resusp. No-resp Resusp. No-resp Resusp No-resp Resusp No-resp
Fe 8±3 3.4±0.5 0.6±0.1 10±3 0.7±0.3 3±1 1.2±0.1 1.4±0.6 Mn 75±18 58±4 92±2 92±2 78±5 86±9 80±2 84±3 Co 37±11 38±9 50±1 90±2 23±7 36±10 27±1 30±13
Table 3. RDTe, RDMe andRDGT represent the ratios of concentrations of total acid leachable (TMe), dissolved (DMe) and DGT labile
(MeDGT)fractions in seawater in the CO2chamber to the corresponding concentrations in the control chambers, respectively.
Phase 1 Phase 2
Resuspension No-Resuspension Resuspension No-Respension
Fe 26±3 2.1±0.2 1.5±0.1 4±1
RTMe= TMeCO2
TMecontrol Mn 43±8 40±1 1.4±0.1 2.9±0.3
Co 27±6 24±8 1.5±0.4 4±2
Fe 2±0.4 6±2 3±1 1.8±0.7
RDMe DMeCO2
DMecontrol Mn 53±4 65±1 1.4+0.1 2.8±0.2
Co 41±11 58±8 1.7±0.3 2.8±0.8
Fe 51±12 5±2
RDGT=
MeDGT-CO2
DMDGT-conrol Mn 25±4 1.6±0.3
Co 22±5 2.2±0.7
profiles of various fractions of metals in the sediment. This however was beyond the objective of the present study.
Uncertainties in the results of Mn and Co determination in the sediment are not as high as Fe but still considerable (Table 4). The contrast between Fe and Mn fractionations in the sediment is apparent; while only easily reducible Fe frac-tion decreased in the sediment during CO2seepage both the easily reducible fractions and the easily exchangeable frac-tions of Mn were effectively decreased in the sediment under CO2seepage (Table 4). This preliminary sediment analysis suggests that Mn mobility increases as a product of both the reducing redox potential and via CO2 acidifications. Eas-ily exchangeable and total residual fractions of Co also show considerable decreases in the surface sediment of the CO2 chamber (Table 4). In general, metal values in the sediment clearly suggest that a more detailed study with higher resolu-tion is necessary to understand intra-sedimental changes and to fully de-couple the effects of CO2seepage, redox changes and re-suspension of sediment.
3.2.1 Fe
TFe and DFe
During the experiments, most of the mobilized Fe was in to-tal acid-leachable forms (TFe, in the non-filtered seawater samples at pH: 1) (Fig. 3a, b) in both chambers. In the first phase of the experiment in addition to CO2acidification, sed-iment re-suspension contributed to the increase in TFe con-centrations in seawater (Fig. 3a).
The proportion of dissolved Fe (DFe) in the CO2 cham-ber was lower (0.6±0.1% of TFe) than that of in the control (8±3% of TFe, Table 2) when the re-suspension was in effect on day 9 during the first experiment. RTFe (=TFeCO2/TFecontrol) reached values up to 26 (Table 3)
[image:8.595.109.488.247.407.2]M. V. Ardelan and E. Steinnes: Mobility and solubility of the redox sensitive metals 577
Table 4. Type of sediment used in the experiment. 4 replicates were analyzed from 10 cm homogenized surface sediment. (a) % CaCO3,
water and organic matter contents of sediments. (b) various fractions of Fe, Mn and Co in the sediments before and after the completion experiment. “Initial” and “final” denotes the analysis of sediment before the start of experiment start and after finish of the second phase of experiment, respectively.
Control Chamber CO2Chamber
% CaCO3 4.6±0.7 4.5±0.3
% Water Contenta 6.5±1.6 6.6±0.9
% Organic Matter 1.31±0.06 1.26±0.12
Initial Final Initial Final
Fe-Ab(µg g−1) 522±20 690±50 496±33 662±41 Fe-Hc(µg g−1) 1495±40 1430±6 1622±27 1529±90 Fe-Rd% 3.2±0.3 3.4±0.3 3.4±0.2 3.3±0.2 Mn-Ab(µg g−1) 97±16 103±23 102±11 67±7 Mn-Hc(µg g−1) 36±2 33±3 37±2 31±3 Mn-Rd(µg g−1) 370±40 405±32 418±16 375±20 Co-Ab(µg g−1) 1.15±0.1 1.23±0.05 1.14±0.12 1.0±0.08 Co-Hc(µg g−1) 1.4±0.1 1.4±0.1 1.5±0.2 1.5±0.10 Co-Rd(µg g−1) 12.2±1.2 13.5±1.2 13.7±0.9 12.8±1.0
aSediment was dried at 70◦
C, 40 h in order to retaining the clay mineral structure.
bMe-A indicates easily exchangeable fraction of metals in the sediment extracted by 0.11 M UP acetic acid. cMe-H indicates easily reducible fractions of metals extracted with 0.1 M hydroxylamine and 0.01 M UP HNO
3mixture. dMe-R indicates the residual fractions of metals extracted with 7.7 M UP HNO
3. For total digestion of sediment with HNO3Certified soil GBV-07408 was used to assess the accuracy. Recovery of the method was found to be 88% and 85% for Mn and Co. Fe does not have a certified value.
reason for the high TFe concentration and low proportion of DFe in the CO2 chamber compared to the control. There may also be some fractionation or transfer of iron from the larger and settled particles to the smaller and easily-suspended particles due to CO2 seepage. This suspended particulate fraction may also contain some Fe forms that can easily dissociate and diffuse into DGT units (see below). The distinct enhancement of the leachable particulate Fe was also reported in various coastal waters where sediment re-suspension into the water column occurs (Obata et al., 2007). Dissolved fractions of the trace metals in the water may not be influenced as significantly as the acid-leachable particu-late metal fractions by re-suspension (Van den Berg, 2001). However, the proportion of DFe was higher (10%) in the CO2 chamber than that of the control (3.4% of TFe) when there was no significant re-suspension of sediment (Table 2). When re-suspension was not in effect, most of the previously suspended particles rapidly re-settled back to the sediment and, due to enhancement of solubility of particulate iron in the relatively acidic condition under CO2seepage, consider-able Fe dissolved or desorbed from suspended matter may remain in the water. The ratios of DFe in the CO2chamber to DFe in the control (RDFe=DFeCO2/DFecontrol, see Table 3) also indicate significant increases in DFe (2 to 6 times,
Ta-ble 3) under CO2seepage relative to the control. In the first phase of the experiment, the re-suspension produced an extra increase in DFe in the control chamber (Fig. 3c and Table 2), thereforeRDFewith re-suspension was lower thanRDFe with-out re-suspension (Table 3).
One of the distinct differences between the first and the second phases of the experiment in the control chamber was a sharp increase in TFe in the overlying water in the sec-ond phase (day 3 Fig. 3b). Apparently the progressing sub-oxic/anoxic condition in the sediment and the sediment re-suspension together led to the increase in TFe in the over-lying water in the control chamber. In the second phase the differences in the proportion of DFe between CO2and con-trol chambers were small compared to the corresponding dur-ing the first phase of the experiment (Table 2). When the CO2seepage experiment was continued with the same sed-iment but replenished seawater (the second phase), the re-suspension in the CO2chamber did not seem to contribute too much to the enhancement of the TFe (see Fig. 3b and
578 M. V. Ardelan and E. Steinnes: Mobility and solubility of the redox sensitive metals condition in the sediment. High TFe in both control and CO2
chambers can be explained by re-precipitation of upward mi-grated reduced and dissolved Fe from the pore water into the oxic overlying water as suspended authigenic Fe oxy-hydroxides colloids ( ¨Ozt¨urk, 1995). Acidification may have additional effects to keep these colloids longer in the overly-ing water by hinderoverly-ing further coagulation and removal from water column in the CO2 chamber. However, considerably higherRDFe(3±1) during the re-suspension (Table 3) indi-cated that CO2 acidification together with increased anoxia in the sediment and re-suspension were able to extract more dissolved Fe in the overlying water.
FeDGT
Time-averaged FeDGT concentrations were about 250 and 375 nM during the first and the second phases of the exper-iment, respectively, which are significantly higher than DFe (Fig. 3c–f) under CO2seepage. When FeDGT is higher than DFe it indicates that a significant proportion of particulate Fe (>0.2 µm) consists of forms that are easily dissociable at the surface of DGT units, and hence were DGT labile under CO2seepage. It is important to keep in mind that the DGT labile fraction depends on change in the transformation ki-netics of various forms of the metals during the course of the deployment, while the measured dissolved fractions, on the other hand, represent a snap-shot of the situation. Therefore, comparison of the concentration of the dissolved fraction of metal with time-average DGT labile fractions should be done with caution.
FeDGT was relatively low (about 6 nM) during the first phase in the control; however, FeDGTin the control increased to a level of 175–100 nM during the second phase. The de-velopment of sub-oxic/anoxic conditions in the sediment and enhancement of easily dissociable TFe may have caused the increase in FeDGT in the control during the second experi-ment. The high values of the ratios of FeDGT in the CO2 chamber to the FeDGTin the control (RFe-DGT) (>50, in the first phase and about 5 in the second phase of the experiment, Table 3) indicate that CO2 seepage effectively produces a large amount of DGT-labile Fe. With the continuation of CO2 seepage, the increase in FeDGT seemed to be reduced almost 10 times, though it was still considerably high (Ta-ble 3). This reduction inRFe-DGTwas simply due to the rel-ative increases in the enhancement of FeDGT in the control probably due to the changing redox condition in the sediment as explained above.
Our results indicate that not only the dissolved fraction but also the total suspended concentration is important in order to elaborate the metal solubilization and bioavailabilty under CO2seepage. Based on these facts, the results of FeDGT pro-vide not only information on the time-averaged concentration of existing DGT labile iron in the studied environment, but also on the transformation kinetics of non-bioavailable forms of the metal into bioavailable fractions. Therefore, the DGT
technique is quite suitable for speciation of trace metals es-pecially at dynamic conditions (Ryan et al., 2005). These kinds of information are especially relevant for Fe which is the prime metal in controlling biological productivity (Boyd et al., 2007) in almost 30% of the world’s oceans.
3.2.2 Mn
TMn and DMn
TMn increased in both phases of the experiment under CO2 seepage. It was about 2000 nM (Fig. 4a) in the first phase and ranged between 400–750 nM (Fig. 4b) in the second phase of the experiment during CO2seepage. TMn in the control ranged between 11 and 50 nM during the first phase and in-creased to a value around 200 nM (Fig. 4a, b) in the second phase of the experiment.
Most of the mobilized Mn appeared to be in the dissolved fraction both in the CO2and the control chambers (Fig. 4b and d, and Table 2). In the CO2chamber, the DMn propor-tion was 92% of TMn with and without re-suspension. It is apparent that re-suspension of sediment did not affect the DMn proportion during the early phase of CO2seepage (Ta-ble 2). In the control, however, the proportion of DMn was 75% (with re-suspension) and 58% of TMn (no suspension). In the second phase of the experiment, there was also no ap-parent effect of resuspension on the mobility and solubility of Mn in the CO2chamber (Fig. 4b and d), and the propor-tions of DMn were around 80% of TMn in both the CO2and control chambers (Table 2).
The increase in DMn in the seawater suggests that Mn is effectively mobilized from the sediment and transported to the overlying water in the early phase of CO2 seepage. Most of the re-suspended Mn particles were dissolved very quickly by CO2seepage. Our results indicate that the effect of CO2on the dissolution of Mn oxyhydroxides was much greater than on the dissolution of Fe oxyhydroxide. The de-velopment of sub-oxic/anoxic conditions due to removal of dissolved oxygen from sediment and water by gas seepage may contribute to the enhancement of Mn solubility both in the CO2and the control chambers. Especially in the second phase of the experiment, a possible intensification of sub-oxic/anoxic conditions in the sediment might contribute to the increase in TMn and DMn in the control (Fig. 4b and d) like it was for Fe.
M. V. Ardelan and E. Steinnes: Mobility and solubility of the redox sensitive metals 579
MnDGT
MnDGT increased strongly during the first phase of the CO2 seepage (Fig. 4e). However, during continuation of CO2 seepage the further increase in MnDGT was moderate com-pared to the increase in FeDGT(Figs. 4f and 3f). During the second phase there was a decrease in the enhancement of MnDGTin the CO2chamber and a relative increase in MnDGT in the control (see Fig. 4e and f). Therefore a sharp decrease in RMn-DGT (Table 3) was observed in the second phase. As explained above the development of the sub-oxic/anoxic condition in the sediment may also have caused the increase in MnDGT in the control, like in the case of DMn. Most of the increased fraction of easily mobilized and dissolved Mn due to acidification by CO2or by redox change does not ap-pears to be DGT labile either in the sediment or in the water column (Fig. 4c–f). Despite very high DMn, the relatively low proportion of MnDGT under CO2seepage might be due to the stable colloidal character of the mobilized DMn. Con-sidering the pore opening of the gel in the DGT units and the possibility of slow dissociation of colloidal Mn, DGT may not capture mobilized Mn.
3.2.3 Co
TCo and DCo
The increases in TCo and DCo were significant (RTCo: 24– 27,RDCo: 41–58, see Table 3) during the first phase of CO2 seepage and considerably lower (RTCo: 1.5–4, RDCo: 1.7– 2.8, Table 3) in the second phase (see also Fig. 5a–d). In the CO2chamber, re-suspension may have caused an additional TCo increase, which was detected as a peak on day 9 in the first phase (Fig. 5a). Re-suspension of sediment did not cre-ate any enhancement in the TCo or DCo concentrations in the control during the first phase (Fig. 5a and c). Considering the DCo proportions in the water, which were about 50% (with re-suspension) and 90% of TCo (no suspension) in the first phase of CO2 seepage compared to 37–38% of TCo in the control (Table 2), it is clear that although the re-suspension of sediment under CO2seepage may have contributed to a minor increase of TCo in the water, it did not contribute to an additional release of DCo. On the contrary,RDCo ratios (Table 3) indicate that some portion of DCo was probably removed by adsorption on the enhanced particles during re-suspension.
In the second phase of the experiment, the increase in TCo and DCo was moderate (Fig. 5b and d) and the difference between the proportions of DCo in the CO2chamber and in the control was minimal (Table 2), similar to that of Mn (see Table 3) in the second phase. TheRTCoandRDCoratios also decreased considerably, as in Mn, due to i) the decrease in the enhancement of dissolution of Co by CO2seepage and, ii) the increase in both TCo and DCo in the control due to the
development of sub-oxic/anoxic conditions in the sediment with the elongation of the seepage.
CoDGT
CoDGT also increased strongly in the first phase of the CO2 seepage (Fig. 5e). However, during continuation of CO2 seepage a further increase in CoDGTwas moderate as it was for MnDGTwhile the increase in FeDGTwas still considerable (Figs. 3f, 4f and 5f). The ratios of CoDGT in the CO2 cham-ber to CoDGT in the control (RCo-DGT) were about 22 and 2.2 in the first and the second phases, respectively (Table 3). This was in accordance with the corresponding decreases in theRTCoandRDCoratios (Table 3).
The patterns of change and distribution of TCo, DCo and CoDGT (and R ratios) were almost similar to those of the TMn, DMn and MnDGT during the experiment. Co chem-istry in seawater is strongly connected to Mn and partially to Fe ( ¨Ozt¨urk, 1995). When Mn oxyhydroxides dissolved by acidification or anoxic conditions, previously adsorbed Co on the particulate Mn is released ( ¨Ozt¨urk, 1995). When the re-duced Fe, Mn and released Co were transported upward from the suboxic/anoxic zones of the sediment into oxic overly-ing water, Fe(II) would be oxidized first. The formation of particulate Fe with oxidation of Fe(II) in the seawater may behave as a scavenging mechanism for some portion of DCo and hence we observed some decrease in DCo compared to DMn. The similarity between the distribution of TCo and TFe in the second phase of the experiment and the relatively low proportion of DCo in the total acid-leachable Co com-pared to the proportion of DMn in TMn (Table 2) supports this argument. Another difference between the Co and Mn distribution was the relatively high proportion of CoDGT in the DCo (about 29±1 and 52±11% of DCo were CoDGT in the first and second phase of the experiment, respectively) compared to the proportion of MnDGT in the DMn (about 19±1 and 35±10% of DMn were MnDGT in the first and second phases of the experiment, respectively) in the CO2 chamber. The reasons why Co has a higher DGT labile por-tion in the DCo compared to the proporpor-tion of MnDGT in DMn are probably; i) the Co affinity to Chelex-100 that is much higher than that of Mn at the low pH and, ii) DCo con-sists of more easily diffusible forms than DMn under CO2 seepage.
3.2.4 DGT-labile fractions of Fe, Mn and Co in the sediment pore water
The DGT sediment probe detected only the flux of the DGT labile fractions of released metal that diffused from the sed-iment into the sedsed-iment DGT probe and was collected there by Chelex-100. It does not give direct information about the flux of metal from sediment into the overlying water.
580 M. V. Ardelan and E. Steinnes: Mobility and solubility of the redox sensitive metals the DGT unit is fast in comparison to the actual diffusion
and capturing rate in the DGT units, meaning that the con-centration of all DGT labile metal species is approximately the same in the bulk medium and at the DGT unit surface. However, this assumption cannot be true in the sediment pore water. The relationship between metal concentrations in the bulk of pore water to the concentration at the surface of the DGT unit depends upon the supply of metal from the solid phase to the solution (Fones et al., 2004) and the capture of DGT labile metals by Chelex-100 depends on the dissocia-tion kinetics of the metal species at the surface. Therefore, in the sediment, DGT does not directly measure the concen-trations of metals in bulk pore water, but rather the time av-eraged concentration at the surface of the DGT unit during deployment (Fones et al., 2004). Therefore, we quantify the flux of DGT labile metal fractions rather than calculating the time average bulk concentration of the studied metals in the pore water.
In the sediment pore water the fluxes of FeDGTand CoDGT increased significantly during the first phase of CO2seepage. In the second phase of CO2seepage, however, the fluxes of FeDGTand CoDGTwere generally higher in the control treat-ment except in the deepest layer of the seditreat-ment. The sit-uation with MnDGT was completely opposite to that in the water; the MnDGT flux in sediment pore water was much higher in the control than in the CO2chamber (Fig. 4g and h) in both phases of the experiment. Rapid dissolution of Mn from sediment due to the redox condition and its consecu-tive rapid transport from sediment to the overlying water due to CO2 seepage were probably the reasons for the low Mn flux into the DGT (MnDGT flux) units in the CO2 chamber compared to the flux of Mn in the control chamber in the sediment. Because of the experimental setup, sub-oxic con-ditions might be enhanced in the sediment due to decreased oxygen penetration in the chambers and stripping the existed O2by CO2and N2. When the sub-oxic condition prevails in the sediment or in the water column, Mn-hydroxide particles are very rapidly reduced to soluble Mn(II) ( ¨Ozt¨urk, 1995; Morford and Emerson, 1999). The enhanced flux of Mn into DGT units in the sediment of the control chamber (Fig. 4h) was a clear indication of a sub-oxic and weakly anoxic condi-tion at 6–9 cm depth in both experiments. A sudden decrease in pH due to CO2 seepage might quickly mobilize the re-duced Mn from the sediment to the overlying water. Under this condition there would not be as much DGT labile Mn as in the control, because most of the easily reducible Mn (the probable reservoir of the DGT labile Mn) had already been removed from the sediment into the overlying water due to CO2acidification and seepage.
Considerable decreases in the easily exchangeable fraction of Mn (Mn-A) in the sediment of CO2 chamber (Table 3) compare to almost constant Mn-A in the control also support the effective mobilization of Mn from sediment in the CO2 chamber into the overlying water. Our results suggest that reduced and dissolved Mn in the sub-oxic or weakly anoxic
sediment in the control chamber stayed in the sediment pore water and diffused into the DGT units in the sediment rather than to the overlying water. In the control chamber with pH>7.8, a portion of Mn transported into the overlying water due to the sub-oxic/anoxic condition might be precipitated together with Fe oxyhydroxide, on the surface of colloidal iron oxides that formed when the added Fe(II) was oxidized to Fe(III) (Nico et al., 2002). Although this precipitation ap-peared to be minor due to slow oxidation kinetics of Mn(II) compared to the rapid Fe(II) oxidation and precipitation, it was sufficient to hinder the buildup of DMn and MnDGT in the seawater overlying the sub-oxic sediment (Fig. 4g) in the control chamber especially during the second phase of the experiment. These mechanisms may explain why there was no corresponding increase in DMn and MnDGTin the overly-ing water in the control chamber while there was a substantial increase in MnDGTin the sediment pore water.
The maxima in CoDGT were coincident with the MnDGT flux maxima observed in the sediment in the 6–9 cm zones in both experiments (Fig. 4g and h). This was an additional indication of the sub-oxic conditions. It is known that at the redox boundary between oxic-anoxic zones, dissolved Mn and Co increase sharply in sub-oxic/anoxic water and sed-iments, due to reductive dissolution of manganese oxyhy-droxides and subsequent release of Co adsorbed onto Mn-oxyhydoroxides ( ¨Ozt¨urk, 1995; Fones et al., 2004). The in-crease in DGT labile Mn at that depth apparently also caused a vertical transport of Mn(II).
In the first phase the flux of FeDGTwas significantly higher in the sediment of the CO2 chamber than in the control (Fig. 3g). The highly pronounced peak at 6–12 cm depth corresponds to sub-oxic/anoxic conditions. The results of the second phase of the experiment indicate that almost all FeDGTwas extracted in the section of 6–12 cm (Fig. 3h) dur-ing the early phase of CO2seepage. This easy removal of Fe from the sediment, like it was Mn, supports the possibility of an early anoxia at that zone during the first phase of the experiment. Elongated CO2seepage started to extract more FeDGTfrom the bottom section of the sediment (12–15 cm). Coincident enhancements of MnDGTand CoDGTwith FeDGT at the 12–15 cm section might be an indication that anoxia started to develop in that part of the sediment in the CO2 chamber during the second phase.
M. V. Ardelan and E. Steinnes: Mobility and solubility of the redox sensitive metals 581 during CO2 seepage is also somehow connected to Fe
re-mobilization. Apparently mobilization of Zn, and Ni, as in the case of Co, was also due to reductive dissolution of man-ganese oxyhydroxides in sub-oxic or weakly anoxic zones ( ¨Ozt¨urk, 1995; Davison et al., 1997; Fones et al., 2004) in the control chamber. However, the coupling of Zn and Ni dissolution with redox cycling of Mn was not as strong as of Co, as also reported by Fones et al. (2004). In the CO2 chamber, besides the possible contributive effects of reduc-tive solubility, the Co, Ni and Zn released and their correla-tion with Fe-oxyhydroxide dissolucorrela-tion was probably mainly induced by pH changes associated with CO2seepage.
3.2.5 DGT-labile fractions of trace metals
The fraction of a metal present as free cation or bound in la-bile complexes are likely to be in the DGT-lala-bile fraction in seawater, given that the metal has affinity to the Chelex-100 resin. These fractions of metals may be also most bioavail-able forms of metlas for biological organisms. The captur-ing of DGT-labile metals by Chlex-100 depends on the dis-sociation kinetics of the metal species at the surface. The metals in seawater that are strongly complexed with large or-ganic ligands (such as Fe) would be considerably underesti-mated by using average diffusion coefficient for calculation of DGT-labile concentration due to the diffusion coefficients of organic-metal complexes are about one or two orders of magnitude lower than the free metal ion diffusion coefficients in the gel under the same conditions (Zhang and Davison, 1999; Li et al., 2005). However, during the CO2seepage, the dissociation ability of some organic-metal complexes (both soluble and solid surfacemetal complexes) and their dissoci-ation kinetics may be changed. Our results indicate that it is likely some organically complexed and particulate-bound metal, such as Fe, is rapidly dissociated by CO2seepage and subsequently able to diffuse through the gel and be collected by the DGT chelating resin. Therefore, not only dissolved fractions but also total suspended metal concentrations are important to elaborate the real metal mobilization under CO2 seepage. On the other hand, if the metal ions are present as inert complexes they will not be released and subsequently will be bound to Chelex-100. Based on these facts, the re-sults of DGT-labile fractions in the present work potentially did not only give information about the time average con-centration of existing DGT-labile metals in the studied envi-ronment but also on kinetics of the transformation of possible non-bioavailable forms of metal into easily bioavailable frac-tions.
4 Conclusions
The acidification of sediment and seawater by CO2seepage caused sharp pH decreases (from about 8 to 6.5) despite the buffering effect of dissolution in the sediment. Consequently,
the CO2seepage dissolved metals in the sediment and sus-pended particles in the seawater and also mobilized Fe, Mn and Co. The CO2seepage continued to mobilize the studied metals during the second phase of the experiment, albeit to a lesser extent. Our results indicate that, as CO2seepage ini-tially leads to an enhanced release of Fe, Mn, and Co from sediment. As CO2 seepage continues the extent of this re-lease decline.
CO2seepage caused a significant increase in the total and dissolved Fe, Mn and Co concentrations (30, 40, 50 times for the total and 20, 30, 40 times for the dissolved fractions, respectively) during the early phase. With the continuation of CO2seepage, these enhancements of the metal concen-trations in seawater decreased due to effective extraction of the easily leachable metal fractions from the sediment and suspended particles during the early phase of the seepage.
Comparison of DGT labile fractions of Fe, Mn, and Co (FeDGT, MnDGT and CoDGT) in the CO2 and the control chambers indicates that especially during the early phase of CO2seepage, large amounts of DGT labile Fe, Mn and Co were mobilized. MnDGT, CoDGTand especially FeDGT, con-tinued to increase significantly in the prolonged CO2seepage compared to the DGT labile concentrations in the control chamber. Smaller enhancement of dissolved and DGT la-bile fractions of Fe, Mn, and Co with the elongation of CO2 seepage indicate that the easily soluble portions of the Fe, Mn and Co were quickly dissolved and mobilized during the early phase of CO2seepage.
The sediment re-suspension due to gas seepage contributes to the mobilization of suspended particulate and dissolved forms of Fe and to some extent of Co but not of Mn. Ad-ditionally, the removal of dissolved oxygen in sediment pore water by seepage of CO2 augments suboxic/anoxic condi-tions and hence contribute to the reductive dissolution of Mn, Fe and Co in both the control and CO2 chambers. A more detailed interpretation of the effects of CO2seepage on trace metal transformation and remobilization would be possible with more information on metal speciation.
582 M. V. Ardelan and E. Steinnes: Mobility and solubility of the redox sensitive metals 2006). Disturbed Fe-Mn shuttle mechanisms will cause
en-hanced concentrations of toxic heavy metals and trace ele-ments in the seawater. Natural bacterial stratification may have also been affected due to disturbed Fe-Mn shuttles. In any case, the effects of CO2seepage on redox chemistry in marine sediments and bottom waters are profound and bio-geochemical implications thereof may cascade through mi-crobial life far into benthic and deep-water ecosystems.
Any changes in the processes taking place in the upper section of marine sediments have a intense effect on the local and global cycling of many elements. CO2 leakage and acidification can significantly alter these biogeochemi-cal processes occurring in surficial marine sediment and may have profound impact on bacterial processes and other bio-logical activities in surface sediment. Especially coastal sed-iments subjected to elevated anthropogenic inputs of certain toxic metals (Burdige, 2006), after CO2 leakage and acidi-fication sediment will be source for some toxic metals after CO2 leakage. There is a potential that these contaminants may be taken up in the food chain.
Acknowledgements. This work has been supported by VISTA grant
(Project No. 6149). The authors wish to thank S. Lierhagen for performing the HR-ICP-MS analyses and Ø. Garmo for valuable discussion on DGT techniques.
Edited by: S. Pantoja
References
Aiuppa, A., Allard, P., D’Alessandro, W., Michel, A., Parello, F., Treuil, M., and Valenza, M.: Mobility and fluxes of major, minor and trace metals during basalt weathering and groundwater trans-port at Mt. Etna volcano (Sicily), Geochim. Cosmochim. Ac., 64, 1827–1841, 2000.
Ardelan, M. V., Steinnes, E., Lierhagen, S., and Linde, S.: Effects of experimental CO2leakage on solubility and transport of seven trace metals in seawater and sediment, Sci. Total Environ, 407, 6255–6266, 2009.
Barry, J., Buck, K. R., Lovera, C. F., Kuhnz, L., Whaling, P. J., Peltzer, E. T., Walz, P., and Brewer, P. G.: Effects of direct ocean CO2 injection on deep-sea meiofauna, J. Oceanogr., 60, 759– 766, 2004.
Boyd, P. W., Jickells, T., Law, C. S., Blain, S., Boyle, E. A., Bues-seler, K. O., Coale, K. H., Cullen, J. J., de Baar, H. J. W., Follows, M., Harvey, M. C., Lancelot, C., Levasseur, M., Pollard, R. T., Rivkin, R. B., Sarmiento, J. L., Schoemann, V., Smetacek, V., Takeda, S., Tsuda, A., Turner, S., and Watson, A. J.: Mesoscale iron enrichment experiments 1993–2005: synthesis and future directions, Science, 315, 612–617, 2007.
Benes, P. and Steinnes, E.: In situ dialysis for determination of the state of trace elements in natural waters, Water Res., 8, 947–953, 1974.
Burdige, D. J.: Geochemistry of Marine Sediments, Princeton Univ. Press, 630 pp., 2006.
Coffin, R. B., Montgomery, M. T., Boyd, T. J., and Masutani, S. M.: Influence of ocean CO2sequestration on bacterial production, Energy, 29, 1511–1520, 2004.
Davison, W., Fones, G. R, and Grime, G. W.: Dissolved metals in surface sediment and a microbial mat at 100-µ m resolution, Nature, 387, 885–888, 1997.
Davison, W., Fones, G. R., Harper, M. P., Teasdale, P., and Zhang, H.: Dialysis, DET and DGT, in situ diffusional techniques for studying water, sediments and soils, in: situ monitoring of aquatic systems: Chemical analysis and speciation, edited by: Buffle, J. and Horvai, G., 495–569, 2000.
Fones, G. R., Davison,W., and Hamilton-Taylor, J.: The fine-scale remobilization of metals in the surface sediment of the North-East Atlantic, Cont. Shelf Res., 24, 1485–1504, 2004.
Garmo, O. A., Royset, O., and Steinnes, E.: Performance study of diffusive gradients in thin films for 55 elements, Anal. Chem., 75, 3573–3580, 2003.
Gherardi, F., Xu, T., and Pruess, K.: Numerical modeling of self-limiting and self-enhancing caprock alteration induced by CO2 storage in a depleted gas reservoir, Chem. Geol., 244, 103–129, 2007.
Hamilton, T. J., Davison, W., and Morfett, K.: A laboratory study of the biogeochemical cycling of Fe, Mn, Zn and Cu across the sediment-water interface of a productive lake, Aquat. Sci., 58, 191–209, 1996.
Harper, M. P., Davison, W., Zhang, H., and Tych, W.: Kinetics of metal exchange between solids and solutions in sediments and soils interpreted from DGT measured fluxes, Geochim. Cos-mochim. Ac., 62, 2757–2770, 1998.
Hawkins, D. G.: No exit: thinking about leakage from geologic carbon storage sites, Energy, 29, 1571–1578, 2004.
Kharaka, Y. K., Cole, D. R., Hovorka, S. D., Gunter, W. D, Knauss, K. G., and Freifeld, B. M.: Gaswater-rock interactions in Frio Formation following CO2injection: Implications for the storage of greenhouse gases in sedimentary basins, Geology, 34, 577– 580, 2006.
Korbol, R. and Kaddour, A.: Sleipner Vest CO2disposal-injection of removed CO2into the Utsira formation, Energ. Convers. Man-age., 36, 509–512, 1995.
Larner, B. L., Seen, A. J., and Snape, I.: Evaluation of diffusive gradients in thin film (DGT) samplers for measuring contam-inants in the Antarctic marine environment, Chemosphere, 65, 811–820, 2006.
Lewicki, J. L., Oldenburg, C. M., Dobeck, L., and Spangler, L.: Sur-face CO2leakage during two shallow subsurface CO2 release, Geophys. Res. Lett., 34, L24402, doi:10.1029/2007GL032047, 2007.
Li, W., Zhao, H., Teasdale, P. R., and Wang, F.: Trace metal speci-ation measurements in waters by the liquid binding phase DGT device, Talanta, 67, 571–578, 2005.
Loring, D. H. and Rantala, R. T. T.: Manual for the geochemical analyses of marine sediments and suspended particulate matter, Earth-Sci. Rev., 32, 235–283, 1992.
Morford, J. L. and Emerson, S.: The geochemistry of redox-sensitive trace metals in sediments, Geochim. Cosmochim. Ac., 63, 1735–1750, 1999.
M. V. Ardelan and E. Steinnes: Mobility and solubility of the redox sensitive metals 583
Nico, P. S., Anastasio, C., and Zasoski, R. J.: Rapid photo-oxidation of Mn(II) mediated by humic substances, Geochim. Cosmochim. Ac., 66, 4047–4056, 2002.
Nold, S. C. and Zwart, G.: Patterns and governing forces in aquatic microbial communities, Aquat. Ecol., 32, 17–35, 1998. Obata, H., Doi, T., Hongo, Y., Alibo, D. S., Minami, H., Kato, Y.,
and Maruo, M.: Manganese, cerium and iron in the Sulu, Celebes and Philippine Seas, Deep-Sea Res. Pt. II, 54, 38–49, 2007. OSPAR 2006: Convention for the Protection of the marine
Envi-ronment of the North-East Atlantic-Quality Agreement on Back-ground Concentrations for Contaminants in Seawater, Biota and Sediment (OSPAR Agreement 2005-6), 2006.
¨
Ozt¨urk, M.: Trends of trace metals (Mn, Fe, Co, Cu, Zn, Cd and Pb) distributions at the oxic-anoxic interface and in sulfidic water of Drammensfjord, Mar. Chem., 48, 329–342, 1995.
¨
Ozt¨urk, M., Vadstein, O., and Sakshaug, E.: The effects of en-hanced phytoplankton production on iron speciation and removal in mesocosm experiments in a landlocked basin of Hopav˚aagen, Norway, Mar. Chem., 84, 3–17, 2003.
Rue, E. L. and Bruland, K. W.: Complexation of iron(III) by natu-ral organic ligands in the Centnatu-ral North Pacific as determined by new competitive ligand equilibration/adsorptive cathodic strip-ping voltammetric method, Mar. Chem., 50, 117–138, 1995. Sangi, M. R., Halstead, M. J., and Hunter, K. A.: Use of the
diffu-sion gradient thin film method to measure trace metals in fresh waters at low ionic strength, Anal. Chim. Acta, 456, 241–251, 2002.
Scally, S., Davison, W., and Zhang, H.: In Situ Measurements of Dissociation Kinetics and Labilities of Metal Complexes in So-lution Using DGT, Environ. Sci. Technol., 37, 1379–1384, 2003. Shirayama, Y. and Thornton, H.: Effect of increased atmospheric CO2 on shallow water marine benthos, J. Geophys. Res., 110, C09S08, doi:10.1029/2004JC002618, 2005.
Usero, J., Gamero, M., Morillo, J., and Gracia, I.: Comparative study of three sequential extraction procedures for metals in ma-rine sediments, Environ. Int., 24, 487–496, 1998.
Van den Berg, G. A., Meijers, G. G. A., Van der Heijdt, L. M., and Zwolsman, J. J. G.: Dredging-related mobilisation of trace metals: a case study in the Netherlands, Water Res., 35, 1979– 1986, 2001.
Wang, S. and Jaffe, P. R.: Dissolution of a mineral phase in potable aquifers due to CO2 releases from deep formations; effect of dissolution kinetics, Energ. Convers. Manage., 45, 2833–2848, 2004.
Widdicombe, S. and Needham, H. R.: Impact of CO2-induced sea-water acidification on the burrowing activity of Nereis virens and sediment nutrient flux, Mar. Ecol.-Prog. Ser., 341, 111–122, 2007.
Wu, J. and Luther, G. W.: Complexation of Fe(III) by natural or-ganic ligands in the Northwest Atlantic Ocean by a competitive ligand equilibration method and a kinetic approach, Mar. Chem., 50, 159–177, 1995.
Zhang, H. and Davison, W.: Performance Characteristics of Dif-fusion Gradients in Thin Films for the in Situ Measurement of Trace Metals in Aqueous Solution, Anal. Chem., 67, 3391–3400, 1995.
Zhang, H., Davison, W., Miller, S., and Tych, W.: In situ high res-olution measurements of fluxes of Ni, Cu, Fe, and Mn and con-centrations of Zn and Cd in porewaters by DGT, Geochim. Cos-mochim. Ac. , 59, 4181–4192, 1995.
Zhang, H. and Davison, W.: Diffusional characteristics of hydrogels used in DGT and DET techniques, Anal. Chim. Acta, 398, 329– 340, 1999.
Zhang, H., Davison, W., Mortimer, R. J. G., Krom, M. D., Hayes, P. J., and Davies, I. M.: Localised remobilization of metals in a marine sediment, Sci. Total Environ., 296, 175–187, 2002. Zhang, H.: Manual for DGT: http://www.dgtresearch.com/