Simulation of water sensitive papers for spray analysis
Emanuele Cerruto, Sabina Failla, Domenico Longo, Giuseppe Manetto
(Department of Agricoltura, Alimentazione e Ambiente (Di3A) – University of Catania, Italy)Abstract: Aim of this study was to simulate the water sensitive paper (WSP) behavior for estimate the unitary spray deposition on the target at varying spray features and target coverage. WSP images were produced assuming some simplifying hypotheses: spherical drops and circular stains randomly placed on the images. Sprays were described in terms of probability distribution function (PDF) of drop size (log-normal and Rosin-Rammler), coefficient of variation of diameters (CV), arithmetic mean diameter (AMD), and volume median diameter (VMD). The results from the simulations showed that the overlap between stains was independent of spray features: when the percentage of covered surface of WSP images ranged from 4.7% up to 61.6%, the overlap between stains ranged from 0.3% up to 33.4%. On the contrary, unitary deposit
(volume per square centimeter centimeter,
particles/cm2) could be obtained from the percentage of covered surface if CV, AMD, VMD and PDF were known. However, assuming as spray parameter the VMD, the drop size distribution had almost no effect on the unitary deposit: with the same percentage of covered surface, the Rosin-Rammler PDF provided an estimate of the unitary deposit higher than log-normal distribution between 5% and 7% only.
Keywords: spray deposition, drop size distribution, log-normal distribution, Rosin-Rammler.
Citation: Cerruto, E., S. Failla, D. Longo, and G. Manetto. 2016. Simulation of water sensitive papers for spray analysis. Agricultural Engineering International: CIGR Journal, 18(4):22-29.
1 Introduction
1Water sensitive papers are a very common tool for a quick assessment of the superficial coverage in phytosanitary treatments (Pezzi and Rondelli, 2000; Fox et al., 2003; Pergher et al., 2008; Khot et al., 2011; Salyani et al., 2013; Mishra et al., 2014). Moreover, they are used for sprayer calibration in field to avoid off-target losses and to reduce the pesticide impact on the environment, as imposed by the European Directives 2009/127/CE and 2009/128/CE (Khot et al., 2014; Azizpanah et al., 2015). Their use in field presents some limitations as it is difficult to detect stains less than 50
m in diameter, it is recommended the use under low
humidity conditions only, droplet spread varies with the physical properties of the spray liquid, but they can be
Received date: 2015-09-21 Accepted date: 2016-09-08 *Corresponding author: Emanuele Cerruto, Department of Agricoltura, Alimentazione e Ambiente (Di3A)-University of Catania-Italy. Tel: +390957147514, Fax: +390957147600. Email: [email protected]
useful to quickly produce indicators related to crop spray quality (Cunha et al., 2012). PVC targets covered with silicon oil are also used, especially when spraying high volume rates (Juste et al., 1990; Cerruto and Failla, 2003).
Measurement of foliar spray deposition involves the use of a tracer to be added to the spray mixture. Widely used tracers are water-soluble dyes such as Poinceau Red or yellow tartrazine, fluorescent products (Pergher, 2004; Jamar et al., 2010; Pascuzzi and Cerruto, 2015) or metal chelates such as copper, manganese, and zinc (Cross et al., 2001; Ade and Pezzi, 2001; Solanelles et al., 2006).
increases the probability of contact between pest and pesticide. Both aspects are influenced by many other factors, among which the most important is the spray spectrum (Hewitt, 1997; Hewitt et al., 1998; Matthews, 2004; Nuyttens et al., 2007).
In a previous study (Cerruto et al., 2013) the authors showed that, for a fixed drop size distribution, the unitary deposit was correlated to the percentage of covered surface, and the relationship was affected by coefficient of variation (CV) and arithmetic mean diameter (AMD) of drop diameters. In this paper two drop size distributions (log-normal and Rosin-Rammler) were considered, to assess whether the results are distribution independent.
2 Material and methods
2.1 WSP simulation
WSP images were simulated assuming two drop diameter probability distribution functions (PDF): log-normal (LN) and Rosin-Rammler (RR), widely used for describing drop pulverisation (Babinsky and Sojka, 2002; Schick, 2008). The PDFs of the number of drops are as Equation 1 and Equation 2:
Log-normal:
2 2 ln ln 0 2
1
D e D D
f ; (1)
Rosin-Rammler:
k D k k e k kD D f 3 1 3 4
0 , (2)
being D the drop diameter. The scale ( and ) and location ( and k) parameters, that affect shape and position of PDF curves, are analytically correlated to CV, AMD and VMD of the drop diameters.
x is the gamma function, defined as Equation 3:
0 1 dt e tx x t . (3)
Given the drop diameter D (µm), the corresponding stain diameter Ds (µm) was calculated using the Equation 4 (QInstruments, 2013):
143 . 1 938 . 0 D
Ds . (4)
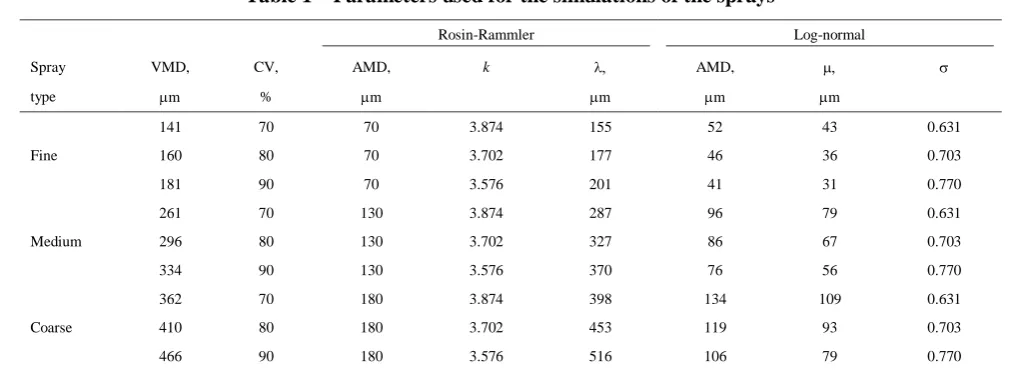
For each PDF three spray types were simulated, classified as Fine, Medium and Coarse (Hewitt et al., 1998). They were obtained by changing the scale and location parameters of the two PDFs. Moreover, for each spray type, three VMD and three CV were considered. The values chosen for the simulations are reported in Table 1, whereas in Figure 1 are reported the cumulative spray volume curves.
Table 1 Parameters used for the simulations of the sprays
Rosin-Rammler Log-normal
Spray VMD, CV, AMD, k AMD,
type m % m m m m
141 70 70 3.874 155 52 43 0.631
Fine 160 80 70 3.702 177 46 36 0.703
181 90 70 3.576 201 41 31 0.770
Figure 1 Cumulative spray volume curves used for simulating the sprays (solid lines: Rosin-Rammler PDF;
dotted lines: log-normal PDF).
Keeping the same values of CV and VMD for the two distributions, AMD values resulted different. The comparison between the two distributions was then carried out assuming as parameter the VMD value.
Images of water sensitive papers with size of 2 cm × 7 cm were produced with a resolution of 1200 dpi (enough to detect stains of 24 µm in diameter), randomly allocating the stains, circular shaped. Reference values S* of percentage of covered surface (not considering overlaps between stains) were chosen ranging from 5% up to 95% with step of 10%. For each spray type (CV and VMD) and for each value of S*, three replicates were carried out, so producing a total of 540 images.
All the main reference data used to produce each image (drop diameter population, unitary deposit, VMD of the drops, percentage of covered surface) were stored for subsequent analyses. Simulations were carried out by using the R software (R Development Core Team, 2013).
2.2 Data analysis
These simulated WSP images were treated as effective WSP images and then they were analysed by means of the image processing software ImageJ (Abramoff et al.,
2004). This software detects the particles, without distinguishing between the overlapped ones, and provides several data for each image: only percentage of covered surface and number of particles were selected for this study. Measured data were correlated with the reference ones used to produce the images so to analyse their trend at varying spray and image features. In particular, in this study the correlation between unitary deposit and percentage of covered surface on WSP images was exploited. All the statistical analyses and graphical representations were carried out by using the same software R.
3 Results and discussion
3.1 WSP images
Two examples of the simulated WSP images are reported in Figure 2, the first referring to a spray with log-normal drop diameter distribution, the second with Rosin-Rammler distribution. Both sprays are of the same type (Medium, VMD about 290 µm) and with the same CV (0.8); moreover, the images have the same S* (15%) and very similar deposits (about 0.6 µL/cm2), but look quite different. This implies that the PDF of the drop diameter affects the features of the images produced on WSP.
Figure 2 Examples of two WSP images produced by the simulations: log-normal (top) and Rosin-Rammler
(bottom).
The main quantities for the two images are:
impact density = 394 drops/cm2, unitary deposit = 0.573 µL/cm2, VMD = 289 µm;
- Rosin-Rammler: CV = 0.8, AMD = 130 µm, S* = 15%, impact density = 166 drops/cm2, unitary deposit = 0.611 µL/cm2, VMD = 291 µm.
3.2 Superficial coverage
Reference (S*, %) and measured (Sm, %) percentage of covered surface was related by the Equation 5:
047 . 0 100
100 ln 063 . 101
*
m
S
S , (5)
independently of PDF and spray features (Figure 3). The coefficient of determination R2 was equal to 0.9997, highly significant. The Equation 5 confirms the result of a previous research (Cerruto and Aglieco, 2013), obtained considering sprays characterised by log-normal PDF and only one value of CV (0.5). Probably this result is independent of spray features, but could be affected by other assumptions of the model (circularity of the stains, for example) that will be investigated in further developments of the research.
Figure 3 Correlation between reference and measured percentage of covered surface.
Equation 5 allows the calculation of the overlap between stains: when the reference percentage of covered surface ranged from 5% up to 95%, that measured on the WSP images ranged from 4.7% up to 61.6% and then the overlap ranged from 0.3% up to 33.4%. Moreover,
according to Equation 5, the measured value of percentage of covered surface increases asymptotically towards 100% when the reference one tends to infinity. This implies that high values of percentage of covered surface involve very high degrees of overlap between stains.
3.3 Unitary spray deposition
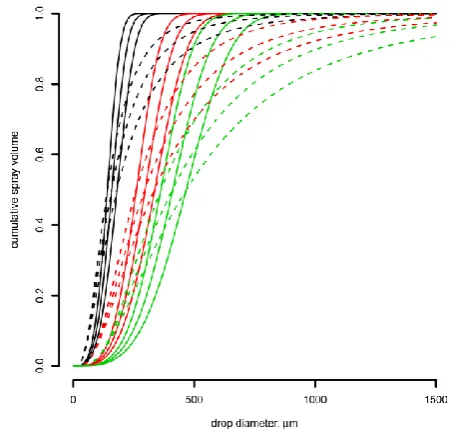
The trends of the reference unitary deposit ds (L/cm2) vs. the measured percentage of covered surface Sm (%) are reported in Figure 4 at varying coefficient of variation (CV) and arithmetic mean diameter (AMD, m) of the drop diameters.
Figure 4 Correlation between reference unitary deposit and measured percentage of covered surface at varying
CV and arithmetic mean diameter (AMD, m) of the drop diameters.
All trends were well explained by quadratic relations (Equation 6) of the form:
2
m m
s a b S c S
d , (6)
of a previous research (Cerruto et al., 2013), where only the log-normal PDF was considered.
Table 2 Coefficients of regression of deposit on
percentage of covered surface (Equation 6), assuming
as parameters AMD (m) and CV.
AMD CV PDF a b×102 c×104 R2 41 0.9 LN 0.060 1.804 3.708 0.9970 46 0.8 LN 0.038 1.958 2.963 0.9991 52 0.7 LN 0.035 1.787 2.874 0.9994 70 0.7 RR 0.041 1.831 2.987 0.9996 70 0.8 RR 0.045 1.991 3.268 0.9996 70 0.9 RR 0.053 2.126 3.632 0.9995 76 0.9 LN 0.047 3.232 5.014 0.9982 86 0.8 LN 0.061 3.022 4.661 0.9979 96 0.7 LN 0.049 2.906 4.266 0.9996 106 0.9 LN 0.052 4.140 6.465 0.9949 119 0.8 LN 0.109 3.346 6.693 0.9972 130 0.7 RR 0.063 2.870 4.598 0.9995 130 0.8 RR 0.059 3.249 4.816 0.9995 130 0.9 RR 0.072 3.392 5.500 0.9996 134 0.7 LN 0.075 3.490 5.748 0.9986 180 0.7 RR 0.078 3.650 5.829 0.9992 180 0.8 RR 0.101 3.771 6.799 0.9991 180 0.9 RR 0.107 4.251 7.047 0.9984
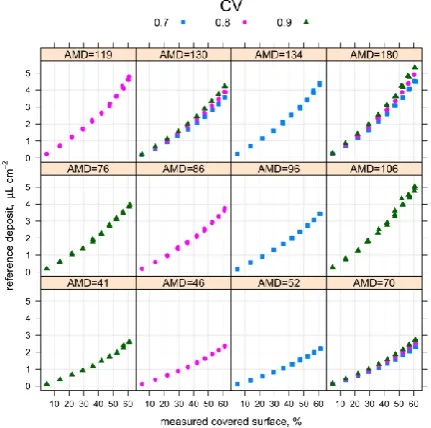
The comparison between the two PDFs was carried out assuming as parameter the volume median diameter, equal for the two PDFs. Figure 5 reports the trends of ds (L cm-2) vs. Sm (%), at varying VMD and PDF.
Figure 5 Correlation between reference unitary deposit and measured percentage of covered surface at varying
PDF and volume median diameter (VMD, m) of the drop diameters.
The graph shows a neglecting effect of the PDF of the number of drops on the unitary deposit. As a general result, the Rosin-Rammler PDF produced, at the same percentage of covered surface, a greater unitary deposit with respect to the log-normal PDF, but the difference was between 5% and 7%, with higher values at higher percentage of covered surface.
If this result will be confirmed by further simulations with other drop diameter probability distribution functions, the knowledge of the VMD only, usually available among the nozzle features, could be enough to estimate the superficial unitary deposit measuring the percentage of covered surface on WSP.
The trends of ds vs. Sm, for a fixed VMD, were again quadratic, with R2 values ranging from 0.9949 up to 0.9996. The coefficients of the regression equations are reported in Table 3, assuming as parameters volume median diameter and probability distribution function.
Table 3 Coefficients of regression of deposit on
percentage of covered surface (Equation 6), assuming
as parameters VMD (m) and PDF.
VMD PDF a b×102 c×104 R2 141 LN 0.035 1.787 2.874 0.9994 141 RR 0.041 1.831 2.987 0.9996 160 LN 0.038 1.958 2.963 0.9991 160 RR 0.045 1.991 3.268 0.9996 181 LN 0.060 1.804 3.708 0.9970 181 RR 0.053 2.126 3.632 0.9995 261 LN 0.049 2.906 4.266 0.9996 261 RR 0.063 2.870 4.598 0.9995 296 LN 0.061 3.022 4.661 0.9979 296 RR 0.059 3.249 4.816 0.9995 334 LN 0.047 3.232 5.014 0.9982 334 RR 0.072 3.392 5.500 0.9996 362 LN 0.075 3.490 5.748 0.9986 362 RR 0.078 3.650 5.829 0.9992 410 LN 0.109 3.346 6.693 0.9972 410 RR 0.101 3.771 6.799 0.9991 466 LN 0.052 4.140 6.465 0.9949 466 RR 0.107 4.251 7.047 0.9984
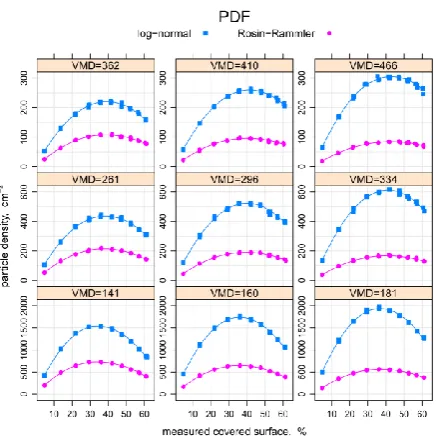
3.4 Particle density
biological efficacy of a pesticide application (Matthews, 2000).
Figure 6 and Figure 7 report the particle density, as detected by ImageJ, vs. the percentage of covered surface, parameterised in terms of AMD and CV (Figure 6) or VMD and PDF (Figure 7).
Figure 6 Correlation between particle density and measured percentage of covered surface at varying CV
and arithmetic mean diameter (AMD, m) of the drop diameters.
Figure 7 Correlation between particle density and measured percentage of covered surface at varying PDF
and volume median diameter (VMD, m) of the drop diameters.
Due to the overlap of stains, particle density increased up to a maximum, reached when the percentage of covered surface ranged from 36% and 43%, and then decreased.
Figure 6 points out a strong effect of both arithmetic mean diameter and coefficient of variation on particle density: keeping constant CV, particle density increased when AMD decreased and, keeping constant AMD, particle density increased when CV decreased. As an example, with CV = 0.8, particle density decreased from an average value of 1346 up to 209 particles/cm2 when the AMD increased from 46 up to 119 m and, with AMD = 130 m, particle density increased from 136 up to 169 particles/cm2 when CV decreased from 90% up to 70%.
Figure 7 points out also a strong effect of VMD and PDF on particle density. When the VMD increased from 141 up to 466 m, the average particle density decreased from 868 up to 158 particles/cm2. Moreover, keeping the same VMD, the log-normal distribution produced a higher particle density: on average, particle density with LN distribution was 2.7 times that with RR distribution.
4 Conclusions and perspectives
Even if further studies are necessary to improve the model, the main results of the simulations allow the following conclusions:
spot irregularities in the spray system (overlap, over- and under-dosing), and to correct off-target losses. Moreover, WSPs could also be used in sprayer workshops during sprayer inspection to compare installed and new nozzles. - Particle density can be estimated from the percentage
of covered surface, but the knowledge of spray features (AMD, CV, VMD, and PDF) is necessary. Due to the overlap between stains, particle density is maximum when percentage of covered surface is between 36% and 43%. The maximum value depends on spray features. - The unitary deposit can be derived from the
percentage of covered surface on WSP, but the knowledge of the spray features is necessary. Though, when sprays are described in terms of VMD and PDF, these first simulations indicate that the knowledge of the VMD only could be enough to estimate the deposit: the PDF has only a negligible effect on deposit (differences between 5% and 7%), but further simulations are necessary to better asses this aspect.
- Spray features are primarily dependent on nozzle type and working pressure. Nozzle manufacturers usually provide some data such as the VMD, but its value may vary due to the wear. However, according to the European Directive 2009/128/EC, inspection of pesticide application equipment is mandatory at regular intervals, so the presence of worn-out components should be greatly reduced. This may help set up a data base with WSP images in standard conditions that can be stored on mobile devices and used as reference to evaluate in field, even approximately, superficial coverage, overlap, and unitary spray deposition.
- It is necessary to validate the model by means of a laboratory test bench that allows to measure spray drop features, unitary deposit and percentage of covered surface on WSP. When the correlation between the two quantities that mostly affect the efficacy of a pesticide application, i.e. percentage of covered surface and unitary deposit, is statistically significant, it is enough to measure the former to know also the latter. Such a test bench is under construction at Department Di3A (Cerruto et al.,
2015). Its use, based on the procedure described in ISO 5682-1, should allow to measure spray drop diameters and to correlate percentage of covered surface on WSP to superficial spray deposition on artificial and natural targets.
Acknowledgements
The authors would like to thank the Department of Agricoltura, Alimentazione e Ambiente, University of Catania, Italy. Research developed with the support of University of Catania FIR 2014.
References
Abramoff, M.D., P. J. Magelhaes, and S.J. Ram. 2004. Image processing with ImageJ. Biophotonics International, 2004, 11(7):36–42.
Ade, G., and F. Pezzi. 2001. Results of field tests on a recycling air-assisted tunnel sprayer in a peach orchard. J. Agr. Eng. Res., 80(2001): 147–152.
Azizpanah, A., A. Rajabipour, R. Alimardani, K. Kheiralipour, and V. Mohammadi. 2015. Precision spray modelling using image processing and artificial neural network. Agricultural Engineering International: CIGR Journal, 17(2):65–74. Babinsky, E., and P. E. Sojka. 2002. Modelling drop size
distribution. Progress in Energy & Combustion Science,
28(4):303–329.
Cerruto, E., and S. Failla. 2003. Prove di distribuzione in vigneto con irroratrice a polverizzazione meccanica. Parte II: analisi di bersagli artificiali. Rivista di Ingegneria Agraria, 34(3):13–22.
Cerruto, E., and C. Aglieco. 2013. Water sensitive papers simulation to assess deposits on targets. Journal of Agricultural Engineering, 44 (2s):397–401.
Cerruto E., C. Aglieco, S. Failla, and G. Manetto. 2013. Parameters influencing deposit estimation when using water sensitive papers. Journal of Agricultural Engineering, 44(2): 62–70. Cerruto, E., G. Manetto, S. Failla, D. Longo, L. Caruso, and G.
Schillaci. 2015. A laboratory test bench to analyse nozzle sprays. Proceedings of International Conference Ragusa SHWA “Safety Health and Welfare in Agriculture Agro-food and Forestry Systems”, September 8–11, 2015, Lodi, Italy. Cross, J.V., P.J. Walklate, R.A. Murray, and G.M. Richardson.
2001. Spray deposits and losses in different sized apple trees from an axial fan orchard sprayer: 1. Effects of spray liquid flow rate. Crop Protection, 20(4): 333–343.
on water-sensitive papers used as artificial targets. Biosyst. Eng. 111 (1):11–23.
European Commission. 2009. Directive 2009/127/EC of the European Parliament and of the Council of 21 October 2009 amending Directive 2006/42/EC with regard to machinery for pesticide application. In: Official Journal, L 310/29, 25/11/2009.
European Commission. 2009. Directive 2009/128/EC of the European Parliament and of the Council of 21 October 2009 establishing a framework for Community action to achieve the sustainable use of pesticides. In: Official Journal, L 309/71, 24/11/2009.
Fox, R. D., R. C. Derksen, J. A. Cooper, C. R. Krause, and H. E. Ozkan. 2003. Visual and image system measurement of spray deposits using water–sensitive paper. Applied Engineering in Agriculture, 19(5):549–552.
Hewitt, A. J. 1997. The importance of droplet size in agricultural spraying. Atomization & Spray 7(3):235–44.
Hewitt A. J., D. L. Valcore, M. E. Teske, and R. J. Schick. 1998. Droplet size classification for agricultural sprays. Proceedings Ilass 11th Annual Conference on Liquid Atomization and Spray Systems, Sacramento, CA, May 1998.
Jamar, L., O. Mostad, B. Huyghebaert, O. Pigeon, and M. Lateur. 2010. Comparative performance of recycling tunnel and conventional sprayers using standard and drift-mitigating nozzles in dwarf apple orchards. Crop Prot., 29(6):561–566. Juste F., S. Sanchez, R. Ibanez, L. Val, and C. Garcia. 1990.
Measurement of spray deposition and efficiency of pesticide application in citrus orchard. Journal of Agricultural
Engineering Research, 46(5211):187–196.
Khot, L. R., M. Salyani, M. Farooq, T. W. Walker, R. D. Sweeb, P. A. Larbi, V. Smith, R. Pomolis, and C.A. Stoops. 2011. Assessment of aerosol deposition and movement in open field conditions. Agricultural Engineering International: CIGR Journal, 13(3):1–11.
Khot, L. R., R. Ehsani, L. G. Albrigo, W. Swen, J. C. Neto, J. M. Campoy, and C. Wellington. 2014. Variable rate spraying in varied micro-meteorological conditions. Agricultural Engineering International: CIGR Journal, 16(1):90–98. Matthews, G. A. 2000. Targets for pesticide deposition. In
Pesticide Application Methods, Third Edition, Blackwell Science Ltd, Oxford, UK. doi: 10.1002/9780470760130.ch2. Matthews, G. A. 2004. How was the pesticide applied? Crop Prot.
23(7):651–653.
Mishra, P. K., M. Singh, A. Sharma, K. Sharma, and B. Singh. 2014. Studies on effect of electrostatic spraying in orchards. Agricultural Engineering International: CIGR Journal, 16(3):60–69.
Nuyttens, D., K. Baetens, M. De Schampheleire, and B. Sonck. 2007. Effect of nozzle type, size and pressure on spray droplet characteristics. Biosyst. Eng. 97(3):333–345.
Pascuzzi, S., and E. Cerruto. 2015. Spray deposition in “tendone” vineyards when using a pneumatic electrostatic sprayer. Crop Prot., 68(2):1–11.
Pergher, G. 2004. Field evaluation of a calibration method for air-assisted sprayers involving the use of a vertical patternator. Crop Prot., 23(5):437–446.
Pergher, G., R. Petris, M. Biocca, and P. Menesatti. 2008. Prime verifiche di campo di un’irroratrice schermata ad aeroconvezione di nuova concezione. Proceedings of Giornate Fitopatologiche 2008, Cervia (RA), March 12–14, 2:51–58.
Pezzi, F., and V. Rondelli. 2000. The performance of an air-assisted sprayer operating in vines. Journal of
Agricultural Engineering Research, 76(4):331–340.
QInstruments. 2013. Water sensitive papers. Available from: http://www.qinstruments.com/en/
service/downloads/downloads-wsp.html.
R Core Team. 2013. R: A language and environment for statistical computing. R Foundation for Statistical Computing, Vienna, Austria, URL http://www.R-project.org/.
Salyani M., H. Zhu, R.D. Sweeb, and N. Pai. 2013. Assessment of spray distribution with water-sensitive paper. Agricultural Engineering International: CIGR Journal, 15(2):101–111. Schick, R. J. 2008. Spray technology reference guide:
understanding drop size. Bulletin No. 459C, ©Spraying Systems Co. 2008.