Int. J. Adv. Res. Sci. Technol. Volume 5, Issue 1, 2016, pp.536-543.
International Journal of Advanced Research in
Science and Technology
journal homepage: www.ijarst.com
ISSN 2319 – 1783 (Print)
ISSN 2320 – 1126 (Online)
Modelling of a Solar Energy Optimized System for a Residential Setup.
Mohammed Alghassab* and Mohamed A. Zohdy
2200 N Squirrel Rd, Rochester, Michigan 48309-4401, USA.
*Corresponding Author’s Email: (maalghassab , zohdyma)@oakland.edu
A R T I C L E I N F O A B S T R A C T
Article history: Received Accepted Available online
: 03 Mar. 2016 : 21 Mar. 2016 : 26 Mar. 2016
With the increased pollution levels and global warming, people are getting more aware of this persisting problem. This is causing a great push for the demand of renewable energy. The trend started with electric vehicles, although this is a good step but still not enough. One of the most promising solutions is the installation of solar cells in household setups. With the tax credits and the installation of smart grids, which allow to recuperate some of the initial cost back, the equivalent cost of installing such systems is getting cheaper and thus becoming more feasible and within the budget of a lot of people. This paper, models the photovoltaic setup, the proposed system includes a battery bank, electric or a plugin electric vehicle, smart grid, and an array of photovoltaic cells. The proposed method also aims at maximizing the solar energy usage, or in other words reduces the amount of said energy that is going to waste by not having any active receiver at any given time of the day.
© 2016 International Journal of Advanced Research in Science and Technology (IJARST). All rights reserved. Keywords:
Electric Vehicles Energy Optimization Photovoltaic System Renewable Energy Smart Grid.
PAPER-QR CODE
Citation: Mohammed Alghassab. et. al., Modelling of a Solar Energy Optimized System for a Residential Setup, Int. J. Adv. Res. Sci. Technol. Volume 5, Issue 1, 2016, pp.536-543.
Introduction:
A significant role in reducing greenhouse emissions and decreasing pollution levels can be accomplished by installing photovoltaic cells (PV) in residential households [8]. Other than the fact that PV cells decrease pollution levels, it can have many other advantages as well. For example, the stochastic distribution of such systems can help stabilize the grid and decrease costs for local utility companies [7, 6]. It can also help in reducing costs by providing local power energy at some points, thus helping the utility companies to use less power-rated transformers which are generally cheaper. All these advantages to the utility company push the price to be cheaper. Home owners in the USA can benefit from huge tax incentives if they install a PV system or any other renewable energy component. Utility companies are also willing to pay for the solar energy that the household is generating. This purchase often happens at peak load hours and thus it is more beneficial for the end user.
PV systems can be fully utilized if bundled with other components to help fully utilize the whole system. The components that make up the whole system are:
1. Electric Vehicle or Plugin Hybrid Electric Vehicle
2. Photovoltaic System
3. Battery Bank
4. Smart Grid
Electric (EV) or plugin electric vehicles (PEV) are a very efficient way to help reduce greenhouse emissions and reduce pollution levels [10, 9, and 1]. This is not enough though, if the energy source that is producing the energy to propel these cars is polluting, then we haven’t fixed the problem. To have a better solution, the energy source that is used to charge the batteries of these vehicles must come from a renewable source. This energy can be generated from the PV setup that is installed in the residential household.
Int. J. Adv. Res. Sci. Technol. Volume 5, Issue 1, 2016, pp.536-543. this fact. Our goal will ultimately be to make sure that
no solar energy is wasted because no energy receiver was present at any point.
The rest of the paper will be organized as follows. The next section will present the literature survey and present what was done earlier in this field. The following section will describe our work and what we are proposing. Results and future work section will be presented later. The paper is then ended with a summary and conclusion section.
Related Work:
In a previous work [1], we analyzed a photovoltaic system which contains all the components needed to model the complete architecture established on 4 different US based geographic locations. The previously done work did not get into technical details or try to optimize any part. In this paper, we are taking what was presented in the earlier paper and continue on that work. Before, we present our work, the rest of this section will list some of the work that was done in this field.
The authors in [18] presented an all-electric smart house with a Solar Collector (SC), PV, a fixed battery and an EV. The authors determined the optimal operation scheduling of the controllable loads (smart equipment) to minimize operation cost using Matlab simulations. Researchers in [3] presented a feasibility analysis done for a grid-connected PV system for a rural settlement consisting of several houses. This analysis was done to explore feasibility from a technical and economical point of view. They used simulation software called HOMER to obtain optimization results. They deduced that the project would be only feasible if solar credits are provided, capital costs are reduced and rebate structures are available. A rolling optimization based on Mixed Integer Linear Programming (MILP) to efficiently manage energy consumption in a smart home was introduced in [5]. The house is equipped with a battery bank and a photovoltaic system. The authors optimized the cost in a house that is connected to the grid with real time pricing. The authors were able to develop an algorithm to make decisions to minimize energy use. The authors in [7] used Tabu search and genetic algorithm to control loads and minimize operational cost in an all-electric house equipped with renewable energy systems (wind and solar) and a battery band and has an EV. The authors assumed that the forecasted power data for the renewable energy systems and load demands were available for day ahead. In [11], the authors again used HOMER software to minimize the unit cost of energy and greenhouse gas emissions for a stand-alone hybrid renewable power generation systems that included a combination of the following: PV, wind energy system, a battery bank, and diesel generators. The cost analysis was based on load profile, solar irradiance, wind speed, and fuel price. The authors were able to optimize the system to reduce cost and emissions significantly. The real-time scheduling of residential appliances in the home energy management system (HEMS) was investigated in [19]. The home included various loads including an electric water heater and other loads, an EV, a photovoltaic cell, and a
battery. The proposed demand response mechanism and real-time scheduling algorithm was able to optimize the operation of loads to reduce the utility bill. An optimal centralized scheduling method to control the consumption of electric appliances in a house was proposed in [13]. Discharging the EV is also considered to support the microgrid. The micro grid uses the EV as electricity storage to improve the efficiency and reliability of the system.
Optimizing the operation of renewable energy sources allowed for increasingly efficient sources (see [12]). HEMS have also helped alleviate grid pressure during peak times. Genetic algorithms, neural network, and fuzzy logic algorithms have been increasingly playing a role in home monitoring and control systems [19] and [4]. The next section will describe the system and architecture that we are proposing.
System Architecture:
The system components were discussed in details in a previous work [1]. The system consists of the following components:
1. EV or Plugin Hybrid Electric Vehicle 2. Photovoltaic System
3. Battery Bank 4. Smart Grid 5. House Loads
Different combinations of the components are considered based on the following parameters: whether the user has a battery bank at home or not, whether the user charges the EV (or PEV) at work, and finally whether the EV (or PEV) allows reverse power flow from the vehicle to the house.
Table: 1 shows the different possible configurations. The average one-way commute distance from home to work in the USA is 16 miles [16]. Typical EVs go 2.5 - 3 miles per kWh. For example, Nissan Leaf’s rated efficiency is 2.94 miles per kWh [14]. Therefore, the average person would need 5 kWh for a one-way commute to work. For a 15 kWh battery pack, that translates to 33% State of Charge (SOC).
Table 1: Various Configurations
The power flow at any given time for the proposed setup is given as shown in the equation below:
Where , represents the power flow into the battery bank. This value can either be positive or negative. represents the power into or from the
grid, this one also can either be positive or negative. Case Battery
Bank
Charges EV (or PEV) at work
Reverse Power Flow Supported
1 No Yes Yes
2 No Yes No
3 No No No
4 Yes Yes Yes
5 Yes Yes No
Int. J. Adv. Res. Sci. Technol. Volume 5, Issue 1, 2016, pp.536-543.
represents the power into or from the vehicle. This
value can also be either negative or positive. represents the power consumption of the household, this value can only be negative as the household can only consume power. represents the power generated
from the PV array. This number can only be positive as the PV cells can only generate and not consume any power. The goal of this paper is to try to maximize
at any given time. Multiplying the power flow equation by time (t) will yield the equation below, which represents the energy equation of the system:
We assume that the power flowing into the battery bank only comes from solar energy, otherwise a rectifier will be needed and thus adding to the total cost of the system. Based on this assumption, the total size of the battery pack given by Equation (1) should not exceed a value that is defined by the size of the solar cell and the geographic location of the setup.
(1)
The United Stated National Renewable Energy Laboratory lists the amount of energy that can be delivered per square meter of PV area anywhere in the country [15]. Another resource is the NASA Surface meteorology and Solar Energy resource [17]. Using that interactive map [15], we can predict the amount of energy that can be generated using a known size PV cell. Given that assumption, the value in Equation 1 must be less or equal to the amount of energy that can be generated from the PV cells.
The average household load was shown in our previous work [1]. Figure 1, below shows the load profile.
Fig: 1. Typical Home Load Power Consumption for a Summer Day
Adding an EV or a PEV load to this profile, and assuming that the driver selects schedule charging to that the vehicle will only charge during off peak hours. This added load as described earlier can be on average either 5 kWh if the driver charges at work or 10 kWh if the driver doesn’t charge at work. This new load will affect Fig: 1 and it will become as shown in Fig: 2. Fig: 2a shows the profile if charging is done at work, Fig: 2b shows the profile if no charging is done at home.
Given all the information and assumptions listed earlier, this information is modelled to find out the most energy used from the PV cells. Our model assumes that the average household power usage is similar between
different locations. This fact implies that because
and are similar throughout our
simulations then the goal of maximizing can be
fully achieved by minimizing the amount energy that is used from the grid. In other words, minimize the
term from power flow equation listed earlier.
Simulation Setup:
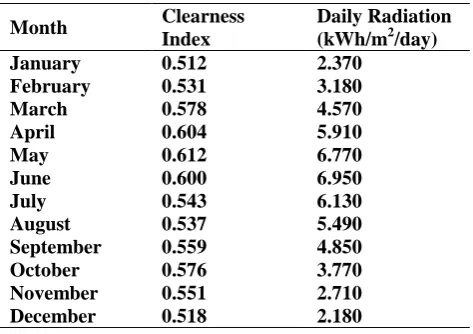
Simulation is performed using Microgrid Analysis Tool HOMER Pro. The system defined in the model consists of the components discussed in a previous section. The following prices are assumed: photovoltaic cells are $1,000/kW, battery bank is $450/kWh, converter is $300/kW, and grid power price is $0.23/kWh and gird sellback price is $0.01/kWh. Project lifetime is set to 25 years and the NASA Surface meteorology and Solar Energy resource is used for daily radiation values in the San Francisco Area (Table 2). The energy profile is assumed constant throughout the year and the energy profile shown in figure 2b is used, this includes the EV/PEV load profile. This makes our simulation more relevant to the EV or PEV owner. The sizes for PV (kW), battery bank (kWh), and converter (kW) considered are 0, 1,2,3,4, and 5. The length of the simulation is 25 years.
(a)
(b)
Fig: 2. Typical Home Load Power Consumption for a Summer Day with Vehicle Load
Results and Discussions:
Int. J. Adv. Res. Sci. Technol. Volume 5, Issue 1, 2016, pp.536-543. includes a 5 kW PV system, a 3 kW converter and a
1kWh battery bank.
Table: 2. Daily Radiations for San Francisco
Month Clearness
Index
Daily Radiation (kWh/m2/day)
January 0.512 2.370
February 0.531 3.180
March 0.578 4.570
April 0.604 5.910
May 0.612 6.770
June 0.600 6.950
July 0.543 6.130
August 0.537 5.490
September 0.559 4.850
October 0.576 3.770
November 0.551 2.710
December 0.518 2.180
Table: 3. Result Cases Considered
Case #
PV (kW)
Converter (kW)
Battery Bank(kWh)
1 5 4 -
2 - - -
3 5 1 5
4 5 3 1
Table: 4. Results for Different Cases
Case #
COE ($)
Energy Purchased (kWh/yr)
1 0.195 15,602
2 0.23 20,166
3 0.258 16,850
4 0.226 17,075
Table 4, Fig: 3 and Fig: 4, show the results for the four cases under consideration. Fig: 3 shows the COE (Cost of Electricity) which is the average cost of kWh of useful electricity produced by the system over the lifespan of the simulation. COE takes into account the capital investment as well as the operation and maintenance cost. Case #1 showed the lowest COE among all the combinations. Case # 4 also showed improvement compared to the grid-only option (Case #2). Fig. 4: shows the energy purchased (in kWh/year) for the four cases. Case # 1 showed the most reduction in energy purchased from the grid.
Therefore, Case #1 showed the most improvement by both reducing the COE and reducing dependency on the grid. Case # 4 showed a lower COE compared to the Case #2. Both Cases # 3 and 4 also reduced the amount of energy purchased from the grid. For readers looking for more simulation results, Appendix A at the end of this paper, lists hundreds of test cases that we ran with our simulation program.
Fig. 3: COE for Different Cases
Fig: 4. Energy Purchased per Year for the Different Cases of Study
Conclusion:
Adding a battery to the system does not improve performance compared to a system only equipped with a PV and a converter. This might be due to loses in the converter and the battery. However, the battery bank might help alleviate the stress on the grid during peak times. Adding a PV system and a converter significantly reduces the amount of energy purchased per year compared to a house that is only connected to the grid. In addition, a system that includes a PV system, a converter and a battery bank might help reduce the stress on the grid during peak time while also reducing the amount of energy purchased per year. Although the combination shown in case #1 proved to be the most optimal combination, adding a battery bank as shown in case #4 still performed better (lower COE) than a system that is only connected to the grid. Case #4 would also significantly reduce dependency on the grid and reduce stress during peak times which is usually when the PV is providing less energy (early mornings and evenings).
Int. J. Adv. Res. Sci. Technol. Volume 5, Issue 1, 2016, pp.536-543. plugin electric vehicle, smart grid, and an array of
photovoltaic cells. Optimization simulations are performed in order to maximize the solar energy usage, or in other words to reduce the dependency on the grid. It is reported that the proposed system decreases the dependency on the grid and reduces the cost of electricity for the house.
References:
1. Alghassab, M.A and Zohdy, M.A., “Geographic based Analysis of a Photovoltaic System in a Residential Setup”, 2016 Universal Technology Management Conference, Bemidji, Minnesota, USA.
2. Asato, B.; Goya, T.; Uchida, K.; Yona, A.; Senjyu, T.; Funabashi, T.; Chul-Hwan Kim, "Optimal operation of smart grid in isolated island," in IPEC, 2010 Conference Proceedings , vol., no., pp.1100-1105, 27-29 Oct. 2010. 3. Charan, V., "Feasibility analysis design of a PV grid
connected system for a rural electrification in Ba, Fiji," in Renewable Energy Research and Application (ICRERA), 2014 International Conference on , vol., no., pp.61-68, 19-22 Oct. 2014.
4. Dakhlallah, T.K.; Zohdy, M.A.; Salim, O.M., "Application of sensor similarity, complementarity and type-2 fuzzy logic to a dynamic security monitoring system," in Aerospace and Electronics Conference (NAECON), Proceedings of the 2011 IEEE National, vol., no., pp.25-31, 20-22 July 2011.
5. Haiming Wang; Ke Meng; Zhao Yang Dong; Zhao Xu; Fengji Luo; Kit Po Wong, "Efficient real-time residential energy management through MILP based rolling horizon optimization," in Power & Energy Society General Meeting, 2015 IEEE , vol., no., pp.1-6, 26-30 July 2015. 6. Kortenbruck, J.; Ortjohann, E.; Leksawat, S.;
Holtschulte, D.; Morton, D., "Advanced control functions for smart grid inverter under asymmetrical conditions," in Renewable Power Generation Conference (RPG 2014), 3rd , vol., no., pp.1-6, 24-25 Sept. 2014. 7. Mahmud, M.A.; Pota, H.R.; Hossain, M.J.; Roy, N.K.,
"Robust Partial Feedback Linearizing Stabilization Scheme for Three-Phase Grid-Connected Photovoltaic Systems," in Photovoltaics, IEEE Journal of , vol.4, no.1, pp.423-431, Jan. 2014.
8. Moriarty, Patrick, and Damon Honnery. "What is the global potential for renewable energy?." Renewable and Sustainable Energy Reviews 16.1 (2012): 244-252.
9. N. Touati-Moungla and V. Jost, "Combinatorial optimization for electric vehicles management''. International Conference on Renewable Energies and Power Quality (ICREPQ 11), April 2011, Las Palmas de Gran Canaria, Spain.
10.P. J. Fontaine, “Shortening the Path to Energy Independence: A Policy Agenda to Commercialize Battery–Electric Vehicles,” The Electricity Journal, Volume 21, Issue 6, July 2008, Pages 22-42, ISSN 1040-6190, 10.1016/j.tej.2008.07.006.
11.Pradhan, A.K.; Kar, S.K.; Mohanty, M.K., "Modeling, simulation and economic analysis of offgrid hybrid renewable power system for an un-electrified village in Odisha," in Electrical, Electronics, Signals, Communication and Optimization (EESCO), 2015 International Conference on, vol., no., pp.1-6, 24-25 Jan. 2015.
12.Salim, O.M.; Zohdy, M.A.; Abdel-Aty-Zohdy, H.; Dorrah, H.T.; Kamel, A.M., "Type-2 fuzzy logic pitch controller for wind turbine rotor blades," in Aerospace and Electronics Conference (NAECON), Proceedings of the 2011 IEEE National, vol., no., pp.32-38, 20-22 July 2011.
13.Tushar, M.H.K.; Assi, C.; Maier, M.; Uddin, M.F., "Smart Microgrids: Optimal Joint Scheduling for Electric Vehicles and Home Appliances," in Smart Grid, IEEE Transactions on, vol.5, no.1, pp.239-250, Jan. 2014 14.Web link:
http://abcnews.go.com/Technology/Traffic/story?id=485 098&page=1 accessed: November 2015.
15.Web link: http://maps.nrel.gov/prospector accessed: November 2015.
16.Web link:
http://www.greencarreports.com/news/1082737_electric-car-efficiency-forget-mpge-it-should-be-miles-kwh accessed: November 2015.
17.Web link: https://eosweb.larc.nasa.gov/sse/ accessed: November 2015.
18.Yoza, A.; Uchida, K.; Yona, A.; Senjyu, T., "Optimal operation of controllable loads in DC smart house with EV," in Renewable Energy Research and Applications (ICRERA), 2012 International Conference on, vol., no., pp.1-6, 11-14 Nov. 2012.
19.Zhi Wu; Suyang Zhou; Jianing Li; Xiao-Ping Zhang, "Real- Time Scheduling of Residential Appliances via Conditional Risk-at-Value," in Smart Grid, IEEE Transactions on , vol.5, no.3, pp.1282-1291, May 2014.
Appendix A
PV (kW) Battery Size (kWh)
Converter
Size (kW) COE ($)
PV Production
(kWh/yr)
Energy Purchased
(kWh/yr)
Energy Sold (kWh/yr)
5 - 4 0.1953 7648.6 16138.9 2845.3
5 - 5 0.1966 7648.6 16138.9 2856.4
5 - 3 0.1968 7648.6 16138.9 2537.3
5 - 6 0.1980 7648.6 16138.9 2856.4
5 - 2 0.2062 7648.6 16161.8 1429.0
3 - 2 0.2079 4589.2 16945.2 825.3
3 - 3 0.2085 4589.2 16945.2 909.2
3 - 4 0.2100 4589.2 16945.2 909.2
3 - 5 0.2114 4589.2 16945.2 909.2
3 - 6 0.2129 4589.2 16945.2 909.2
2 - 2 0.2154 3059.4 17607.8 195.0
Int. J. Adv. Res. Sci. Technol. Volume 5, Issue 1, 2016, pp.536-543.
2 - 1 0.2173 3059.4 17723.8 0.0
2 - 4 0.2184 3059.4 17607.8 195.0
3 - 1 0.2188 4589.2 17253.8 0.0
2 - 5 0.2200 3059.4 17607.8 195.0
2 - 6 0.2215 3059.4 17607.8 195.0
1 - 1 0.2227 1529.7 18789.5 0.0
1 - 2 0.2242 1529.7 18789.5 0.0
1 - 3 0.2258 1529.7 18789.5 0.0
5 1 3 0.2267 7648.6 17075.2 2634.2
5 1 4 0.2270 7648.6 17088.0 2901.6
5 - 1 0.2271 7648.6 16794.1 0.0
1 - 4 0.2273 1529.7 18789.5 0.0
5 1 5 0.2287 7648.6 17024.2 2847.2
1 - 5 0.2288 1529.7 18789.5 0.0
5 1 6 0.2301 7648.6 17028.8 2849.5
1 6 0.2304 1529.7 18789.5 0.0
5 1 2 0.2346 7648.6 16968.1 1463.0
3 1 2 0.2408 4589.2 17904.9 869.6
3 1 3 0.2427 4589.2 17959.8 1006.5
3 1 4 0.2443 4589.2 17965.1 1010.8
3 1 5 0.2458 4589.2 17965.1 1010.8
3 1 1 0.2469 4589.2 17979.5 0.0
3 1 6 0.2473 4589.2 17965.1 1010.8
2 1 1 0.2477 3059.4 18525.9 0.0
2 1 2 0.2505 3059.4 18752.4 391.4
2 1 3 0.2521 3059.4 18765.0 400.9
3 3 1 0.2526 4589.2 17813.0 0.0
3 2 1 0.2529 4589.2 18033.9 0.0
3 4 1 0.2530 4589.2 17653.2 0.0
5 1 1 0.2535 7648.6 17485.5 0.0
3 5 1 0.2536 4589.2 17514.1 0.0
2 1 4 0.2537 3059.4 18765.0 400.9
2 2 1 0.2548 3059.4 18649.5 0.0
2 1 5 0.2552 3059.4 18765.0 400.9
5 2 3 0.2554 7648.6 18156.6 2726.9
5 2 4 0.2558 7648.6 18213.0 3059.1
2 3 1 0.2560 3059.4 18585.3 0.0
2 1 6 0.2567 3059.4 18765.0 400.9
2 4 1 0.2572 3059.4 18528.7 0.0
5 2 5 0.2579 7648.6 18196.3 3071.9
5 4 1 0.2584 7648.6 17037.0 0.0
1 1 1 0.2584 1529.7 19798.4 0.0
5 5 1 0.2584 7648.6 16850.1 0.0
2 5 1 0.2586 3059.4 18494.8 0.0
5 2 1 0.2590 7648.6 17521.4 0.0
5 3 1 0.2596 7648.6 17364.3 0.0
5 2 6 0.2600 7648.6 18189.9 3055.7
5 2 2 0.2616 7648.6 17789.0 1457.5
1 1 2 0.2618 1529.7 19924.9 93.9
1 1 3 0.2633 1529.7 19924.9 93.9
1 1 4 0.2648 1529.7 19924.9 93.9
1 1 5 0.2664 1529.7 19924.9 93.9
1 2 1 0.2674 1529.7 20069.5 0.0
1 1 6 0.2679 1529.7 19924.9 93.9
Int. J. Adv. Res. Sci. Technol. Volume 5, Issue 1, 2016, pp.536-543.
PV (kW) Battery Size (kWh)
Converter
Size (kW) COE ($)
PV Production (kWh/yr)
Energy Purchased
(kWh/yr)
Energy Sold (kWh/yr)
1 5 1 0.2709 1529.7 20063.5 0.0
5 3 4 0.2713 7648.6 18896.9 3095.9
5 3 5 0.2719 7648.6 18913.1 3192.2
5 3 6 0.2727 7648.6 18943.1 3228.3
3 2 2 0.2727 4589.2 19079.0 958.4
3 2 3 0.2738 4589.2 19186.0 1228.5
5 3 3 0.2745 7648.6 18856.5 2678.5
3 2 4 0.2749 4589.2 19191.0 1252.3
5 3 2 0.2752 7648.6 18190.1 1435.0
3 2 5 0.2764 4589.2 19193.4 1253.8
3 2 6 0.2779 4589.2 19193.4 1253.8
5 4 2 0.2798 7648.6 18251.1 1389.2
2 2 2 0.2826 3059.4 20072.9 658.8
5 5 2 0.2837 7648.6 18377.3 1366.1
2 2 3 0.2849 3059.4 20139.5 719.6
2 2 4 0.2864 3059.4 20139.5 719.6
3 3 2 0.2879 4589.2 19695.3 1030.2
2 2 5 0.2879 3059.4 20139.5 719.6
2 2 6 0.2894 3059.4 20139.5 719.6
3 4 2 0.2897 4589.2 19701.3 1006.3
3 5 2 0.2910 4589.2 19715.9 1013.7
3 3 3 0.2921 4589.2 20035.1 1395.7
3 3 4 0.2931 4589.2 20035.5 1428.5
3 3 5 0.2945 4589.2 20035.5 1428.9
3 3 6 0.2960 4589.2 20035.5 1428.9
2 3 2 0.2974 3059.4 20717.7 815.7
1 2 2 0.2978 1529.7 21514.9 507.7
2 4 2 0.2991 3059.4 20751.4 825.8
1 2 3 0.2993 1529.7 21515.0 506.9
2 5 2 0.3001 3059.4 20757.1 835.5
1 2 4 0.3008 1529.7 21515.0 506.9
5 5 3 0.3016 7648.6 19966.9 2703.7
1 2 5 0.3024 1529.7 21515.0 506.9
5 4 3 0.3030 7648.6 20203.6 2907.5
2 3 3 0.3031 3059.4 20974.7 900.6
1 2 6 0.3039 1529.7 21515.0 506.9
2 3 4 0.3048 3059.4 20996.8 910.8
2 3 5 0.3063 3059.4 20996.8 910.8
2 3 6 0.3078 3059.4 20996.8 910.8
5 4 5 0.3079 7648.6 21134.8 4102.5
5 4 6 0.3083 7648.6 21062.1 4108.0
5 4 4 0.3088 7648.6 21188.1 3922.8
3 5 3 0.3108 4589.2 20893.7 1628.2
1 3 2 0.3124 1529.7 22256.1 744.6
1 4 2 0.3138 1529.7 22265.9 745.2
1 5 2 0.3152 1529.7 22286.1 759.9
3 4 3 0.3194 4589.2 21652.2 2039.7
1 3 3 0.3199 1529.7 22592.2 854.7
1 3 4 0.3214 1529.7 22592.2 854.7
1 3 5 0.3229 1529.7 22592.2 854.7
2 5 3 0.3233 3059.4 21874.6 1144.6
1 3 6 0.3244 1529.7 22592.2 854.7
5 5 4 0.3267 7648.6 23220.1 5040.1
5 5 5 0.3277 7648.6 23797.9 5719.2
Int. J. Adv. Res. Sci. Technol. Volume 5, Issue 1, 2016, pp.536-543.
5 5 6 0.3280 7648.6 23786.3 5809.0
3 4 5 0.3292 4589.2 22485.7 2598.2
1 5 3 0.3297 1529.7 22764.6 753.4
3 4 6 0.3306 4589.2 22485.7 2598.2
2 4 3 0.3327 3059.4 22886.6 1741.1
2 4 4 0.3420 3059.4 23842.3 2344.8
2 4 5 0.3434 3059.4 23842.3 2344.8
2 4 6 0.3448 3059.4 23842.3 2344.8
3 5 4 0.3453 4589.2 24626.9 3868.4
1 4 3 0.3496 1529.7 24771.0 1893.5
3 5 5 0.3498 4589.2 25250.8 4300.3
3 5 6 0.3511 4589.2 25250.8 4300.3
1 4 4 0.3576 1529.7 25535.5 2338.2
1 4 5 0.3590 1529.7 25535.5 2338.2
1 4 6 0.3604 1529.7 25535.5 2338.2
2 5 4 0.3608 3059.4 26301.9 3828.5
2 5 5 0.3644 3059.4 26711.9 4089.0
2 5 6 0.3657 3059.4 26711.9 4089.0
1 5 4 0.3769 1529.7 28269.9 3999.9
1 5 5 0.3805 1529.7 28772.1 4328.2