RESEARCH ARTICLE
The Long-Term Impacts of Short-Term
Professional Development: Science Teachers
and Evolution
Minsu Ha
1, Brian C Baldwin
2and Ross H Nehm
3,4*Abstract
Background: Although a large body of work in science education has established the pervasive problem of science teachers’ alternative conceptions about evolution, knowledge deficits, and anti-evolutionary attitudes, only a handful of interventions have explored the mitigation of these issues using professional development (PD) workshops, and not a single study to our knowledge has investigated if positive outcomes are sustained long after program comple-tion. The central aim of our study was to investigate the long-term consequences of an intensive, short-term profes-sional development program on teachers’ knowledge of evolution, acceptance of evolution, and knowledge of the nature of science (NOS).
Methods: Program efficacy was examined using a pre-post, delayed post-test design linked to quantitative measures of teacher knowledge, performance (explanatory competence), and acceptance using published instruments shown to generate reliable and valid inferences.
Results: Our study is the first to report sustained large effect sizes for both knowledge of evolution, NOS, and accept-ance change ~1.5 years after program completion. Concordant with other measures, teacher self-reports indicated that the PD program had lasting effects.
Conclusions: Our study suggests that short-term PD built using specific research-based principles can have lasting impacts on teachers’ evolutionary knowledge and acceptance. Because evidence of sustained knowledge and belief change is prerequisite to downstream classroom studies (e.g., impacts on student learning), retention of evolution-ary knowledge improvements and acceptance change emerge as central, but previously unstudied, components of teacher evolution PD.
Keywords: In-service teachers, Professional development, Evolution, Assessment, Knowledge and belief retention
© 2015 Ha et al. This article is distributed under the terms of the Creative Commons Attribution 4.0 International License (http:// creativecommons.org/licenses/by/4.0/), which permits unrestricted use, distribution, and reproduction in any medium, provided you give appropriate credit to the original author(s) and the source, provide a link to the Creative Commons license, and indicate if changes were made.
Background
Evolution is universally recognized as a “core idea” in the life sciences by scientific and educational organizations (e.g., NSTA, NARST, AAAS), policy and standards docu-ments (e.g., AAAS 1999, NRC 2012), and most US state standards. Although many policy and standards docu-ments have attempted to bolster support for the teach-ing of evolution in schools, such efforts have little value if educators do not follow them; that is, if teachers refuse
to teach evolution, project antipathy or ambivalence towards evolution to their students, or directly teach non-scientific alternatives to evolution (Moore 2002; Sickel and Friedrichsen 2013). Further diminishing the potential impacts of these important policy documents, many teachers who embrace state or national standards nevertheless have a weak grasp of evolutionary concepts, are partial to common alternative conceptions about the nature of science (NOS), natural selection, and/or earth science, or are not positioned to suppress community and cultural pressures to teach non-scientific alterna-tives to evolution (Berkman and Plutzer 2011; Brem et al. 2003; Gregory 2009; Nehm and Schonfeld 2007; Sickel
Open Access
*Correspondence: [email protected]
3 Center for Science and Mathematics Education, Stony Brook University
and Friedrichsen 2013). Teacher education and profes-sional development about evolution are widely recog-nized as the critical link between the goals enumerated in numerous policy documents and standards on the one hand, and persistent public confusion and disbelief about this core scientific concept on the other (Berkman and Plutzer 2011; Nehm and Schonfeld 2007; Sickel and Frie-drichsen 2013).
Evolution Professional Development
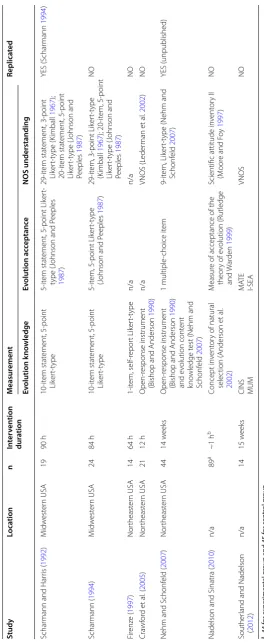
Although a very large body of work has focused on sci-ence teachers’ knowledge, alternative conceptions, acceptance of evolution, religious conflict with teach-ing evolution, and the relationships among these vari-ables (see Smith 2010; Sickel and Friedrichsen 2013, for excellent reviews), only a small number of interven-tion studies attempting to address these issues occur in the peer-reviewed literature (see Table 1). Scharmann and Harris (1992), for example, documented several important findings in a study of a 3-week teacher PD program: improved understanding of NOS, evolution-ary principles, and acceptance of evolution; and reduced anxiety about teaching evolution in secondary science classrooms. In a follow-up study (Scharmann and Har-ris 1992) with a subset of participants (less than half of the original sample), no significant changes were found in these outcomes. Scharmann (1994) also demonstrated that a 2-week summer institute focusing on evolution helped science teachers to improve their acceptance of evolution and understanding of NOS. As in his previ-ous study with Harris, Scharmann (1994) found that the summer institute reduced participants’ self-reported anxieties about teaching evolution. While the results of these studies from nearly 20 years ago were very promis-ing, and provide evidence for the efficacy of short-term interventions, the measures used to substantiate learn-ing gains and acceptance levels have not been widely used in evolution education, making it difficult to align these results with most work in evolution education (see Table 1). Second, it is not clear if the small subset of par-ticipants (n = 9) who chose to complete the follow-up study were representative of the entire sample. Finally, the intervention did not appear to directly measure teachers’ knowledge of evolution.
Firenze (1997) studied the effects of a 2-week inter-vention on New York science teachers’ knowledge and perceptions of evolution. Firenze’s intervention included content lectures, pedagogical practice, group work, laboratory work, field trips, and multi-media presenta-tions. He used interviews, questionnaires, observations, and statistical methods to examine the efficacy of the program. However, Firenze used self-report measures (rather than objective measures) of teachers’ knowledge
and teaching ability. The self-report data revealed that teachers felt that they had more knowledge, more self-confidence, and more enthusiasm for evolution after completing the 2-week program. In addition, the pro-gram appeared to help the teachers find ways to use evo-lutionary theory as an overarching theme in their classes. Crawford et al. (2005) examined the efficacy of tech-nology-enhanced instruction on improving prospective science teachers’ knowledge of evolution and the nature of science. The qualitative data from their research dem-onstrated that prospective teachers possessed increased understanding of evolution and NOS despite initial alternative conceptions. No follow-up studies were conducted.
Nehm and Schonfeld (2007), studying teachers from New York, reported that their semester-long intervention with >40 science teachers also produced significant and meaningful gains in teachers’ knowledge of evolutionary concepts, reductions in common alternative conceptions, and more informed views of NOS. The authors found that, while the intervention had a significant impact upon knowledge and a reduction in alternative conceptions, there was only a modest improvement in overall evolu-tionary acceptance levels. At the end of the study, many teachers who improved their knowledge remained partial to teaching both evolution and creationism. No follow-up studies were conducted.
More recently, Nadelson and Sinatra (2010) conducted a very short-term experimental intervention (last-ing <2 h) to examine whether improved understand(last-ing of situations of chance and NOS could produce posi-tive learning outcomes. The experimental and control group received an online tutorial about common alter-native conceptions of evolution and NOS; the experi-mental group also received an online tutorial about uncertainty in the context of evolution; and the control group received an online tutorial about the life and trav-els of Charles Darwin. Overall, Nadtrav-elson and Sinatra found that their intervention failed to improve teach-ers’ knowledge of evolution, understanding of NOS, and situations of uncertainty relating to evolution, but it did improve participants’ acceptance of evolution. How-ever, there was not a significant difference in improving acceptance of evolution between the experimental and control groups. The durability of these changes were not examined.
Table 1 S elec ted in ter ven
tion studies with scienc
e t eacher par ticipan ts fr om the lit er atur e
a 44 f
or e
xper
imen
tal g
roup and 45 f
or c on tr ol g roup .
b 1.5 h c
onsist
ed of both instruc
tion and pr
e-/post -t esting . Study Loca tion n In ter ven tion dur ation M easur emen t Replica ted Ev olution k no wledge Ev olution ac ceptanc e NOS understanding Schar
mann and Har
ris ( 1992 ) M idw est er n USA 19 90 h 10-it em stat ement, 5-point Lik er t-t ype 5-it em stat
ement, 5-point Lik
er
t-type (
Johnson and P
eeples 1987 ) 29-it em stat ement, 3-point Lik er t-t ype (K imball 1967 ); 20-it em stat ement, 5-point Lik er t-t ype ( Johnson and Peeples 1987 ) YES (S char mann 1994 ) Schar mann ( 1994 ) M idw est er n USA 24 84 h 10-it em stat ement, 5-point Lik er t-t ype 5-it
em, 5-point Lik
er
t-t
ype
(J
ohnson and P
eeples
1987
)
29-it
em, 3-point Lik
er t-t ype (K imball 1967 ); 20-it em, 5-point Lik er t-t ype ( Johnson and Peeples 1987 ) NO Fir enz e ( 1997 ) Nor theast er n USA 14 64 h 1-it em, self-r epor t Lik er t-t ype n/a n/a NO Cra wf or d et al . ( 2005 ) Nor theast er n USA 21 12 h Open-r esponse instrument
(Bishop and Anderson
1990 ) n/a VNOS (L eder man et al . 2002 ) NO
Nehm and S
chonf eld ( 2007 ) Nor theast er n USA 44 14 w eeks Open-r esponse instrument
(Bishop and Anderson
1990 ) and e volution cont ent kno wledge t
est (Nehm and
Schonf eld 2007 ) 1 multiple -choice it em 9-it em, Lik er t-t
ype (Nehm and
Schonf
eld
2007
)
YES (unpublished)
Nadelson and Sinatra (
2010 ) n/a 89 a ~1 h b Concept in vent or
y of natural
selec tion ( Anderson et al . 2002 ) M easur
e of acceptance of the
theor
y of e
volution (Rutledge and W ar den 1999 )
Scientific attitude in
vent
or
y II
(M
oor
e and F
oy
1997
)
NO
Souther
land and Nadelson
of measures related to evolution, such as the MATE, VNOS, CINS, I-SEA, and MUM to self-evaluate their own achievements throughout the course (that is, the assessments were part of the course instruction). The results from their intervention (with 14 pre- and in-ser-vice biology teachers) showed that 85.7% improved their understanding of microevolution, 78.6% improved their understanding of macroevolution, 64.3% improved their acceptance of evolution, 71.4% improved their acceptance of human evolution, and 92.9% acquired a more informed understanding of NOS. As with many of the previous studies, no delayed post-tests were administered.
Building upon this small body of work on teacher evo-lution education is challenging for several reasons. First, in cases where the same general topics were conducted (e.g., NOS), different instruments were used, and the descriptions of the instruments suggest that they may not measure the same facets of the construct of interest (e.g., the VNOS vs. the ENOS vs. the Kimball test vs. the Sci-entific Attitude Survey II; Table 1). Second, some of the studies used recall-based assessments to measure aspects of teacher understanding (e.g., Crawford et al. 2005) whereas other studies used recognition-based multiple-choice assessments (e.g., Nadelson and Sinatra 2010); these two types of measures capture different aspects of knowledge (Opfer et al. 2012). Third, the duration (e.g., less than 2 h vs. one semester) and teacher sample sizes (e.g., 14 vs. 89) varied greatly across studies. Fourth, some of the measures that were used in the studies indirectly measured impact (e.g., self-perceptions of change: Firenze
1997; perceptions of NOS: Nadelson and Sinatra 2010)
whereas other studies directly measured change (e.g., NOS: Scharmann 1994). Fifth, different types of research approaches characterized this body of work (e.g., mixed-methods vs. quantitative, comparison group vs. pre-post only). In sum, although the empirical work on teacher education related to evolution makes generalizations difficult because of different: (1) instructional foci; (2) measures of efficacy; (3) durations; (4) sample sizes and characteristics (pre-service vs. in-service); and (5) inter-vention types and study designs, many promising find-ings have emerged.
In addition to methodological differences among the evolution intervention studies that have been published, consistent outcomes (in cases where the same topics were targeted) were not found. For example, some stud-ies reported that instructional treatments did not mean-ingfully affect teacher evolution acceptance levels, even in cases in which large learning gains were found (e.g., Nehm and Schonfeld 2007), whereas others have demon-strated significant changes in acceptance but not knowl-edge (e.g., Nadelson and Sinatra 2010). Thus, it remains to be established: (1) what outcomes—knowledge change,
acceptance change, both, or neither—should be antici-pated or considered attainable in PD interventions; (2) how much time [e.g., ~1 h in Nadelson and Sinatra (2010) vs. ~84 h in Scharmann and Harris (1992)] is realistically needed to achieve meaningful change (i.e., large effect sizes); and (3) whether any interventions have effects that persist beyond the last day of the intervention program (i.e., durability).
In summary, the small body of work on teacher edu-cation interventions relating to evolution is very hetero-geneous in almost every aspect, and, perhaps as a result of such heterogeneity, the only consistent finding is that statistically significant changes can be observed immedi-ately after some instructional targets (e.g., NOS, accept-ance). Simply put, we do not know if evolution-focused teacher education classes or PD will typically produce significant changes in knowledge or acceptance, by how much, or why. More importantly, we have no robust empirical evidence that any of the studies we reviewed had a lasting impact (>1 year) on teacher knowledge or acceptance levels (notably, however, Scharmann and Harris did report sustained change in a small subset of 9 teachers from their original sample). The lack of a robust evidence base on knowledge and belief retention in particular motivated our current work on teacher pro-fessional development relating to evolution; if positive impacts are temporary, they are unlikely to impact stu-dent learning in the long run.
Knowledge and Belief Retention
important but unanswered question is: How durable are knowledge and belief changes achieved in evolution PD?
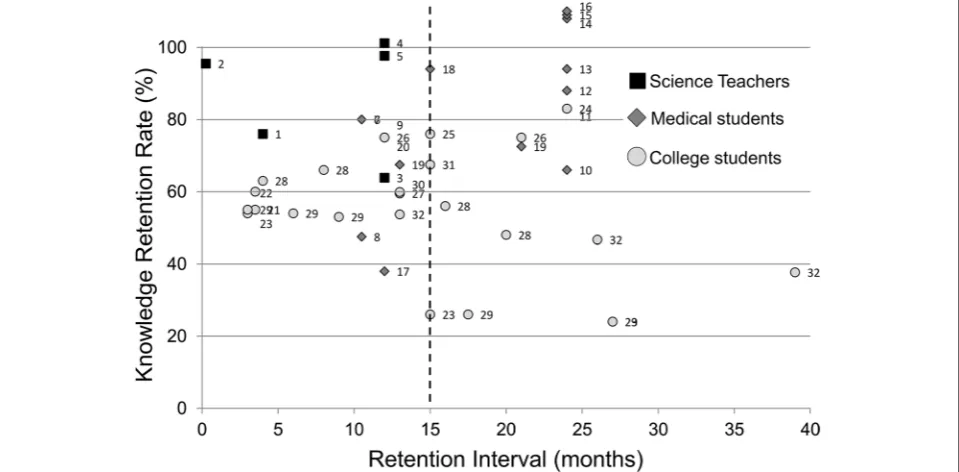
Other than Scharmann and Harris’s (1992) study on PD retention effects, no work to our knowledge has exam-ined the durability of evolution knowledge and belief changes achieved through PD. Nevertheless, there is a fairly large and diverse literature about science learning retention rates in other participant populations that mer-its attention. Fig. 1 summarizes empirical data on knowl-edge retention rates for teachers, medical students, and college students over time. Several patterns are apparent: (1) a paucity of quantitative research on teachers’ knowl-edge retention (compared to the number of studies on medical student and undergraduate science learning); (2) occasional decreases of knowledge retention over time for most groups; (3) several studies on medical students illustrating very high knowledge retention rates; and (4) knowledge retention rate varies by domain (e.g., general science vs. biochemistry).
While empirical research has shown that learners often gain knowledge after instruction but sometimes
forget what they learned (Fig. 1), the empirical litera-ture on teachers’ belief retention is much more ambigu-ous (see Jones and Carter 2007, Sickel and Friedrichsen 2013). Many important theoretical arguments, however, have been advanced for the importance of “worldviews” on knowledge and belief (see, for example, Cobern 1996; El-Hani and Mortimer 2007; Smith and Siegel 2004 for reviews and discussion of worldviews). In line with the-oretical arguments, many empirical studies have shown that acceptance change may be more difficult to achieve than knowledge gain. For example, Nehm and Schonfeld (2007) reported that the vast majority of science teach-ers who participated in a 14-week intervention on evo-lution significantly increased knowledge of evoevo-lution and NOS but still preferred teaching some amount of crea-tionism. In contrast, Scharmann and Harris (1992) and Scharmann (1994) reported that a short-term teacher PD program on evolution and NOS improved teach-ers’ acceptance of evolution. Despite the lack of a large research base on intervention effects on evolution-ary acceptance, research has shown that beliefs are an
Fig. 1 Review of knowledge retention patterns in the literature (citations from Custers 2010; Semb and Ellis 1994, NCOSP, personal communica-tion; full references in this legend can be found in the Custers (2010) and Semb and Ellis (1994)). The dashed line represents the time point at which
our study examined teacher knowledge and belief retention. Knowledge Retention Rates (KRR) were calculated using the equation KRR = Delayed
important predictor of instructional emphasis on evolu-tion (e.g., Berkman and Plutzer 2011; Moore 2007, 2008; Nehm and Schonfeld 2007). In sum, durability of knowl-edge and belief change is a centrally important—but under-researched—aspect of research on science teach-ers and evolution.
Research Design and Questions
Building upon findings from the intervention studies reviewed above, and employing the most widely used and robust measurement instruments available, we developed a research-based, short-term teacher professional devel-opment program about evolution and the nature of sci-ence for New Jersey (USA) teachers.
We investigated four overarching research questions:
1. What magnitudes (i.e., effect sizes) of evolution knowledge and acceptance change can be achieved in a short-term teacher professional development (PD) program?
2. How closely associated are learning gains for evolu-tion content knowledge and learning gains for the nature of science (NOS)? Are these learning gains associated with acceptance change?
3. How durable are knowledge and belief changes 15 months after the PD program?
4. What effect did teachers think the PD program had on them?
Science Teacher Professional Development
While many different models of teacher professional development have been proposed in the literature (e.g., Bell and Gilbert 1996; Borko et al. 2008; Desi-mone 2009; Franke et al. 2001; Joyce and Showers 1988;
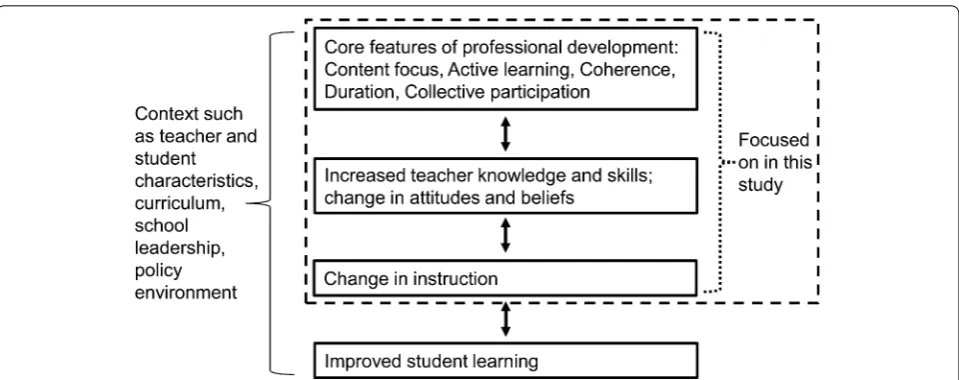
Loucks-Horsley et al. 1998; Supovitz and Turner 2000), we situate our study within Desimone’s (2009) conceptual framework (Fig. 2). In our view, a major strength of this model is that it provides a parsimonious, broadly applica-ble, birds-eye view of PD, encompassing the core features most salient to the education of teachers and their stu-dents. In brief, Desimone’s model encompasses “…inter-active, non-recursive relationships between the critical features of professional development, teacher knowledge and beliefs, classroom practice, and student outcomes.” Desimone’s (2009, p. 184–185) ‘theory of action’ for pro-fessional development maps putative causal pathways linking four central features (Fig. 2): that ‘(1) teachers experience effective professional development; (2) profes-sional development increases teachers’ knowledge, skills, attitudes, and beliefs; (3) teachers use their new knowl-edge, skills, attitudes, and beliefs to improve instruction and/or their approach to pedagogy; and (4) instructional changes foster increased student learning.’ While this model is domain-general and has not been tested with causal research designs, it represents a consensus model built on a large body of empirical literature and compara-tive study findings and may provide a framework for syn-thesizing a broad array of educational research studies relating to PD (Desimone 2009, p. 185).
Our PD intervention included the five critical features of professional development in Desimone’s (2009) model (Fig. 2): content focus (cross-cutting focus on evolu-tion and NOS); active learning (inquiry-based activi-ties); coherence (alignment with NJ State Standards and district goals); duration (the equivalent of one graduate class); and collective participation (student-centered instruction and collaborative learning) (Table 2). These features are in close alignment with what has been
written regarding the design of effective professional development opportunities for science teachers (e.g., Duschl et al. 2007; Loucks-Horsley et al. 1998; Supovitz and Turner 2000) and evolution education (reviewed in Nehm and Schonfeld 2007; Sickel and Friedrichsen 2013).
For in-service teachers, summer professional develop-ment programs have been commonly used to augdevelop-ment teachers’ knowledge and improve their pedagogical prac-tices. Our PD project differed from such models in that it consisted of a combination of a content-based sum-mer workshop and academic-year, in-school curricu-lum topic study workshops. The State-funded PD also mandated the participation of many teachers from a few districts—echoing strategies for successful professional
development through local systemic change (Banilower et al. 2007).
We developed and implemented a professional devel-opment model with a structured emphasis on strength-ening NJ science teachers’ understanding of the revised State content standards relating to the nature of science and evolution, in line with the school districts’ efforts to improve student learning in these content areas. This approach is consistent with Desimone’s (2009) notion of “coherence” (see above). The implementation plan also paid careful attention to well-documented strate-gies for successful PD implementation (Loucks-Horsley et al. 1998): providing ample opportunities for partici-pant teachers to shape the content of their professional
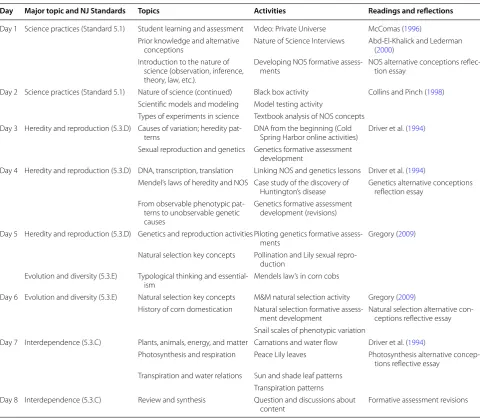
Table 2 Overview of the NJ State Standards, intervention topics, activities, and readings used in the teacher professional development workshop
Day Major topic and NJ Standards Topics Activities Readings and reflections
Day 1 Science practices (Standard 5.1) Student learning and assessment Video: Private Universe McComas (1996)
Prior knowledge and alternative
conceptions Nature of Science Interviews Abd-El-Khalick and Lederman (2000)
Introduction to the nature of science (observation, inference, theory, law, etc.).
Developing NOS formative
assess-ments NOS alternative conceptions reflec-tion essay
Day 2 Science practices (Standard 5.1) Nature of science (continued) Black box activity Collins and Pinch (1998)
Scientific models and modeling Model testing activity
Types of experiments in science Textbook analysis of NOS concepts
Day 3 Heredity and reproduction (5.3.D) Causes of variation; heredity
pat-terns DNA from the beginning (Cold Spring Harbor online activities) Driver et al. (1994)
Sexual reproduction and genetics Genetics formative assessment development
Day 4 Heredity and reproduction (5.3.D) DNA, transcription, translation Linking NOS and genetics lessons Driver et al. (1994)
Mendel’s laws of heredity and NOS Case study of the discovery of
Huntington’s disease Genetics alternative conceptions reflection essay
From observable phenotypic pat-terns to unobservable genetic causes
Genetics formative assessment development (revisions)
Day 5 Heredity and reproduction (5.3.D) Genetics and reproduction activities Piloting genetics formative
assess-ments Gregory (2009)
Natural selection key concepts Pollination and Lily sexual
repro-duction
Evolution and diversity (5.3.E) Typological thinking and
essential-ism Mendels law’s in corn cobs
Day 6 Evolution and diversity (5.3.E) Natural selection key concepts M&M natural selection activity Gregory (2009)
History of corn domestication Natural selection formative
assess-ment developassess-ment Natural selection alternative con-ceptions reflective essay
Snail scales of phenotypic variation
Day 7 Interdependence (5.3.C) Plants, animals, energy, and matter Carnations and water flow Driver et al. (1994)
Photosynthesis and respiration Peace Lily leaves Photosynthesis alternative
concep-tions reflective essay
Transpiration and water relations Sun and shade leaf patterns
Transpiration patterns
Day 8 Interdependence (5.3.C) Review and synthesis Question and discussions about
development, and creating a forum for teachers to reflect upon their experiences and pedagogical and curricular practices.
Our PD design specifically focused on using structured opportunities for improving teachers’ content knowledge and pedagogical content knowledge through the use of workshops. The implementation strategy of using work-shops and seminars in professional development has cer-tain assumptions regarding its usefulness: first, external knowledge is viewed as valuable; second, learning out-side of the work environment allows in-depth study and practice needed for success; and third, one size can fit all (Loucks-Horsley et al. 1998). In order to translate the broad topics of content, active learning, coherence, and collective participation, pedagogical and content experts (education and biology faculty) from both the home insti-tution and another university designed 2 weeks of all-day workshops that focused on the development of the follow-ing core content areas: Science practices/the nature of sci-ence; Organization and development; Interdependsci-ence; Heredity and reproduction; and Evolution and diversity. Evolution and the nature of science were central, cross-cutting themes throughout the entire workshop.
Finally, the PD program was carefully designed using lessons learned and key strategies suggested in the sci-ence education literature, including: (1) a strong con-tent focus (Desimone 2009; Supovitz and Turner 2000; Sickel and Friedrichsen 2013); (2) explicit discussions of the nature of science (NOS) and associated NOS alter-native conceptions (Scharmann and Harris 1992; Sickel and Friedrichsen 2013); (3) reflective consideration of the relationships between science and religion (Smith and Scharmann 2008); (4) inquiry-based instruction in evolutionary concepts (Desantis 2009); and (5) explicit engagement with common alternative conceptions about natural selection and evolution using inquiry activities (Nehm and Schonfeld 2007).
It is important to mention that other professional devel-opment models (such as Loucks-Horsley et al. 1998) have similar frameworks in terms of common goals and charac-teristics (such as: shared understanding of effective class-room pedagogy; opportunities for teachers to learn content in a similar manner as their students; and, continuous reflection and assessment of professional development). Our model of PD incorporates these common princi-ples of successful development, and so it is likely that our design could also be successful within one of the other well-accepted paradigms of science professional development.
Participants and Methods Sample
Participants in the study voluntarily enrolled in a 10-day intensive (9 am–5 pm) teacher PD program in New
Jersey (8 days involved interactive instruction, and 2 days involved collaborative project and assignment work). Participants totaled 28 teachers, including eighteen ele-mentary school teachers (i.e., K-6) and 10 secondary sci-ence teachers (i.e., 7–12). The majority of participants (24) were female. They all reported that they took science courses in college, and that they taught science-related courses in the State of New Jersey. All participants remained in the teaching profession during the 1.5 years of our study.
We were concerned that elementary and secondary sci-ence teachers might differ in core background variables given differences in, for example, pre-service teacher preparation. However, we did not find significant or meaningful differences in pre-test scores for these two groups (p > 0.05 for pre-CINS, pre-misconception scores, pre-MATE scores and p > 0.01 for pre-KC scores). Given similar levels of prior knowledge and acceptance of evo-lution, we combined both elementary and secondary teachers into one sample in our analyses.
Study Design
We used a pre-post-delayed post-test, mixed-methods research design to investigate the impact of the profes-sional development program on in-service science teach-ers’ content knowledge and acceptance of evolution. Given the nature of the State-sponsored Math Science Partnership (MSP) summer professional development program, we were not able to establish a comparison group or randomize subjects to treatment and control conditions. Consequently, our study design prohibits making causal claims but does provide rich information on associations between the intervention and knowl-edge and acceptance change. In order to measure puta-tive knowledge and attitude change, we employed several instruments that have been shown to generate reliable and valid inferences in comparable populations (see below). The instruments were administered at the begin-ning and end of the professional development program. Nearly all teachers completed the instruments (but com-pletion rates differed slightly among instruments).
Evolution Knowledge Measures: Multiple‑Choice
using 20 items (Anderson et al. 2002). Despite displaying some psychometric problems at a fine-grained level (Bat-tisti et al. 2010; Nehm and Schonfeld 2010), the CINS is generally recognized as a tool that generates valid infer-ences about overall evolutionary knowledge. Each item of the CINS has one correct response and several alterna-tive conception distractors. The total score of the CINS instrument therefore ranges from 0 to 20. We employed all 20 CINS items in the pre- and post-test while we employed a part of the CINS test (8 items) for the delayed post-test. This was done in order to minimize the length of the test and maximize participation completion rates.
The original CINS paper suggests that the instrument was designed to measure knowledge of natural selection, but additional concepts are present, such as speciation. Many authors consider speciation to be a macroevo-lutionary concept (Futuyma 2009). For this reason, we consider the CINS to test both microevolutionary and macroevolutionary knowledge. For our sample, the relia-bility of the CINS (measured using Cronbach’s alpha) was (pre-test) 0.84, (post-test): 0.88, and (delayed post-test): 0.61. The lower values for the delayed post-test are not surprising given that fewer items were used.
The twenty items in CINS consist of 10 natural selec-tion concepts (biotic potential, natural resources, popu-lation stability, change in a popupopu-lation, limited survival, origin of variation, variation inheritable, origin of species, variation within a population, and differential survival) using three different contexts (the evolution of finches, guppies, and lizards). The three different contextual parts of CINS each cover a different number of concepts (finches: 8 concepts, guppies: 5 concepts, and lizards: 7 concepts). In addition, because the ‘lizards’ part consists of both ‘origin of variation’ and ‘variation within a popu-lation’, which are both part of the concept of variation, the actual number of concepts that the “lizard” section covers is six. Therefore, the construct coverage of the Finches section (8 different concepts) is the most complete sec-tion of the three-part CINS. To test the reliability of the abbreviated CINS (the ‘finches’ section: items 1–8 of the CINS), we administered the CINS to 46 pre-service teachers and advanced majors and found very strong cor-relation coefficients between the score of ‘finches’ part (1–8) and the score of ‘guppies + lizards’ part (r = 0.851, 95% CI 0.745–0.915). The correlation coefficient between the ‘finches’ section and the total CINS was very robust (0.932).
In addition to the reliability of the abbreviated CINS, we also examined the reliability of CINS for pre-service science teachers. Several empirical studies used the CINS to measure pre-service and in-service K-12 teachers’ knowledge of natural selection (Ha et al. 2012; Nadelson and Sinatra 2009, 2010). Ha et al. (2012) used the CINS
to measure 124 biology pre-service teachers’ natural selection knowledge and found an acceptable reliability (Cronbach’s alpha: 0.737). In addition, this study showed that the CINS was able to discriminate biology pre-ser-vice teachers’ academic levels (i.e., years in the program; F = 3.228, p < 0.025, partial eta squared = 0.075). Nadel-son and Sinatra (2010) also used the CINS to measure elementary, middle school, and secondary pre-service teachers. This study also reported acceptable Cronbach’s alpha values (0.63) for the CINS. Nadelson and Sinatra (2009) also collected CINS data from educational pro-fessionals, 53.7% of whom reported science-teaching experience. The study showed adequate reliability (KR20 = 0.64). Thus, the CINS appears to have gener-ated reliable inferences, and, based on its relationship to academic level, it is seen to have a degree of predictive validity in the context of measuring teachers’ knowledge of natural selection concepts.
Evolution Knowledge Measures
The second instrument that we used to measure teachers’ knowledge of evolution was the constructed-response ACORNS (Assessment of COntextual Reasoning about Natural Selection) instrument (Nehm et al. 2012). The ACORNS is a modified and expanded version of Bishop and Anderson’s (1990) widely used instrument. Detailed studies of validity and reliability inferences were reported in the original studies (Nehm et al. 2012). We used four isomorphic ACORNS items differing in surface features (e.g., animal vs. plant, trait gain vs. trait loss) to assess teacher knowledge in the pre- and post-test. For the delayed post-test, we used two ACORNS items (one trait gain, one trait loss).
The format of the ACORNS items was: “A species of X [plants or animals] lacks Y. How would biologists explain how a species of X [with or without] Y evolved from an ancestral X species [without or with] Y?” (X = Snail/ Rose/Penguin/Elm and Y = poison/thorns/flight/winged seeds). The ACORNS is considered to be a test of both microevolutionary and macroevolutionary knowledge because it asks students to explain the mechanisms that caused between-species (i.e., macroevolutionary) trait change. ACORNS responses were scored using the rubrics of Nehm et al. (2010). The rubrics include detailed scoring information for seven key concepts (accurate ideas) and six alternative conceptions or naïve ideas. Key Concept (KC) scores for each item ranged from 0 to 7, and alternative conception scores ranged from 0 to 6. Thus, the maximum KC score across all four items was 28, and the maximum alternative conception score was 24.
coherence, which refers to the consistency of explana-tory concept use across items (in our case, the ACORNS items). Coherence of knowledge represents the stability of a concept across contexts (Kampourakis and Zogza 2009). KC and alternative conception scores were also used to categorize teachers’ reasoning patterns as: explicitly scientific explanations, mixed explanations (naïve + scientific), explicitly naïve, or no clearly articu-lated or comprehensible idea (e.g., the teacher answered by rephrasing the question).
Two raters independently scored the ACORNS responses; one was a Ph.D. student in biology education and the other was a biologist. Kappa values for inter-rater agreement were >0.8 for all KCs and alternative concep-tions. Consensus scores were established in all cases of disagreement. Reliabilities for the ACORNS were meas-ured using Cronbach’s alpha. Strong reliabilities were found for KCs (0.865 pre-test and 0.853 post-test) but weaker reliabilities were found for alternative concep-tions (0.557 pre-test and 0.383 post-test). The reliabilities for the delayed post-test were 0.72 for KCs and 0.76 for alternative conceptions. Other studies have also noted that alternative conceptions are very context dependent (Nehm and Ridgway 2011; Nehm and Ha 2011), which explains the low internal reliability measures for alterna-tive conceptions in our sample; students and teachers use different alternative conceptions depending on the item features, and so reliabilities of items designed to elicit dif-ferent types of alternative conceptions in the same indi-vidual are not expected to be high. Given the reliability information in this study, our analyses used the sum of the key concept scores across the four items but analyzed the four alternative conception scores individually.
Measures of Evolution Acceptance
We measured teachers’ acceptance of evolutionary the-ory using the MATE (Measure of the Acceptance of the Theory of Evolution) (Rutledge and Warden 1999). The MATE consists of 20 items covering six concepts, which include the process of evolution, the scientific validity of evolutionary theory, and the nature of science. The MATE instrument items are on a five-point Likert scale (strongly agree to strongly disagree). MATE scores were transformed into a 100-point scale so that we could compare our results with previously published studies. Prior studies have used the MATE on elementary, mid-dle school, and secondary science teachers. Nadelson and Sinatra (2010), for example, used the MATE on a mixed sample of elementary, middle, and high school teachers (about evenly split between early- and late-grade levels). Using this sample, Nadelson and Sinatra reported that the MATE was capable of measuring acceptance change in response to treatment (a form of predictive validity
evidence) and had acceptable reliabilities (Cronbach’s alpha >0.6). We used the MATE given that prior validity and reliability evidence had been established using a sam-ple very similar to our own. Specifically, we used Cron-bach’s alpha to measure internal reliability for the MATE and found values of 0.865 (pre) and 0.928 (post) for the original version and values of 0.825 (pre) and 0.923 (post) for the “scientist” version. We used the original version of the MATE for the delayed post-test. The reliability of the delayed post-test was 0.92. These values are closely aligned with what Rutledge and Sadler (2007) reported in their 2007 study of the MATE (α = 0.94), and even
stronger than the results of Nadelson and Sinatra (2010). In addition, as is reported below, the measure was sensi-tive to treatment.
Measures of Targeted NOS Knowledge
We measured teacher knowledge using open-response items from the VNOS-C (Views of Nature of Science form C, Lederman et al. 2002). In particular, we selected VNOS-C items 1, 3, 5, and 6 for the pre- and post-test, and items 3 and 5 for the delayed post-test. We used these particular items because they were most closely aligned with the content that was addressed in the workshop (See the Supplementary Materials for the exact wording of these VNOS items and scoring). Therefore, it must be noted that our targeted NOS knowledge measure (hereafter TA-NOS) does not necessarily reflect partici-pant understanding of the entire construct of NOS (see Lederman et al. 2002). Two raters independently scored the four VNOS-C responses; one was a Ph.D. student in science education and the other was a science educator. Kappa values for inter-rater agreement were >0.8 for all four VNOS items. Consensus scores were established in all cases of disagreement. Reliabilities for the four VNOS items were measured using Cronbach’s alpha. We found weak internal consistencies of the four VNOS items in both pre- and post-test (0.42 pre-test and 0.54 post-test). The reliability of the delayed post-test, however, was a more robust 0.88.
Self‑perceptions of change measures
what extent did the summer workshop influence how you teach about the targeted aspects of nature of science (NOS)? (5) To what extent did the summer workshop influence your current attitudes toward evolution? The scales had answer options of “completely,” “very much,” “somewhat,” “a little,” and “not at all.” The internal reli-ability (Cronbach’s alpha) of the five self-perception items was 0.804 and these measures generally aligned with external measures of PD effects (see below).
Measures of Learning Gain Scores
Many studies in science education have begun to use learning gain scores to quantify the magnitude of change in instructional interventions (e.g., Hake 1998). We con-verted pre- and post-test scores into learning gain scores. We used both ‘absolute learning gain scores’ and ‘nor-malized learning gain scores’ because we were concerned about the impact of ceiling effects in normalized learning gain score calculations (e.g., pre-test scores constrained possible gains; see also Bao 2006). Absolute learning gain scores were converted by subtracting raw pre-test scores from raw post-test scores. Normalized learning gain scores, on the other hand, were converted by dividing the actual gains (post-test percentage scores − pre-test per-centage scores) by the potential gains (100% − pre-test percentage scores). We compared teachers’ learning gain scores among measured knowledge and acceptance vari-ables (see above).
Imputing Missing Data and Statistical Analyses
Prior to performing our statistical analyses, item-level missing data was filled in with imputed values using multiple linear regressions on the cases without missing data. This involved imputations for 4.8% of the 336 val-ues of variables across the 28 participants in the pre- and post-test design time points. Given that all six variables at each time point are highly correlated to each other, the multiple linear regression method to predict missing data using present data should be highly effective (Alli-son 2002). There was no item-level missing data in the delayed post-test.
Statistical tests to examine the efficacy of the PD pro-gram were performed on both the individual response measures (CINS, ACORNS-KC, ACORNS-MIS, MATE-P, MATE-S, TA-VNOS) and on a global measure using dimensionality reduction techniques. For the statisti-cal tests to measure the change of individual variables between pre- and post-test, and pre-, post-, and delayed post-test, either repeated measures ANOVAs (using CINS, MATE-P, and MATE-S) or non-parametric Wil-coxon Signed Rank tests (ACORNS-KC, ACORNS-MIS, and TA-VNOS) were performed in accordance with the nature of the normality of the data. The effect size of each
test was calculated using partial eta squared and Cohen’s d (Lomax 2007).
To examine the overall change of all variables through the intervention, we used Categorical Principal Compo-nents Analysis (CATPCA) that allows for reduction of a set of variables (including both quantitative/continuous and categorical/ordinal variables) and provides com-ponent scores that can then be used in standard linear models (Linting et al. 2007). We first combined the key concept scores and alternative conception scores relating to the written explanation evolutionary trait gain items and the two written explanation trait loss items. Thus, the pre- and post-test data included three quantitative vari-ables (CINS, MATE-P, and MATE-S) and eight categori-cal variables (ACORNS-KC-gain, ACORNS-KC-loss, ACORNS-MIS-gain, ACORNS-MIS-loss, and the four scores of TA-NOS items); the delayed post-test data also contained two quantitative variables (CINS and MATE-P) and six categorical variables (two key concept scores, two alternative conception or “misconception” [MIS] scores and two TA-NOS scores).
We used CATPCA to produce the loading scores based on the pre-PD variables only and then applied those same scores to the post-PD variables; this allows us to exam-ine changes in the same construct from the pre- to post-PD situations. This technique also avoids creating a bias toward finding significance in the efficacy analysis. These steps were repeated with the pre-/post-/delayed post-test data set (n = 20), which was analyzed separately from the pre-versus post-data set (n = 28). In particular, load-ing scores from the 11 initial pre-PD variables in data set one and the eight initial variables for data set two were applied to standardized versions of the variables at the other time points to create component scores that were used in the final analyses. These analyses of the overall efficacy of the PD program compared the change of com-ponent scores between pre- and post-test, and among pre-, post-, and delayed post-tests using repeated-meas-ure MANOVA models. In pairwise tests, Bonferroni cor-rections were made to account for multiple tests.
dimension 2: 24.9%). Note that, unlike traditional PCA, with categorical variables in the mix in CATPCA, it is not possible to reach 100% of the variance explained. In sum, the CATPCA allowed us to consider all of the measures we had in a single analysis; this produces the strongest statistical power.
Finally, Spearman’s rho was used to compute the mag-nitude of association among knowledge and acceptance of evolution and understanding of NOS. All of the statis-tical analyses were performed in SPSS™ version 19.
Results
Overall Program Effects
Our first test of program efficacy was performed using a repeated-measure MANOVA. As addressed in the meth-ods section above, the two-dimensional transformed component scores were used as dependent variables. The independent variable of this test was the change between the pre- and post- time points. The repeated-measure MANOVA indicated that the intervention program significantly impacted teachers’ knowledge of evolution, acceptance of evolution, and understanding of NOS (F2, 25 = 42.0, p < 0.001, partial eta squared = 0.77,
power = 1.00).
Knowledge and Alternative Conceptions of Evolution We used the CINS and ACORNS instruments to assess science teachers’ evolutionary knowledge. The repeated measures ANOVAs (pre- vs. post-intervention) demon-strated that overall CINS scores increased significantly whereas the ACORNS key concept scores did not change significantly (CINS: pre-test M = 13.08, SD = 4.66, post-test M = 16.43, SD = 4.08, F1, 27 = 25.8, p < 0.001, partial
eta squared = 0.49, power = 1.00; ACORNS-KC: pre-test M = 6.32, SD = 4.63, post-test M = 7.28, SD = 3.77, F1, 27 = 2.7, p > 0.05, partial eta squared = 0.09,
power = 0.35). The alternative conception scores for two items (e.g., snail, penguin) decreased signifi-cantly between the pre- and post-test (Snail: z = −2.24, p = 0.025; Penguin: z = −2.56, p = 0.010). Although we did not find significant changes in total ACORNS key concept scores, we did find significant improvements for
two individual key concepts: variability and phenotypic/
genotypic distribution change (Variability: F1, 27 = 14.3,
p < 0.001, partial eta squared = 0.35, power = 0.95; Phenotypic/genotypic distribution change: F1, 27 = 12.2,
p < 0.01, partial eta squared = 0.31, power = 0.92). We also found, rather unexpectedly, that the intervention was associated with significant decreases in the use of the concept of limited resources (F1, 27 = 25.6, p < 0.001,
par-tial eta squared = 0.49, power = 1.00).
We analyzed teachers’ knowledge coherence and struc-ture pre- and post-intervention. In the pre-test, only
14.3% of teachers consistently employed the KC variation in their explanations of evolutionary change across the four problem types; in contrast, 66.7% of teachers did so in the post-test. Although the percentage of teachers con-sistently using the KC heredity across contexts was low in the pre-test and in the post-test, twice as many teachers employed heredity in the post-test as in the pre-test (3.6 vs. 7.4%, respectively). The consistent application of the
KC differential survival did not display sizable differences
between the pre- and post-test (21.4 vs. 22.2%, respec-tively). In terms of participants’ knowledge structures, half (50.9%) of the sample used exclusively scientific ideas in their evolutionary explanations in the pre-test, while 83.3% of participants’ responses did so in the post-test. The frequencies of teachers’ mixed models, explicitly naïve models, and no discernible models, all decreased in the post-test. However, it is important to note that 12.0% of teachers’ responses in the post-test still included mod-els comprised of both scientific and naïve ideas.
used teleological language in her explanation. As noted, the most prominent alternative conception identified in teachers’ responses (both pre- and post-test) was prob-lematic teleological language (i.e. need or goal-driven evolutionary change not associated with selection). Inter-estingly, teachers’ teleological language was often associ-ated with the use of the key concepts differential survival
or limited resources (e.g. ‘in order to survive better’ or ‘in
order to protect against predators’).
Acceptance of Evolution
We employed two versions of the MATE (teachers’ personal acceptance [version P] and teachers’ percep-tions of scientists’ acceptance [version S]) to quantify science teachers’ acceptance of evolution before and after the intervention. The repeated measure ANOVA demonstrated that the personal acceptance MATE scores (MATE-P) were significantly less than teach-ers’ perceptions of scientists’ acceptance (MATE-S) in the pre-test (MATE-P M = 79.81, SD = 11.98, MATE-S M = 84.91, SD = 11.71, F1, 27 = 10.8, p < 0.01, partial
eta squared = 0.29, power = 0.89) whereas they did not differ significantly in the post-test (MATE-P M = 85.30, SD = 12.51, MATE-S M = 87.75, SD = 11.81, F1, 27 = 3.1,
p > 0.05, partial eta squared = 0.10, power = 0.40). Sec-ond, the repeated measure ANOVA demonstrated that personal acceptance MATE scores increased signifi-cantly post-test, whereas teachers’ perceptions of scien-tists’ acceptance did not change (MATE-P: F1, 27 = 33.4,
p < 0.001, partial eta squared = 0.55, power = 1.00; MATE-S: F1, 27 = 4.7, p = 0.04, partial eta squared = 0.15,
power = 0.55).
Targeted Aspects of the Nature of Science
Written examples of teachers’ changing notions of TA-NOS for the four categories that we investigated are pro-vided in the Additional file 1: Table S2. Dramatic changes in teachers’ understanding of the targeted aspects of nature of science are apparent in the written responses; differences were also detected using statistical analysis (e.g., Wilcoxon Signed Ranks Test). Specifically, teachers’ scores (naïve = 0, partially informed = 1, informed = 2) for all four TA-NOS items displayed significant increases from pre- to post-test (TA-NOS 1: z = 2.68, p < 0.01; TA-NOS 3: z = 4.05, p < 0.001; TA-NOS 5: z = 4.37, p < 0.001; TA-NOS 6: z = 3.04, p < 0.01). Teachers showed the greatest improvement in TA-NOS item 5 (the difference between scientific theories and laws).
Delayed Post‑Test Scores
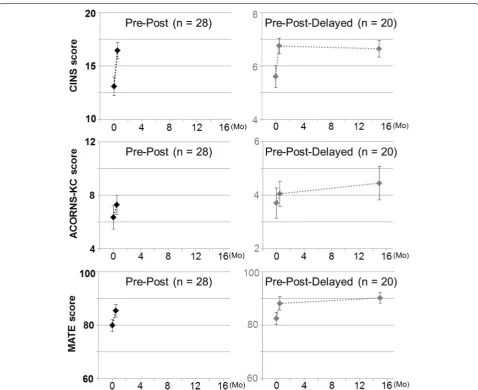
Figure 3 provides the results of comparisons among pre-, post-, and delayed post-test scores. Two issues are impor-tant to keep in mind when viewing these results. First,
recall that we used selected item sets from the CINS, ACORNS-KC, and TA-NOS instruments to limit the length of the delayed post-test. Second, only 20 of the 28 teachers participated in the voluntary delayed post-test. Because of these two considerations, we separately compared scores from the pre-and post-test results using the whole sample (see Fig. 3, black line) and the pre-and post-test results for the portion of the sample that par-ticipated in the delayed post-test (see Fig. 3, gray line). Figure 3 shows that the patterns of pre- and post-test results, and the delayed post-test results, are almost iden-tical with patterns from the whole sample.
We performed a repeated-measure MANOVA using the component scores of the CATPCA analysis. The results indicated that the intervention program was associated with significantly and meaningful improve-ments in teachers’ knowledge of evolution, acceptance of evolution, and understanding of NOS (F4, 16 = 16.8,
p < 0.001, partial eta squared = 0.81, power = 1.00). The tests of within-subjects contrasts of the repeated meas-ures MANOVA revealed that no significant decreases in the component scores were noted between the post-and delayed post-test (Dimension 1: F = 0.01, p = 1.000, partial eta squared = 0.00, power = 0.05; Dimen-sion 2: F = 2.75, p = 0.114, partial eta squared = 0.13, power = 0.35); in contrast, strongly significant increases were noted between pre- and post-test responses (Dimension 1: F = 54.13, p = 0.000, partial eta squared = 0.74, power = 1.00; Dimension 2: F = 38.44, p = 0.00, partial eta squared = 0.70, power = 1.00). The pairwise comparisons using a Bonferroni correction showed the same results.
We also performed repeated measures ANOVA for individual quantitative variables (e.g., CINS, ACORNS-KC, MATE-P). The results for the CINS test revealed a significant increase between pre- and post-test scores, but no significant difference between the post- and delayed post-test scores (pre-post: F1, 19 = 14.5, p = 0.001,
partial eta squared = 0.43, power = 0.95; post-delayed post: F1, 19 = 0.2, p = 0.695, partial eta squared = 0.01,
power = 0.07). Tests of the MATE scores also illus-trated a significant increase between the pre- and post-test but no significant difference between the post- and delayed post-test (pre-post:F1, 19 = 20.0, p < 0.001,
par-tial eta squared = 0.51, power = 0.99; post-delayed post: F1, 19 = 1.0, p = 0.331, partial eta squared = 0.05,
scores (e.g. snail and rose items) across pre-, post- and delayed posttest illustrated MIS scores of Rose item for delayed post-test were significantly lower than the scores on the pre-test (Figure S1, Wilcoxon Signed Ranks test for pre- and delayed post-test: z = 2.65, p = 0.008).
Friedman tests and Wilcoxon Signed Ranks tests were used to examine differences in TA-NOS. Items 3 and 5 showed a significant increase between the pre- and post-test, and a non-significant decrease between the post- and delayed post-test (Item 3: Chi Square = 26.8, p = 0.000; Wilcoxon Signed Ranks test: pre-post, z = 3.85, p = 0.000; post-delayed post: z = 1.82, p = 0.068; Item 5: Chi Square = 21.6, p = 0.000; Wilcoxon Signed Ranks
test, pre-post: z = 3.72, p = 0.000; post-delayed post: z = 1.83, p = 0.068).
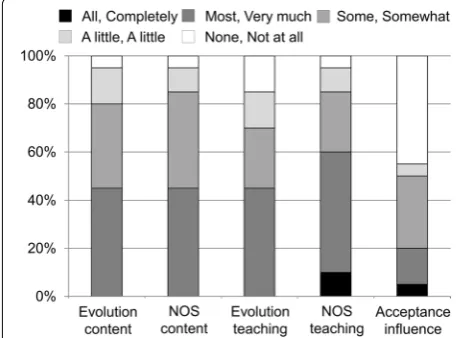
Self‑Perceptions of Change
Fifteen months after the PD workshop, participants were asked to self-report their perceptions of its impact (Fig. 4). Twenty of the twenty-eight participants voluntarily com-pleted the delayed post-test. Among these participants, nearly half (45% for evolution and TA-NOS) reported that they remembered most of the biology/evolution content and the nature of science (TA-NOS) content. In addition, half of participants (45% for evolution and 60% for TA-NOS) reported that the workshop influenced
Fig. 3 Retention of knowledge and acceptance change 15 months after the PD intervention. Left column (results from complete MATE, complete
CINS, and two ACORNS essay items): pre- and post-test mean scores, n = 28 (100% participation). Right column (results from complete MATE, partial
CINS, and one ACORNS item): pre-, post- and delayed post-test, n = 20 (>70% participation); Error bars represent standard errors of the mean. A
how they taught about biology/evolution and TA-NOS (Fig. 4). Despite that the fact that the majority of delayed post-test participants perceived that their knowledge was retained and teaching was influenced by the PD program, 50% of participants thought their attitudes toward evolu-tion were influenced a little or not at all. In contrast, 20% of participants reported that the summer workshop influ-enced their current attitudes toward evolution. The 50% of participants who thought their attitudes toward evolu-tion were influenced a little or were not influenced dis-played similar scores on the MATE instrument across the pre-, post- and delayed post-test. The repeated-measure ANOVA indicated significant increases in MATE scores between the pre- and post-test (F1, 7 = 6.6, p = 0.037,
partial eta squared = 0.49, power = 0.60) and no sig-nificant decreases in MATE scores between the post- and delayed post-test (F1, 7 = 0.1, p = 0.719, partial eta
squared = 0.02, power = 0.06). Interestingly, we found no significant correlations between self-perceptions of change and objective measures of knowledge and accept-ance change (Spearman, p > 0.05). Thus, while some par-ticipants perceived that their attitudes did not change, the empirical measures contradicted this result to some degree.
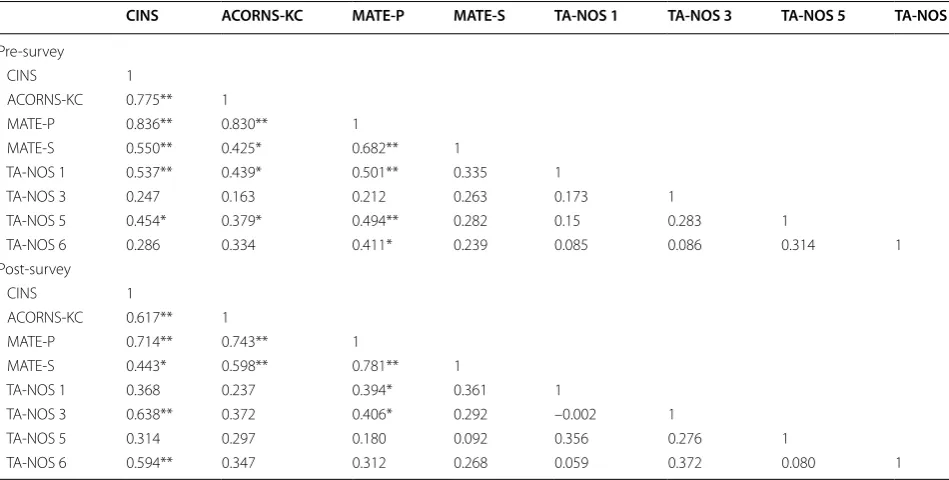
Relationships Among Variables
Table 3 illustrates the Spearman’s rho correlation coefficients among knowledge and acceptance vari-ables (both pre- and post-intervention; ACORNS-MIS variable was excluded). In general, we found simi-lar associations among variables pre- and post-inter-vention. First, the correlations between knowledge and acceptance in the pre-tests were higher than the
correlations in the post-test (Pre CINS vs. Pre MATE-P: r28 = 0.836, p < 0.001; Pre ACORNS-KC vs. Pre
MATE-P: r28 = 0.830, p < 0.001; Post CINS vs. Post
MATE-P: r28 = 0.714, p < 0.001; Post ACORNS-KC vs. Post
MATE-P: r28 = 0.743, p < 0.001). Second, the correlation
between personal acceptance and scientists’ acceptance of evolution in the post-test was higher than that the cor-relation in the pre-test (Pre MATE-P vs. Pre MATE-S: r28 = 0.682, p < 0.001; Post MATE-P vs. Post MATE-S:
r28 = 0.781, p < 0.001). Overall, one of the most
signifi-cant findings to emerge from the correlation analyses was that evolutionary knowledge (measured using the CINS and the ACORNS) and acceptance of evolution (meas-ured using the MATE) were significantly associated, with surprisingly strong r values (e.g., 0.836 and 0.830).
Learning Gains
We examined the correlations among absolute learn-ing gain scores and normalized learnlearn-ing gain scores for quantitative measured variables (e.g. CINS, ACORNS-KC, MATE-P, and MATE-S). We found that correlations among absolute learning gain scores for all of the vari-ables (e.g. CINS, ACORNS, and MATE) were not signifi-cant (p > 0.05). Likewise, correlations among normalized learning gain scores for all of the variables were not sig-nificant (p > 0.05). Overall, gain scores for most meas-ured variables were not significantly related.
Discussion
The central aim of this study was to investigate the long-term impacts of an intensive, short-term profes-sional development program on teachers’ knowledge of evolution, acceptance of evolution, and knowledge of the nature of science (NOS). While numerous studies over the past 50 years have documented different fac-ets of teacher ambivalence or antipathy towards evolu-tion (reviewed in Kim and Nehm 2011), a comparatively smaller body of empirical work in science education has involved interventions attempting to mitigate this core challenge (Table 1). Our PD workshop attempted to move beyond prior published work in the following ways: First, unlike all past studies, our intervention was built upon an explicit theoretical model of PD (Desimone 2009) and was clearly linked to specific approaches asso-ciated with successful PD in the literature, including a strong content focus, active learning (student-centered inquiry-based activities); coherence (alignment with NJ State Standards and district goals); duration (the equiva-lent of one graduate class); and collective participation (collaborative learning in school-based context) (Table 2). Second, the program utilized curricular and pedagogical strategies identified in the science education literature as effective for evolution instruction, such as a focus on the
relationships between science and religion (content) and student ideas/alternative conceptions (cognition). Third, the program focused on three core areas (evolution knowledge, evolution acceptance, and NOS) that have only sometime been united in prior teacher intervention studies (see Table 1). Fourth, unlike some past studies that have relied upon multiple-choice tests as measures of PD efficacy, we supplemented such tools with scien-tific practice tasks (particularly explaining evolutionary change). Fifth, our study is the first to determine whether short-term gains have any staying power (>1 year later) using empirical (including practice) measures and self-perception data. We now discuss some specific findings relevant to future studies.
Science Teachers’ Evolution Knowledge
We used two assessments—one multiple choice and the other constructed-response—to measure the impact of the intervention on teachers’ knowledge of evolution. While covering the same general content (evolutionary change and its causes), measures derived from the two instruments revealed different learning gain patterns. Teachers showed statistically significant improvement in the number of correct answers chosen on the multiple-choice assessment but did not show statistically signifi-cant improvement on the use of accurate key concepts in the constructed-response assessment. We did, however,
find a significant and meaningful reduction in the num-ber of alternative conceptions in teachers’ explanations on the constructed response assessment. In particular, significant decreases were noted in teachers’ use of teleol-ogy in their explanations of evolutionary change. Because the reduction in teleology is associated with increases in the use of the scientifically accurate concepts of ‘ variabil-ity’ and ‘population change’, the intervention may help teachers adopt ‘population thinking’ and overcome the well-documented cognitive bias of essentialism (Sinatra et al. 2008). Methodologically, these findings indicate that measuring teachers’ accurate knowledge using MC assessments alone may provide a limited picture of con-ceptual improvements in understanding (Nehm and Schonfeld 2008).
In addition, the open-response assessment depicted a change in knowledge coherence patterns and the fre-quencies of mixed models (that is, explanations com-prised of both scientific and naïve elements). Although more than half of the participants employed variabil-ity across all four open-response items, the majority of teachers inconsistently employed heritability and
differ-ential survival/reproduction in the post-test. In addition,
after the intervention, 12.0% of teachers displayed mixed models. Although the dramatic increase of explicitly sci-entific ideas, and the decrease in the frequency of mixed models and explicitly naïve models provide support for
Table 3 Spearman’s rho correlations among instrument scores pre- to post-intervention
CINS natural selection knowledge multiple-choice test, ACORNS-KC open-response evolution key concept knowledge test, MATE acceptance of evolution test, MATE-P
Personal acceptance test, MATE S Scientists’ acceptance test, TA-NOS the nature of science knowledge test.
* p < 0.05, ** p < 0.01.
CINS ACORNS‑KC MATE‑P MATE‑S TA‑NOS 1 TA‑NOS 3 TA‑NOS 5 TA‑NOS 6
Pre-survey
CINS 1
ACORNS-KC 0.775** 1
MATE-P 0.836** 0.830** 1
MATE-S 0.550** 0.425* 0.682** 1
TA-NOS 1 0.537** 0.439* 0.501** 0.335 1
TA-NOS 3 0.247 0.163 0.212 0.263 0.173 1
TA-NOS 5 0.454* 0.379* 0.494** 0.282 0.15 0.283 1
TA-NOS 6 0.286 0.334 0.411* 0.239 0.085 0.086 0.314 1
Post-survey
CINS 1
ACORNS-KC 0.617** 1
MATE-P 0.714** 0.743** 1
MATE-S 0.443* 0.598** 0.781** 1
TA-NOS 1 0.368 0.237 0.394* 0.361 1
TA-NOS 3 0.638** 0.372 0.406* 0.292 –0.002 1
TA-NOS 5 0.314 0.297 0.180 0.092 0.356 0.276 1
the effectiveness of the PD program, several teachers failed to meet a minimum competency benchmark (i.e., being able to explain evolutionary change free of alterna-tive conceptions).
We consider the scores on the MC test to be rep-resentative of teachers’ knowledge gains, specifically their ability to recognize accurate scientific informa-tion. We view the absence of significant changes in teachers’ performance on the constructed-response assessment as indicative of their difficulties in using, applying, and communicating that knowledge. Teach-ers’ communication and explanation skills are best measured using constructed-response tests, and yet comparable types of assessments were lacking in most prior teacher survey studies, association stud-ies, and intervention studies (e.g., Table 1; however, see Crawford et al. 2005). Thus, while knowledge increase and alternative conception decrease were notable outcomes of our intervention, and many oth-ers in the literature, teachoth-ers’ abilities to communicate robust explanations of evolutionary change were mod-est. Future teacher PD programs should therefore (1) employ measures of efficacy more closely aligned to pedagogical practice; and (2) provide opportunities for teachers to explain evolutionary change orally and in writing. Such changes may have greater connection to important classroom competencies, such as teaching evolution effectively.
Science Teachers’ NOS Knowledge
The nature of science (NOS) has long been associated with evolutionary theory in the science education lit-erature (Kim and Nehm 2011; Nehm et al. 2009; Schar-mann 1994; Rutledge and Warden 2000; Trani 2004) and is widely considered to be a necessary prerequisite to understanding evolution (e.g., Kennedy et al. 1998). As noted above, our program covered core NOS concepts (observation vs. inference; theory vs. law; etc.) during the first 2 days of the 10-day program. Moreover, TA-NOS concepts were highlighted repeatedly when teaching about other topics (e.g., Mendelian ratios; fossils; photo-synthesis and transpiration; etc.). Although TA-NOS was not the primary focus of the intervention, teachers dis-played the largest levels of improvement in their under-standing of TA-NOS relative to other measured variables (see Additional file 1: Figure S2). This finding supports the theoretical rationale in the science education litera-ture, namely that explicit and active learning about TA-NOS is helpful to the learning of evolution. Indeed, our results may be added to three of the four other interven-tion studies that we reviewed that documented similar findings (i.e., Nehm and Schonfeld 2007; Scharmann and Harris 1992; Scharmann 1994).
The magnitudes of TA-NOS knowledge change docu-mented in our study are in alignment with those achieved in interventions focusing on TA-NOS alone. Akerson et al. (2000), for example, taught reflective, explicit, activ-ity-based instruction on TA-NOS for graduate students in elementary education for one semester (weekly in 3-h blocks) and found that 24% of participants developed adequate understanding of empiricism and 56% of par-ticipants developed adequate understanding of the differ-ences between theories and laws. Our study found larger gains, and illustrated that 71% of participants developed adequate understanding of empiricism and 86% of par-ticipants developed adequate understanding of the differ-ences between theories and laws. In terms of knowledge retention, Akerson et al. (2006) investigated pre-service elementary teachers who completed a science meth-ods course focusing on explicit-reflective instruction in TA-NOS. The authors reported that 5 months after the intervention, 41% of participants retained their ideas of scientific empiricism and 94% of participants retained understanding of the differences between theories and laws. Our retention findings were not as impressive (53 and 70%, respectively), but they were measured much longer after the intervention than in Akerson et al. (2006) study.
The intervention studies that we reviewed used differ-ent pedagogical and curricular approaches to teach evo-lution and NOS than described in our study (e.g., Smith and Scharmann 2008), supporting conventional wisdom that different approaches to teaching subject matter can nevertheless generate comparable learning gains. Because previous studies reported z values from Wil-coxon signed-ranks tests, and not traditionally used par-tial eta squared scores, we also generated z values so that we could compare our results with those from previous results. The z values for teachers’ TA-NOS knowledge gain in our study were TA-NOS 1 (2.68, p < 0.01), TA-NOS 3 (4.05, p < 0.001), TA-NOS 5 (4.37, p < 0.001), and TA-NOS 6 (3.04, p < 0.01), compared to 2.74 (p < 0.01) in Scharmann and Harris’s (1992) study, 3.06 (p < 0.01) in Scharmann’s (1994) study, and 4.20 (p < 0.01) in Nehm and Schonfeld’s (2007) study. All of the studies, which combined both evolution and TA-NOS, demonstrated highly significant z values. This suggests, but does not causally demonstrate (because of the study designs), that teaching both evolution and TA-NOS together tends to generate improvements in TA-NOS understanding. This is an emerging theme in evolution education research.
Science Teachers’ Acceptance of Evolution