Vol.8 (2018) No. 6
ISSN: 2088-5334
Index of Active Tectonic Assessment: Quantitative-based
Geomorphometric and Morphotectonic Analysis at Way Belu
Drainage Basin, Lampung Province, Indonesia
Dewi Gentana
#, Nana Sulaksana
*, Emi Sukiyah
#, Euis Tintin Yuningsih
# #Department of Geoscience,Faculty of Geological Engineering, Padjadjaran University, Bandung, Postal Code 40132, Indonesia E-mail: [email protected]; [email protected]; [email protected]
*
Department of Applied Geology, Faculty of Geological Engineering, Padjadjaran University, Bandung, Postal Code 40132, Indonesia E-mail: [email protected]
Abstract— The occurrence of subduction zones caused by the collision between the Eurasian-Western Indonesia Plate due to an increase tectonic, volcanic and magmatic activities along Sumatra Island. This study covers the area of Way Belu Drainage Basin, located near Bandar Lampung City, Lampung Province, southern part of Sumatra, Indonesia. The area composes of a complex geological structure as the result of tectonic activities. In this study, geomorphic indices assessment such as morphometric and morphotectonic quantitative analysis are undertaken to identify the Index of Active Tectonics (IAT). The morphometric analysis uses Drainage density (Dd) and Ratio of bifurcation (Rb). The value of Dd respectively from 1.45 to 4.05, Rb from 2 to 10. While the
morphotectonic analysis uses basin shape index (Bs), valley floor width-valley height ratio (Vf), and asymmetry factor (AF). The value
of Bs from 1.27 to 6.25, Vf from 0.16 to 3.30, and AF from 22.73 to 83.77 in ranges which is derived average IAT value is 2.20. It may
considered that at the Way Belu Drainage Basin has moderate to high tectonic activity. From the joint measurement results on the fracture zone express that the main pattern of faults has trend NWW-SSE, NE-SW, NNE-SSW, NW-SE, and W-E directions. Furthermore, based on the combination of the quantitative geomorphology indices assessment which is supported by remote sensing and field assessment shows that those features closely related to the Semangko Fault System with the NNW-SSE fault trend parallel to its fault.
Keywords— morphometric; morphotectonic; drainage basin; Index of Active Tectonics (IAT).
I. INTRODUCTION
Active tectonics is one of the Earth Sciences disciplines as tools for geochronological and geodetic acquisition of accurate rates data such as uplift rates, incision rates, erosion rates, slip rates on faults at variable (103–106 years) time-scales [1]
–
[3]. According to [1], an active fault is a fault that has moved in the past 10,000 years. Fractures potentially developed into fault. The top of the mountain landscape that has undergone tectonic is indicated by the presence of triangular facet [4]. According to [5], geologically, weak zones at the tectonic boundaries of basins and plate commonly interpreted at the surface which is expressed by fault and rock fractures as well as regional lineament form. Sumatera Island is formed by the collision between Indo-Australian Plate and Eurasian Plate in Pliocene-Pleistocene.Sumatra fault is mainly a strike-slip fault [6]. The satellite imagery studies contribute to the knowledge about Sumatra
Fault [6]. Regionally, the structure of the study area was affected by subduction zone which has strike-slip and oblique movement in line with Riddle shear model. This study focus in the Way Belu Drainage Basin, located in the area of Tanggamus District, or about 100 km to the west of Bandar Lampung City, Lampung Province, and southern part of Sumatra Island, Indonesia. The total area of the drainage basin is about 130 km2. Good terrain characteristics and geomorphology indices study are significant for the
investigation of endogenetic and exogenetic
understand the development of tectonic activity in this area. It is suggested that the structure pattern in Way Belu Drainage Basin is NWW-SSE, NE-SW, NNE-SSW, NE-SW, and W-E directions.
Sumatera Island is formed by the collision between Indo-Australian Plate and Eurasian Plate in Pliocene-Pleistocene. These activities possibly occurred in Early Miocene when the Tertiary volcano activities formed as Lahat formation in the southern part of South Sumatera [9].The drainage basin of Way Belu, located approximately 18 km to the Northeast of Semangko Fault. In addition, the earthquake hypocenter point has been plotted to define subduction zone. It shows approximately 120 km from the surface [10].
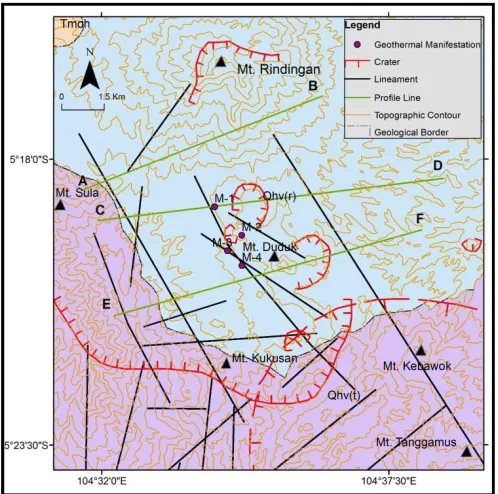
According to [11], the study area is composed by Tertiary volcanic products (Tmoh) which form andesitic breccia, granodiorite, andesitic lava, dacitic lava, basaltic lava, and tuff. Andesitic lava can still be found as Mt. Sula product which is located in the western part outside the study area, basaltic lava is a product of Mt. Kukusan, dasitic lava is isolated around Mt. Duduk, and Qhv (l) from Mt. Sula at western part of depression area. The Quaternary volcanic product namely Qhv (r) which is composed as pyroclastic product from Mt. Kabawok and Mt.Rindingan which predominantly occupies in the study area. On the other hand, volcanic product which consist of breccia, lava, and tuff with basaltic andesitic from Mt. Rindingan also found as young Quaternary product. The Qhv (t) which consist of andesitic lava and pyroclastic also found as volcanic product from Mt.Tanggamus. It lies at the southern part near the youngest lithology, alluvium (Qa) (Fig.1)
Fig. 1 Regional geology of study area is showing the distribution of lithology from different sources such as Mt. Tanggamus, Mt. Kabawok, Mt. Kukusan, Mt. Duduk, Mt. Rindingan, and Mt. Sula which is composed by Tertiary and Quaternary volcanic products (Modified from [11])
There are a lot of lineaments in the study area with highest intensity near the caldera rim. There are also found some geothermal surface manifestation (M-1, M-2, and M3) near the NNW-SSE lineament on the depression area.
Structural geology is used to characterize the deformation (geometry), and to characterize the flow path which is followed by the particles during deformation (kinematics), and to infer the direction and magnitude of the force involved in driving deformation (dynamics). Reference [12] shows that localized tectonics related to active fault. A fracture that opens perpendicular to the rock which has no offset define as a joint [13]. The joint in the study area relatively have small fractures, regular fair patterns, and cut all the rocks. The analysis of reliable data with rosette diagram shows the direction of the structure. The pattern of this structure shows close relationship with the pattern of geological structure. Reference [4] shows joints are parallel, planar, and traceable plane. Sometimes they have regular distance, and their spaced could reach a centimeter or even hundred meters. It is called as a systematic joint. The structural morphology is well-exposed as jointed bedrock at site where joint fractures are classified and measured to determine the trend direction of structure development in relation with Semangko Fault System.
II. MATERIAL AND METHOD
The method in this study use remote sensing and field observation methods. Remote sensing method carried out by the interpretation of topographic using a 1: 25,000 scales
map and Advanced Spaceborne Thermal Emission and
Reflection Global - Digital Elevation Model (ASTERG-DEM) imagery which are completed by quantitative morphometric and morphotectonic analyses. Field method carried out by observation of geological structure to validate the tectonic evidence. This paper is approached by qualitative and quantitative methods in order to focus on an areas for more detailed work to establish levels of active tectonics.
By identifying characteristic of slope and
maximum-minimum or average sizes through quantitative
measurement, landform is determined as a definition of
morphometric [1]. Several indications of morphological appearance in the active tectonics can be learned by using
morphometric parameters such as Drainage density (Dd) and
Ratio of bifurcation (Rb). They are the response variable of
landform and tectonic [14][6].
Moreover, all matters related to the relationship between structural geology and landform or specifically the relationship between structure and neotectonic are defined as morphotectonic [15]. According to [14], the existence of an active fault in an area can be recognized by the characteristic of morphotectonic. Several indicator of morphological appearance in the active tectonics can be learned by using morphotectonic parameters such as basin shape index (Bs),
valley floor width-valley height ratio (Vf), and asymmetry
factor (AF).
Virtually, the fundamental unit of all basin and fluvial investigations is the drainage basin. Thus, drainage basin is an area flowing in the interconnected river system in such a way that the current flow originating from upstream that disembogue through a single stream which will eventually goes into the lake or the sea. A drainage basin can be divided into several subdrainage basins, and drainage basin studies cover upstream, middle and downstream sections.
of a sub-drainage basin, as well as the overall drainage basin, reflects the tectonic activity response to the landscape of a basin. According to [6], the characteristics of the drainage basin are studied through morphometric characteristics of each sub-drainage basin.
A. Geomorphic Indices
1) Drainage density (Dd): Drainage density is the ratio
between the length of the river segment and the drainage
basin or sub-basin area. The high Dd value represents the
river network on drainage basin is either large or tight [18]. It can also reflect the relationship between the geological and climatic conditions of a region. Drainage density shows the landscape dissection, run off potential, infiltration capacity of the land, climatic conditions, and vegetation cover of the basin. The drainage density is the result of weak or impermeable subsurface material, sparse vegetation, and high relief. Low drainage density leads to coarse drainage texture while high drainage density leads to fine drainage texture. Reference [14] classify the drainage density index into six classes and each class can be used as a possible approach to the texture type of a landscape. Landscape with
very coarse texture has Dd values from 0-1.379 km/km
2
,
coarse texture has Dd values from 1.380-2.758 km/km
2
,
moderate texture has Dd values 2.760-4.139 km/km2, slightly
fine has Dd values from 4.140-5.519 km/km2, fine texture
has Dd values from 5.520-6.899 km/km2, and very fine
texture has Dd values from 6.90-8.279 km/km2 in ranges.
According to [18], the value of Dd can be obtained using the
equation:
=
∑ /
(1)Where:
∑
: total length of river segments, A : sub-drainage basin area.2) Bifurcation ratio (Rb): Bifurcation ratio or branching ratio is the ratio between the number of river segment of "n" with the number of its segment at higher order "n + 1" [18].
Rb values less than 3 or more than 5 indicate that
non-homogeneous geological conditions and tectonic
deformation has occurred. Reference [20] stated that as long as the drainage pattern not distorted by the geological structure, it would give the bifurcation value below the range. Furthermore, reference [21] stated that bifurcation ratio characteristically ranges between 3.0 and 5.0 for basins which the geological structure does not damage the drainage
pattern or not deformed. The Rb valueis calculated using the
equation:
=
∑∑
(2)
Where:
Rb : Ratio of bifurcation,
∑
: Number of stream segments∑ + 1
: Number of stream segments plus stream segment of next higher order3) Basin shape index (Bs): The active tectonic area in young drainage basin has normally formed an elongated shape on the topographical mountain slope. Then this elongated shape will evolve into a circular shape [22]. Bs is a horizontal projection shape of the basin which is obtained by
the elongation ratio or basin shape index. The value of Bs is calculated using the equation:
Bs= Bl / Bw (3)
Where Bl is the length of the basin measured from the surface water level to the mount, and Bw is the width of the basin measured at its widest point. High values of Bs associated with elongated basin, generally associated with the relatively higher tectonic activity. Low values of Bs indicate a more circular-shaped basin, generally associated with the low tectonic activity. Therefore, Bs may reflect the rate of active tectonics [23]. Classification of Basin shape index (Bs) follow the range value according to [24], [25]. The Bs index >4 classified into tectonic class 1 (high tetonic activity), 3<Bs<4 classified into tectonic class 2 (moderate tectonic activity), and Bs <3 classified into tectonic clas 3 (low tectonic activity).
4) Valley floor width-valley height ratio (Vf): The valley floor width to valley height ratio (Vf) is another index that sensitive to tectonic uplift [23]. According to [1], [24], high uplift rate has Vf value <0.5 (tectonic class 1 parallel to high tectonic activity), moderate uplift rate has Vf value >0.5 and <1 (tectonic class 2 parallel to moderate tectonic activity), and low uplift rate has Vf value >1 (tectonic class 3 parallel to low tectonic activity). The index is a measurement of the incision and not uplift, but in an equilibrium state, incision and uplift nearly match. The Vf value is calculated using the equation:
Vf = 2Vfw / [(Eld – Esc) + (Erd – Esc)] (4) Where Vf is the width of valley floor, Eld, Erd, and Esc is the river elevations – left, right, and center, and divided valleys lead to downstream and the stream channel respectively.
5) Asymmetry Factor (AF): AF is one of geomorphic index which can be a parameter to check the tectonic activity from the tilting of the basin due to the tectonic in an area. The calculation of AF can show the direction of the tilting. If AF > 50, it indicates that the tilting direction of the basin is to the left (from downstream point of view). But, if AF < 50 it indicates that the tilting direction is to the right side of the basin [1].
The value of tilting direction can imply the intensity of tectonic activity. In Way Belu Drainage Basin, there are three class of tectonic activity based on tilting. Reference [24] stated that class 1 of tilting basin indicate high tectonic activity, class 2 of tilting basin indicate moderate tectonic activity, and class 3 of tilting indicate low tectonic activity. A lot of researcher before has used this method to indicate the IAT in an area such as [24] and [25]. Range of IAT for AF parameter showed at Table 1 below.
TABLE I
RANGE OF IAT FOR AF PARAMETER [24]
Class 1 (High Tectonic
Activity)
Class 2 (Moderate Tectonic
Activity)
Class 3 (Low Tectonic
Activity) AF > 35 or
AF < 65
35 < AF < 43 or
57 < AF < 65 43 ≤ AF < 57
evaluate the Index of Active Tectonics (IAT) are the most important and widely use geomorphic indices among others. This index represents a summary and average of given geomorphic indices which is used in the study can be obtained using the equation:
IAT = S/N (5)
Where S represents the sum of previous indices, N represents the number of selected indices [25], [26]. The values of the index were divided into four classes to define the degree of active tectonics; 1—very high (1.0 ≤ IAT < 1.5); 2—high (1.5 ≤ IAT < 2.0); 3—moderate (2.0 ≤ IAT < 2.5); and 4—low (2.5 ≤ IAT) [25], [27]. The ranges of geomorphic indices according to [24], related to the Index of Active Tectonics (IAT) are applied in this study which is shown in Table 2.
TABLE II
THE RANGE OF GEOMORPHIC INDICES [24]
Aspect
Relative tectonic activity Class 1
(High ta*)
Class 2 (Moderate ta*)
Class 3 (Low ta*) BS 4.34 – 6.25 3.04 – 3.9 1.29 – 2.58 Vf 0.16 – 0.30 0.36 – 0.94 1.08 – 4.40
AF 22.73 –
83.77 35.59 – 60.91
44.86 – 54.43 ta*= tectonic activity
B. Field Observation
Field observation method is used to provide valid data information related to the development of geological structures on site in line with quantitative morphometric and morphotectonic calculation results. Theoretically, structural geology is aimed to characterize the deformation structures and the flow path followed by the landform changes during deformation phase. It is also used to deduce the direction and magnitude of forces that has role play in the deformation.
Geological structures in the study area are recognized by
the fault scarp, ridge/valley lineament and rockslide phenomenon. And also, the measurements of joints in the fault zone are conducted at andesitic basaltic lavas as a product of Mt. Rindingan scattered in three locations such as at the Way Panas River, Pelangi Valley and Pengantin Waterfall. The purpose of the joint measurement is to define the trend of the tectonic stress that occurs in the study area. The rosette and stereonet diagrams are used to read the joint measurement data. Rosette diagram informs about the fracture trend. The stereonet inform about the trend of the
stress which symbolize with σ (Sigma). According to [4], σ1
is the highest principal stress, σ2 is intermediate stress and
σ3 is least principal stress. The total length of joint
measurement in the field simplified to n (length divided by the shortest length).
III.RESULTS AND DISCUSSION A. The Result of Morphometric and Morphotectonic
Analysis
The geomorphic indices calculation of each morphometric and morphotectonic parameters showing various tectonic
activity levels in Quaternary volcanic products of Mt. Rindingan, Mt. Kukusan and Tertiary volcanic rocks of Mt. Tanggamus product. The detail result of every geomorphic index such as Dd (Table III), Rb (Table IV), Bs (Table V), Vf (Table VI) and AF (Table VII) are explained as below:
TABLE III
THE RESULT OF DRAINAGE DENSITY (DD) CALCULATIONS IN WAY BELU
DRAINAGE BASIN [14]
Drainage Basin
Sub-Drainage
Basin
Basin Area
(A)
Length of channels
(∑L)
Drainage Density
(Dd)
Landform Texture
Way Belu
1 2.03 4.56 2.25 Coarse
2 1.07 1.55 1.45 Coarse
3 2.85 4.54 1.59 Coarse
4 0.78 2.74 3.51 Moderate
5 2.29 5.53 2.41 Coarse
6 1.35 5.21 3.86 Moderate
7 1.32 3.14 2.38 Coarse
8 0.92 2.13 2.32 Coarse
9 1.63 5.01 3.07 Moderate
10 2.37 4.54 1.92 Coarse
11 1.32 3.29 2.49 Coarse
12 2.28 8.02 3.52 Moderate
13 1.65 4.77 2.89 Moderate
14 1.53 5.79 3.78 Moderate
15 1.89 6.63 3.51 Moderate
16 1.97 5.6 2.84 Moderate
17 0.23 0.9 3.91 Moderate
18 0.42 1.7 4.05 Moderate
19 3.7 7.89 2.13 Coarse
20 5.68 12.52 2.20 Coarse
21 5.76 10.03 1.74 Coarse
22 3.18 7.99 2.51 Coarse
23 5.99 10.31 1.72 Coarse
24 2.48 5.29 2.13 Coarse
25 2.74 7.08 2.58 Coarse
26 7.27 16.15 2.22 Coarse
27 1.48 3.86 2.61 Coarse
Coarse Texture Mean 2.16
Moderate Texture Mean 3.50
Dd Mean 2.65
Ddcalculations in twenty seven sub-drainage basin have
Dd values in range from 1.45- 4.05 km/km
2
expressed from ten sub-drainage basin in the locations number 4(3.51), 6(3.86), 9(3.07), 12(3.52), 13(2.89), 14(3.78), 15(3.51), 16(2.84), 17(3.91), 18(4.05) km/km2. And then from seventeen location of sub drainage basin such as in the number 1(2.25), 2(1.45), 3(1.59), 5(2.41), 7(2.38), 8(2.32), 10(1.92), 11(2.49), 19(2.13), 20(2.20), 21(1.74), 22(2.51), 23(1.72), 24(2.13), 25(2.58), 26(2.22), 27(2.61) km/km2, expresses coarse texture landform that occupies dominantly at the eastern part of the study area. Thus, it is considered that tectonic activity passes this area.
TABLE IV
THE RESULT OF RATIO BIFURCATION (Rb)CALCULATION
Drainage Basin
Sub-Drainage
Basin 1st Order
2nd
Order Rb Remarks
Way Belu
1 1 3 3 Not Deformed
2 1 2 2 Deformed
3 1 5 5 Not Deformed
4 1 2 2 Deformed
5 1 4 4 Not Deformed
6 1 6 6 Deformed
7 1 4 4 Not Deformed
8 1 3 3 Not Deformed
9 1 7 7 Deformed
10 1 3 3 Not Deformed
11 1 3 3 Not Deformed
12 1 6 10 Deformed
13 1 4 4 Not Deformed
14 1 5 5 Not Deformed
15 1 6 6 Deformed
16 1 5 5 Not Deformed
17 1 2 2 Deformed
18 1 2 2 Deformed
19 1 6 6 Deformed
20 1 9 9 Deformed
21 1 7 7 Deformed
22 1 6 6 Deformed
23 1 5 5 Not Deformed
24 1 2 2 Deformed
25 1 3 3 Not Deformed
26 9 9 9 Deformed
27 1 4 4 Not Deformed
Rb Mean value 4.70
The overall Rb calculation results from twenty-seven sub-drainage basin are deformed and not deformed which are reflected by Rb values from 2-10 in ranges, with its mean
value is 4.70 The deformed area scaterred and expressed at the locations and each value such as: 2(2), 4(2), 6(6), 9(7), 12(10), 15(6), 17(2), 18(2), 19(6), 20(9), 21(7), 22(6), 24(2), and 26(9). While non deformed area scattered in the northern part, middle to southwestern part of the study area which is expressed by thirteen sub-drainage basin at the locations number and each value such as: 1(3), 3(5), 5(4), 7(4), 8(3), 10(3), 11(3), 13(4), 14(5), 16(5), 23(5), 25(3), and 27(4). It is supported by [2] that Rb value reflects the condition of rock which has not been fully consolidated, neither tectonic nor climatic by the deformation.
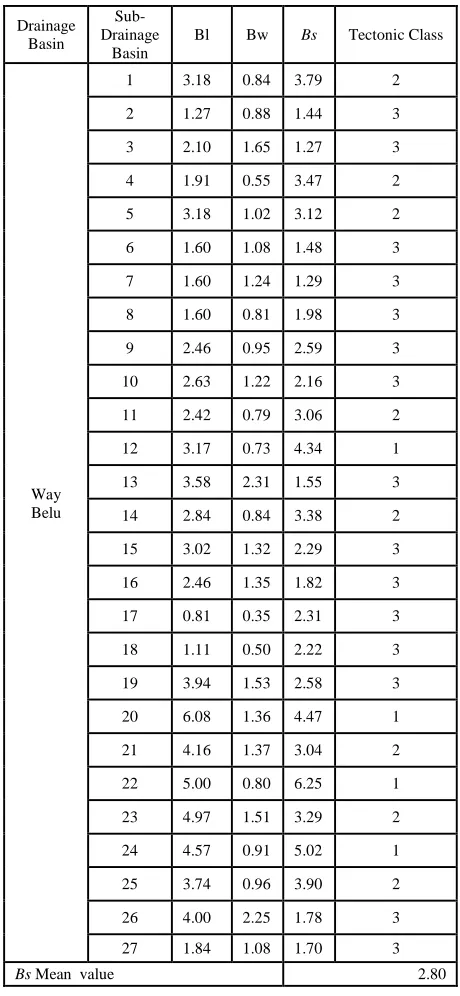
TABLE V
THE RESULT OF BASIN SHAPE INDEX (BS) CALCULATION
Drainage Basin
Sub-Drainage
Basin
Bl Bw Bs Tectonic Class
Way Belu
1 3.18 0.84 3.79 2
2 1.27 0.88 1.44 3
3 2.10 1.65 1.27 3
4 1.91 0.55 3.47 2
5 3.18 1.02 3.12 2
6 1.60 1.08 1.48 3
7 1.60 1.24 1.29 3
8 1.60 0.81 1.98 3
9 2.46 0.95 2.59 3
10 2.63 1.22 2.16 3
11 2.42 0.79 3.06 2
12 3.17 0.73 4.34 1
13 3.58 2.31 1.55 3
14 2.84 0.84 3.38 2
15 3.02 1.32 2.29 3
16 2.46 1.35 1.82 3
17 0.81 0.35 2.31 3
18 1.11 0.50 2.22 3
19 3.94 1.53 2.58 3
20 6.08 1.36 4.47 1
21 4.16 1.37 3.04 2
22 5.00 0.80 6.25 1
23 4.97 1.51 3.29 2
24 4.57 0.91 5.02 1
25 3.74 0.96 3.90 2
26 4.00 2.25 1.78 3
27 1.84 1.08 1.70 3
Bs Mean value 2.80
high to low classes. The calculation results of Bs values from fifteen sub-drainage basins shows low tectonic activities with the Bs values < 3 at the locations number and each value of Bs such as: 2(1.44), 3(1.27), 6(1.48), 7(1.29), 8(1.98), 9(2.59), 10(2.16), 13(1.55), 15(2.29), 16(1.82), 17(2.31), 18(2.22), 19(2.58), 26(1.78), and 27(1.70). And then some areas show high tectonic activity with the value of Bs > 4 identified at four sub-drainage basins at the locations number and each value of Bs such as: 12(4.34), 20(4.47), 22(6.25), and 24(5.02). They found spread widely in certain locations near Mt. Rindingan and south part of Mt. Kukusan. Furthermore, for the area that has moderate tectonic activity are shown at eight sub-drainage basin by assigning Bs values at the locations number and each of Bs such as: 1(3.79), 4(3.47), 5(3.13), 11(3.06), 14(3.38), 21(3.04), 23(3.29), and 25(3.90). The mean value of Bs is 2.80.
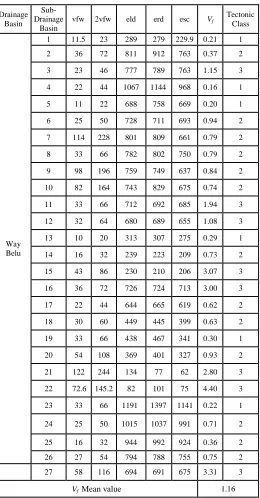
TABLE VI
VALLEY HEIGHT-WIDTH RATIO (Vf ) CALCULATION
Drainage Basin
Sub-Drainage
Basin
vfw 2vfw eld erd esc Vf
Tectonic Class
Way Belu
1 11.5 23 289 279 229.9 0.21 1
2 36 72 811 912 763 0.37 2
3 23 46 777 789 763 1.15 3
4 22 44 1067 1144 968 0.16 1
5 11 22 688 758 669 0.20 1
6 25 50 728 711 693 0.94 2
7 114 228 801 809 661 0.79 2
8 33 66 782 802 750 0.79 2
9 98 196 759 749 637 0.84 2
10 82 164 743 829 675 0.74 2
11 33 66 712 692 685 1.94 3
12 32 64 680 689 655 1.08 3
13 10 20 313 307 275 0.29 1
14 16 32 239 223 209 0.73 2
15 43 86 230 210 206 3.07 3
16 36 72 726 724 713 3.00 3
17 22 44 644 665 619 0.62 2
18 30 60 449 445 399 0.63 2
19 33 66 438 467 341 0.30 1
20 54 108 369 401 327 0.93 2
21 122 244 134 77 62 2.80 3
22 72.6 145.2 82 101 75 4.40 3
23 33 66 1191 1397 1141 0.22 1
24 25 50 1015 1037 991 0.71 2
25 16 32 944 992 924 0.36 2
26 27 54 794 788 755 0.75 2
27 58 116 694 691 675 3.31 3
Vf Mean value 1.16
The result of Vf calculations in general has high to low tectonic activities class with Vf values in range of 0.16 – 4.40. The mean value of Vf is 1.16. It explain that in Way Belu Drainage Basin is passed by the active tectonic activities. According to [1], [3], V-Shaped valleys associate with linear, active down cutting characteristic of areas subjected to active uplift. Flat-floors valleys demonstrate the base level of erosion in response to relative inactive tectonic. The calculation results of Vf values from six sub-drainage basins expresses tectonic class 1.They are represented at the locations number and each value of Vf such as: 1(0.21), 4(0.16), 5(0.20), 13(0.29), 19(0.30), and 23(0.22). They occupied near Mt. Rindingan, Mt. Kukusan and Mt. Tanggamus areas. The calculation results of Vf from thirteen sub-drainage basin expresses tectonic class 2 and are represented at locations number and each Vf value such as: 2(0.37), 6(0.94), 7(0.79), 8(0.79), 9(0.84), 10(0.74), 14(0.73), 17(0.62), 18(0.63), 20(0.93), 24(0.71), 25(0.36), and 26(0.75). They reflect that the basin is passed by moderate tectonic activity level which is occupied below of Mt. Kukusan. Furthermore, from eight sub-drainage basin expreses low tectonic activity level (tectonic class 3) at the locations number and each values of Vf such as:3(3.15), 11(1.94), 12(1.08), 15(3.07), 16(3.00), 21(2.80), 22(4.40), and 27(3.31). They found mostly scattered near Mt. Rindingan, Mt. Tanggamus, and southern part of Mt. Kukusan. Stream with low tectonic activity level correspond with low uplift rate which is indicated by U-shaped valley. Reference [25] stated that in general, the river with wider basin and U-shaped can occur due to lithology response factor that is less resistant to the erosion.
TABLE VII
ASYMMETRY FACTOR (AF) CALCULATION [1]
Drainage Basin
Sub-Drainage
Basin
Ar At AF Tilting
Class
Tectonic Class
Way Belu
1 0.84 2.03 41.38 Right 2
2 0.48 1.07 44.86 Right 3
3 1.53 2.85 53.68 Left 3
4 0.29 0.78 37.18 Right 2
5 1.24 2.29 54.15 Left 3
6 0.49 1.35 36.3 Right 2
7 0.14 0.19 73.68 Right 1
8 0.3 0.37 81.08 Left 1
9 0.48 1.32 36.36 Left 2
10 0.49 0.92 53.26 Left 3
11 0.93 1.63 57.06 Right 2
12 1.29 2.37 54.43 Right 3
13 0.67 1.1 60.91 Right 2
14 0.3 1.32 22.73 Right 1
15 0.79 2.28 34.65 Left 1
Way Belu
17 0.59 1.53 38.56 Left 2
18 1.19 1.97 60.41 Right 2
19 0.12 0.42 28.57 Left 1
20 2.24 3.7 60.54 Right 2
21 2.12 5.68 37.32 Right 2
22 2.05 5.76 35.59 Right 2
23 1.22 3.18 38.36 Left 2
24 3.91 5.99 65.28 Right 1
25 1.19 2.48 47.98 Right 3
26 6.09 7.27 83.77 Left 1
27 0.5 1.48 33.78 Right 1
AF Mean value 48.81
The AF calculation from twenty-seven sub-drainage basin which is shown in the Table 7 as above has values range from low to high (22.73-83.77). There are seven sub-drainage basins with value range from 44.86 to 54.43 which is reflected by low tectonic activity at location numbers and each AF value such as: 2(44.86), 3(53.68), 5(54.15), 10(53.26), 12(54.43), 16(46.06), and 25(47.98). And then, the twelve sub-basins have value range from 35.59 - 60.91 which is reflected by moderate tectonic activity at location numbers and each AF value such as: 1(41.38), 4(37.18), 6(36.3), 9(36.36), 11(57.06), 13(60.91), 17(38.56), 18(60.41), 20(60.54), 21(37.32), 22(35.59), and 23(38.36), and the mean value is 48.81. Last, the eight sub-drainage basins have value ranges from 22.73-83.77 which indicate high tectonic activity at the location numbers and each AF value such as: 7(73.68), 8(81.08), 14(22.73), 15(34.65), 19(28.57), 24(65.28), 26(83.77), and 27(33.78).
According to El [24] the value of morphotectonic indices like Bs, Vf, and AF can be used for IAT classification (Fig. 2). The result of Vf, Bs and AF from twenty-seven sub-drainage basin calculations show the average values for Bs is 2.44, Vf is 2.07, and AF is 1.96. IAT average value that is derived from calculation is 2.20. It explains that Way Belu Drainage Basin has moderate tectonic activities.
Fig. 2 Graphic of three morphotectonic indices to determine IAT classification.
B. The Result of Field Interpretation
Field observation related to the structures evidence through landscape features such as the lineament of hills, fault scarp, triangular facet, depression area, slicken-side, rockslide which is like a wine glass canyon, are shown in Fig. 3. Reference [7] stated, the lineament associated with the geological structure could provide information about the tectonic activities. Fault scarps which are found at Pengantin Waterfall and Pelangi Valley is an evidence of fault structure existences. They associate with the mass movement. It proves that in the study area is passed by the tectonic activities.
Fig. 3 (a) Morphology depression and triangular facet; (b) Rockslide area along the fault zone is found in the western part of Way Belu Drainage Basin at the southern east of Mt. Rindingan valley. It has trend NW-SE direction; (c) Fracture zone is found along the wall of Way Panas River; (d) slicken-slide (N 180° E) on andesitic basaltic lava in the wall of Way Panas River which is found in the southern west part of Way Belu Drainage Basin
Joints measurement conducted in several locations of fracture zone at Way Panas River, Pengantin Waterfall, and Pelangi Valley. Then the result of joint measurement plotted into a rosette and stereonet diagrams. A summary of the site response analysis of the joint measurement shown in Fig.4.
1) Way Panas River: The measurement of joints performed on the andesitic basaltic lava, located in the western part of the Mt. Tanggamus. Reference [4] shows joint can divide into systematic and non-systematic joint. The systematic joint is planar, parallel evenly spaced and regular at distance centimeters, meters, tens of meters or even hundred meters, whereas the non-systematic joint is so irregular in form, spacing, and orientation. In this location, the joint has non-systematical types where the fracture is classified as shear and extensional joint. Moreover, the shear joint has closed space and the fractures intersect each other with a tendency to form a sharp angle to the primary stress. While the extensional joint has an opening space and perpendicular to the main stress and is formed by extensional stress.
2) Pengantin Waterfall: The measurement of joints performed on the andesitic basaltic lava, located in the western part of Mt. Duduk. The conjugate joint as nonsystematic joint found at the observation point number 4. The fracture at this location classifies as shear and extensional joint. It is perpendicular to main stress as a result of extensional stress. Thus this is a sign of fault-related with
a
b
c
fractures that have a relative N-S main direction, and have the dominant stress trend of W-E.
Fig. 4 Rosette and Stereonet diagrams of joint analysis at (a) Pengantin Waterfall which is found at the southern west part of Mt. Rendingan; (b) Way Panas River at the southern west part of Mt. Tanggamus, and (c) Pelangi Valley which is also found at the southern west part of Mt. Rindingan. It is approximately 125 meter from Pengantin Waterfall to the North
3) Pelangi Valley: Pelangi Valley is located near Mt. Kukusan beside caldera rim. The measurement of joints performed on the andesitic - basaltic lavas located approximately 100 meters from Pengantin Waterfall. Conjugate joint is classified as the extensional joint. It has a relative major fracture NW-SE direction with the main NE-SW stress direction. The possibility of this region exposed to relatively high tension pressure is indicated by irregularly rocks fractured. Similar with Way Panas River, at Pelangi Valley also found fractures that form an extensional and shear joint. Shear joint found in this location has closed spaces and intersect each other with a tendency to form a sharp angle at the main tension and the extensional joint has a wider open space than at Way Panas River. Fracture extensions of these joints are perpendicular to the main tension and are formed by the extensional stress.
The rosette and stereonet diagrams are used to simplify the reading of joint measurement result. Rosette diagram informs about the fracture trend and the stereonet informs
about the trend of the stress which symbolizes with σ
(sigma). So, in this location, these joints can be classified as shear and extensional joint with the primary fracture trend relative to N-S and the dominant stress trend is W-E directions.
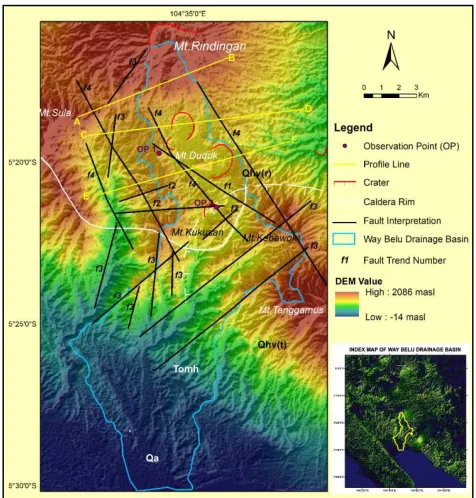
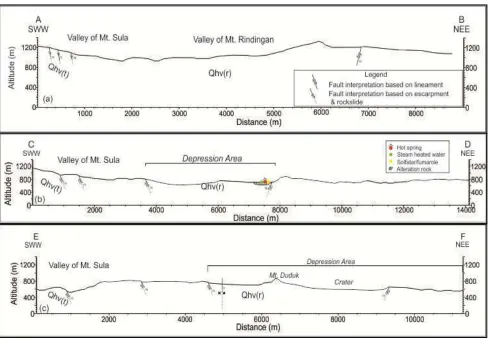
The ridge and valley lineaments can also interpret the geological structure in Way Belu Drainage Basin from ASTERG-DEM imagery. Emphasizing the lineament features show that the main geological structure in the Way Belu drainage basin are NW-SE trend (fault trend 1 or f1), forming a graben which is bounded by the W-E fault (fault trend 2 or f2). In the north part of Mt. Kukusan and below of Mt. Rindingan present a small circular features. A large circular feature indicates as a remnant of the caldera, lied along West Mt. Kukusan to the East direction through Mt. Duduk. It is bounded by fault trends NNE-SSW directions (fault trend 3 or f3) in the southern part of Mt. Kukusan. There is depression area with small craters inside. One of the crater is called Mt. Duduk crater. It is bounded by NNW-SSE fault direction (fault trend 4 or f4). The fault systems cause the formation of volcanic path which the NNW-SSE volcanic path is parallel to Semangko Fault such as Mt. Rendingan, Mt. Duduk, Mt. Kabawok and Mt. Tanggamus. They overlies on the Tertiary (Tomh), Quaternary volcanic product (Qhv), and aluvium (Qa) (Fig. 5).
The three profile show the fault that developed in the area reflected by morphological feature that looks like step horst-and graben. This structure also developed in the middle of deppresion area and form a weak zone. It cause the forming of Mt. Duduk and the appearance of geothermal surface manifestation such as hot spring, steam heated water, solfatara/fumarole, and alteration rock in several location, especially in the deppresion area (Fig. 6).
Rosette and stereonet diagrams at Way Panas River (OP-3) show that this area has shear, normal, and thrust fault with trending NNW-SSE (f4) and NW-SE (f1) directions and the stress of σ 1 is NE-SW, where the σ 1 relatively close to zenith as the indication of a normal fault. In this area found fractures zones that majority have NNW-SSE (f4) directions.
Stereonet diagram at Pengantin Waterfall (OP-1) show the σ 2 relatively close to zenith which indicates a strike-slip fault, while from rosette diagram it has two main trends of
fractured that has trending of NW-SE (f1) and NNE-SSW(f3) directions. Furthermore, a stereonet diagram of Pelangi Valley (OP-2) shows σ 3 relative close to zenith indicating a normal fault. By plotting strikes from slicken-side at the N70°E/80° fault zone and 8° pitch, it represent the main trend of the fractured rock is NNW-SSE. It seems possible the joint that takes place in the fractured zone may associate with the second order of synthetic and antithetic faults of Semangko Fault System.
Fig. 6 SWW-NEE direction of (a) AB; (b) CD; and (c) EF profiles showing structural pattern which form horst-graben features and become weak zone in the depression area due to tectonic activity passed through the study area. In the weak zones are found geothermal surface manifestation. The Qhv(r) is volcanic product from Mt. Rindingan, and the Qhv (t) is volcanic product from Mt.Sula, Mt. Kukusan, and Mt. Tanggamus
C. Discussion of Tectonic Activity in the Study Area
The high tectonic activity of an area will create fractured landform surface that makes an increase in the river branch number, total length, and lineament intensity. Several geomorphic indices are carried out to identify the level of tectonic activity. The calculation result is indicating the active tectonic level took place at several parts of the study area.
Based on Dd calculation, the study area dominates by moderate landform texture, but at several places in the eastern part of study area show coarse texture and at the middle part show fine texture landforms. Rb calculation indicates deformed tectonic landform at the northeast, middle and southwest part of the study area. The active tectonics can be seen from Rb and Dd values. The areas of Rb that have deformed are relatively similar at Dd locations. The configuration of the earth surface, shape, and dimension of
its landscape can be measured by morphometric and mathematical analysis [6]. Thus, from two geomorphic indices which is Dd and Rb, confirming the intense tectonic activity at the North (near Mt. Rindingan), middle (depression area), and Southwest (southwest part of Mt. Kukusan) of Way Belu Drainage Basin.
observation shows the valleys mostly have narrow valleys formed along the hills and triangular facet especially near depression area. It means that the river along the narrow, steep slopes to widened hills developed under the decreasing of high–moderates uplift rate [22]. They are expressed by low Vf values. Furthermore, the higher Vf value can occur due to lithological response factor that less resistant to the erosion is very high and change the shape of the river basin becomes more extensive and U-shaped. The areas with high Vf value has tectonic activity class 1. They are characterized by a valley which has a sloping elevation. In the Way-Belu Drainage Basin, there also has tectonic activity class 3 (low uplift rate) which occupy in the western (near Pelangi Valley) and middle part of Way Belu Drainage Basin (depression area). It reflects the form of a wide valley and low elevation. On the other hand, AF calculations show the tilting intensity of the basin. The sub-basin mostly tilted to the right side. They are scattered near Mt. Kukusan area. The tilting caused by the structure fault that pass the stream and form uneven valley.
Based on morphometric and morphotectonic analysis, the area which is affected by the active faults, in some places, relatively have small Dd values ranging from 1.45-2.61 (developed; coarse texture) and Rb values <2 or > 5 (developed; deformed). The values of Vf is 0.16-0.3 (class 1, developed; tectonic active), the values of Bs is 4.34-6.25 (class 1, developed; high uplift rate), and AF values is 22.73 – 83.77 (class1, tectonic active). Meanwhile, in several places, they have Bs; 1.29-2.59 (class 3, developed; low tectonic activity), Vf; 1.08-4.40 (class 3, low tectonic activity), and AF; 44.86 – 54.43 (class 3, low tectonic activity). But, overall, IAT value shows that Way Belu Drainage Basin has moderate tectonic activity. The low tectonic activity values are found scattered in depression area most likely caused by strong erosion. Although some of the Vf and Bs value in this area show low tectonic activity, the actual phenomenon show different respond. This can be happening due to high intensity of erosion or morphological feature already shattered due to tectonic or volcanic release.
To validate those calculations, the study needs to be overlaid and integrated with field interpretation in one another. Therefore the morphometric and morphotectonic analysis are confirmed by empirical evidence that found from fieldwork. The area which is affected by the active fault is characterize by the presence of fractures in the rock, slicken-side, escarpment fault, ridge and valley lineaments, land-slide which occurs in the depression area. Rosette diagram of valley lineaments express their trend directions related to the first order structure (primary fault). Relatively, NE-SW (f1) and W-E (f2) trends related to synthetic and antithetic fault, while NW-SE is a secondary fault. The joints at Pelangi Valley and Pengantin Waterfall have trend that similar to the synthetic and antithetic of the primary fault located in the northern part of Mt. Kukusan. While, at the southern part found in Way Panas River, the trend of the joints related to the second order of synthetic and antithetic fault. The rosette and stereonet diagrams illustrated that in the Way Panas River, the pattern of joint trending is NW-SE and NE-SW directions. It also indicates an oblique fault
(normal strike-slip) occurrence which is expressed by σ1 and
σ2 relative close to zenith. At Pengantin Waterfall and
Pelangi Valley, there are joints trending with NNE-SSW and NNW-SSE directions. Pengantin Waterfall joint is indicating
strike-slip fault due to σ2 relative close to zenith and Pelangi
Valley joint is indicating thrust fault which is expressed by
σ3 close to zenith. Therefore, Pelangi Valley has fault
movement relative oblique (thrust strike-slip). Generally, all the faults are relatively similar with the direction of the Semangko Fault as a synthetic and antithetic fault. These faults are estimated as a minor fault of the Semangko Fault System. They are paired pattern and include in young fault system. Meanwhile, the old fault system has pattern NW-SE and NE-SW. Besides, there are depression structures that almost circular and cutting through Quaternary volcanic rocks around the area.
The southern Semangko Fault has right lateral strike-slip fault that is outlined about 1660 km on Sumatra and observed from several parameters such as geologic unit offset, river offset, and geodetic size including the Global Positioning System (GPS) points out that the slip ratio is in southeastern Sumatra is about 6 mm/yr. [6], [9]. It is correspond with phenomenon in study area. There are fault escarpment, fault breccia, and mass movement (offset). And also, the drainage basin of Way Belu area is characterized by general uniform lithology (volcanic products) that was tectonically deformed during the Tertiary-Quaternary periods. It most likely represents the correlation of landscape with the second order of the Semangko Fault. In fact, Way Belu Drainage Basin situated enclosed to the main Sumatra Semangko Fault System. It could be considered that in Way Belu drainage basin has an active tectonic activity which is confirmed by the result of field interpretation and quantitative geomorphic indeces assesments. In order to validate the tectonic intensity of fault that related to the Semangko Fault System, this study combine geomorphic idices to derive IAT value.
Fig. 7 Based on the ASTERG-DEM image, source; [19] shows the position of Way Belu Drainage Basin to the Semangko Fault System. The combination of geomorphic indices assessment and field interpretation results supports that the trend of NNW-SSE, NNE-SSW and NW-SW directions at Way Belu Drainage Basin as synthetic and antithetic faults of Semangko Fault System.
In addition, in this area are found geothermal manifestations that are predicted come to the surface from the reservoir through the fractures of rock which is caused by the geological structure activities formed the permeability in the rock to pass the geothermal fluid. Its ensure that the fault in the study area are likely to be active.
IV.CONCLUSIONS
The quantitative geomorphic indices assessment combined with the satellite imagery and field interpretations in this work indicate that the Way Belu Drainage Basin is tectonically active with the more uplift landform concentrated along Mt.Rindingan at western and eastern part of Mt. Kukusan. They are related to Semangko Fault System. Moreover, Dd and Rb values show that Way Belu has coarse to medium texture. The coarse landform relative unstable. It is caused by the deformation due to tectonic which is shown by Rb value below 3 and more than 5, and the Dd values is 1.45-2.61 in ranges. The coarse landform texture with unstable landform occurs around Mt.Rindingan and near Mt. Kukusan.
In conclusion, IAT in the study area express moderate to high tectonic activity with average value of 2.20. The highest tectonic activity is found in the north and south of Way Belu Drainage Basin with values of the Vf is 0.16-0.30, Bs is 4.34-6.25 and AF is 22.73-83.77 in ranges.
Based on the combination of quantitative
geomorphometric indices (morphometric and
morphotectonic analysis), geological structures which are developed in Way Belu Drainage Basin mainly have four fault directions. Each of them represented different fault trend direction. Fault direction 1 (f1) has NW-SE trend direction, fault directon 2 (f2) has W-E direction. Fault
direction 3 (f3) has NNE-SSW direction. And then, fault direction 4 (f4) has NNW-SSE direction. They can be classified as strike-slip fault and oblique fault with the majority of fault trend is NNE-SSW which form big graben.
Based on the explanation as above, in Way-Belu Drainage Basin has moderate to high tectonic activity. And then the trend directions can assure that the structures developed in the Way Belu drainage basin is the result of a secondary order of synthetic and antithetic faults of Semangko Fault System. They scatter along the northern, middle and the southern part of the drainage basin. This tectonic activity considered as the result of Semangko strike-slip fault system which is controlled by subduction at the western part of Sumatra Island which form NNW-SSE volcanic belt that parallel to Semangko Fault. It is suggested that the quantitative geomorphic indices are suitable for the tectonic activity assessment in the study area.
ACKNOWLEDGEMENT
With great respect, the author would like to thank the leadership of Padjadjaran University who has provided private grant funds in ALG. Thanks also to Mr. Siahaan E.E., from PT Pertamina Geothermal Energy and Proffessor Adjat Sudradjat for their patience and helpful guidance in writing the manuscript. Also thanks to Murni Sulastri Saripudin and Puspa Khaerani who give support and spirit during the preparation of this paper. Appreciate all those who reviewed this paper. May God give a better reply to them so that this paper can publish. Hopefully, this writing is useful to many people. The Authors don’t have any conflict of interest. The authors themselves are responsible for this author.
REFERENCES
[1] E. A. Keller and N. Pinter, Active Tectonics: Earthquakes, Uplift,
and Landscape, 2nd Edition. New Jersey: Prentice Hall, 2002.
[2] D. Gentana, E. Nurfiadi, I. Syafri, I.P.Y. Rosa, and M. Sulastri, “The role of physical-mechanical characteristics of weathered volcanic rock to the potential mass movement at the southern part of Garut, West Java, Indonesia,” in Proc. The 24th Annual scientific
conference & exhibitions, Federation International Surveyors, 2016,
pp. 1–12.
[3] J.V. Pérez-Peña, A. Azor, J.M. Azañón, and E.A. Keller, “Active tectonics in the Sierra Nevada (Betic Cordillera, SE Spain): Insights from geomorphic indexes and drainage pattern analysis,”
Geomorphology, vol. 119, pp. 74–87, June 2010.
[4] H.G. Davis, J. Reynolds, Stephen, F. Kluth, and Charles. Structural
Geology, 3rd edition. USA: John Wiley & Sons. Inc., 2011.
[5] A. Masoud and K. Koike, “Applicability of computer-aided comprehensive tool (LINDA: Lineament Detection and Analysis) and shaded digital elevation model for characterizing and interpreting morphotectonic features from lineaments,” Compututers &
Geosciences, vol.106, pp. 89–100, Sept. 2017.
[6] E. Sukiyah, E. Sunardi, N. Sulaksana, and P.P.R. Rendra, “Tectonic geomorphology of upper cimanuk drainage basin, West Java, Indonesia,“ International Journal on Advance Science, Engineering
and Information Technology, vol. 8, no. 3, pp. 863–869, 2018.
[Online]. Available: http://dx.doi.org/10.18517/ijaseit.8.3.5441. [7] E. Sukiyah, I. Syafri, B.J. Winarto, B. Susilo, A. Saputra, and E.
Nurfadli, “Active faults and their implications for regional development in the southern part of West Java, Indonesia,” in Proc.
The 24th annual scientific conference & exhibitions, Federation International Surveyors, 2016, pp. 1–12 .
[8] V.A.Argyriou, M.R. Teeuw, A. Sarris, “GIS-Based Landform Classification of Bronze Age Archaelogical Sites on Crete Island,”
[9] R. McCaffrey, “The Tectonic Frame Work Of The Sumatran Subduction Zone,” Annu. Rev. Earth. Planet. Sci., 37:3.1–3.22, 2009. [10] D. Gentana, N. Sulaksana, E. Sukiyah, and E.T. Yuningsih, “Determination of tanggamus geothermal prospect area, Lampung Provinces, based on remote sensing and 3D micromine software,” in
Proc.The 25th annual scientific conference & exhibitions. Federation International Surveyors, 2017, pp. 1–12.
[11] Amin. The Geology of The Kotaagung, Sumatera Map, quadrangle
1010, scale 1: 250.000. Bandung: Indonesia Geological Survey
Institute, 1973
[12] K. Umeda, “Localized extensional tectonics in an overall reverse-faulting regime, Northeast Japan,” Geoscience Letters, vol. 2, no. 12., 2015.
[13] H. Fossen, Structural Geology. Cambridge University Press, 2016. [14] E. Sukiyah, I. Syafri, A. Sjafrudin, E. Nurfadli, P. Khaerani, and
D.A.P. Simanjuntak, “Morphotectonic and satellite imagery analysis for identifying quaternary fault at the southern part of Cianjur-Garut region, West Java, Indonesia,” in Proc. Asian Conference on Remote
Sensing, 2015, pp. 1–10.
[15] I.S. Stewart and P.L. Hancock, Neotectonics. In: Continental
Tectonics. London: Pergamon Press, 1994.
[16] A. Demoulin, “Basin and river profile morphology: A new index with a high potential for relative dating of tectonic uplift,”
Geomorphology 126, 97 – 107, 2011.
[17] M.J. Rickard, “Fault classification – discussion,” Geological Society
of America Bulletin, 2545-2546, 1972.
[18] R.E. Horton, “Erosional development of stream and their drainage basins: a hydrophysical approach to quantitative morphology,”
Geological Society of America Bulletin, 1945.
[19] NASA. (2016). ASTERG-DEM. Entity ID: ASTGDEMV2_0S06 E104. [Online]. Available: https://earth explorer. usgs.gov/. [20] J. Yangchan, A.K. Jain, A.K. Tiwari, and A. Sood, “Morphometric
analysis of drainage basin through GIS: a case study of sukhna lake watershed in lower shiwalik, India,” International Journal of
Scientific & Engineering Research, 6(2), 1015-1023, 2015.
[21] H. Th. Verstappen, Applied Geomorphology: Geomorphological
Surveys for Environmental Development. New York: Elsevier
Science Pub. Co. Inc., 1983.
[22] W.B. Bull and L.D. McFadden, “Tectonic geomorphology north and south of the Garlock fault, California,” in Proc. 8th annual
geomorphology symposium, 1977, pp. 115–137 .
[23] M. Dehbozorgi, M. Pourkermani, M. Arian, A.A. Matkan, H. Motamedi, and A. Hosseiniasl, “Quantitative analysis of relative tectonic activity in the Sarvestan area, central Zagros, Iran,”
Geomorphology 121, 2010.
[24] R. El Hamdouni, C. Irigaray, T. Fernández, J. Cahacón, and E.A. Keller, “Assessments of relative active tectonics, southwest border of the Sierra Nevada (southern Spain),” Geomorphology 96, 2008. [25] N. Sulaksana, Supriyadi. Ismawan. P.P. Raditya, and M. Sulastri,
“Active fault analysis through quantitative assessment method in Cikapundung Sub-drainage basin,” International Journal of Study in
Science & Technology, vol.3, 147-153, 2017.
[26] A. Habibi and M. Gharibreza, “Estimation of the relative active tectonics in Shahriary basin (Central Iran) using geomorphic and seismicity indices,” Natural Environment Change, 1(1), 71-83. 2015. [27] E.J. Mosavi, M. Arian, M. Ghorshi, M. Nazemi, “Neotectonics of Tabas area, central Iran by Index of Active Tectonics (IAT),” Open
![Fig. 3. Reference [7] stated, the lineament associated with the geological structure could provide information about the tectonic activities](https://thumb-us.123doks.com/thumbv2/123dok_us/9988174.1986962/7.595.42.287.545.688/reference-lineament-associated-geological-structure-information-tectonic-activities.webp)
![Fig. 7 Based on the ASTERG-DEM image, source; [19] shows the position of Way Belu Drainage Basin to the Semangko Fault System](https://thumb-us.123doks.com/thumbv2/123dok_us/9988174.1986962/11.595.48.279.50.298/based-asterg-source-position-drainage-basin-semangko-fault.webp)
