P R E L I M I N A R Y R E S E A R C H
Open Access
The effect of volume of interest definition on
quantification of lymph node immune response
to a monkeypox virus infection assessed by
18
F-FDG-PET
Svetlana Chefer
1*, Richard C Reba
2, Christopher Z Leyson
1, Jurgen Seidel
1, Reed F Johnson
3, Joseph E Blaney
3,
Peter B Jahrling
3and Julie Dyall
1Abstract
Background:2-deoxy-2-[18F]fluoro-D-glucose-positron emission tomography (18F-FDG-PET) is applied in the clinic for infection assessment and is under consideration for investigating the inflammatory/immune response in lymphoid tissue in animal models of viral infection. Assessing changes in18F-FDG uptake of lymph nodes (LNs), primary lymphoid tissues targeted during viral infection, requires suitable methods for image analysis. Similar to tumor evaluation, reliable quantitation of the LN function via multiple18F-FDG-PET sessions will depend how the volume of interest is defined. Volume of interest definition has a direct effect on statistical outcome. The current study objective is to compare for the first time agreement between conventional and modified VOI metrics to determine which method(s) provide(s) reproducible standardized uptake values (SUVs) for18F-FDG uptake in the LN of rhesus macaques.
Methods:Multiple18F-FDG-PET images of LNs in macaques were acquired prior to and after monkeypox virus intravenous inoculation. We compared five image analysis approaches, SUVmax, SUVmean, SUVthreshold, modified SUVthreshold, and SUVfixed volume, to investigate the impact of these approaches on quantification of the changes in LN metabolic activity denoting the immune response during viral infection progression.
Results:The lowest data repeatability was observed with SUVmax. The best correspondence was between SUVfixed volumeand conventional and modified SUVthreshold. A statistically significant difference in the LN18F-FDG uptake between surviving and moribund animals was shown using modified SUVthresholdand SUVfixed volume(adjusted
p= 0.0037 andp= 0.0001, respectively).
Conclusions:Quantification of the LN18F-FDG uptake is highly sensitive to the method applied for PET image analysis. SUVfixed volumeand modified SUVthresholddemonstrate better reproducibility for SUV estimates than SUVmax, SUVmean, and SUVthreshold. SUVfixed volumeand modified SUVthresholdare capable of distinguishing between groups with different disease outcomes. Therefore, these methods are the preferred approaches for evaluating the LN function during viral infection by18F-FDG-PET. Validation of multiple approaches is necessary to choose a suitable method to monitor changes in LN metabolic activity during progression of viral infection.
Keywords:PET, Immune response quantitation; Animal model; SUV; Monkeypox; Intravenous inoculation
* Correspondence:[email protected]
1Division of Clinical Research, Integrated Research Facility, National Institute of Allergy and Infectious Diseases, National Institutes of Health, 8200 Research Plaza, Frederick, MD 21702, USA
Full list of author information is available at the end of the article
Background
Assessment of cell glucose metabolism by 2-deoxy-2-[18F]fluoro-D-glucose (18F-FDG) and positron emission tomography (PET) is a powerful supplement to conven-tional studies of viral infection in animal models to characterize disease progression and evaluate the efficacy of potential treatments [1,2]. Lymphadenopathy is one of the predominant clinical signs of monkeypox virus infec-tion in nonhuman primates (NHPs) and humans. There-fore, a reasonable method to monitor the evolving lymph node (LN) immune response is assessment of LN meta-bolic activity using standardized uptake value (SUV) as a simple semiquantitative measure of18F-FDG uptake [3,4]. Similar to the methodological issues associated with the analysis of18F-FDG-PET images in oncology [5], comput-ing the SUVs and reliably evaluatcomput-ing the LN immune response to viral infection will depend on an exact and re-producible definition of the volume of interest (VOI). VOI definition for PET image quantitation is still an open re-search area, and users are applying the most reliable and reproducible techniques suitable for analysis of different types of disease (e.g., tumors, inflammatory conditions). Although the VOI definition is not the only factor that can affect the reproducibility of SUV estimates in the LN [5-7], the type and size of a VOI may greatly contribute to the variability of such measurements. Such variation has been previously demonstrated with tumor quantitation using18F-FDG-PET imaging [7,8].
A variety of methods have been proposed to define tumor VOI, but no reference standard has been accepted. Commonly used approaches for quantitative analysis of
18
F-FDG-PET images include the following: 1) measuring the value of the voxel with the highest activity within the tumor (SUVmax) [9,10], 2) averaging the SUVs from the
voxels inside the whole tumor defined by freehand outline of tumor boundaries (SUVmean) [11-13], 3) averaging the
voxels with the SUVs greater than a certain percentage of SUVmax using thresholding techniques (SUVthreshold)
[7,14,15], or 4) using fixed volume (SUVfixed volume)
de-fined as the average SUV within a fixed-size VOI centered over a region with high metabolic activity without con-forming to the precise tumor outline. A similar concept of SUVfixed volumehas been used by Boellaard et al. and was
called SUVpeak[6].
These VOI metrics are rather general and, as such, are not optimized to detect reproducible changes in18F-FDG uptake (as measured by SUVs) during viral infection progression in a small target organ (LN). In particular,
18
F-FDG uptake during early viral infection is difficult to measure as normal or near normal LNs have low glyco-lytic activity comparable to background. The lack of data on the agreement between varied methods to provide re-producible SUV estimates of the metabolic activity of LN has prompted us to develop new methods for VOI
metrics. We evaluated new methods, SUVfixed volume and
modified SUVthreshold (mSUVthreshold), against
conven-tional (SUVmax, SUVmean, SUVthreshold) metrics. Here, we
report the statistical reliability of each of these methods on quantitative assessment of18F-FDG uptake changes in axillary LNs of rhesus macaques (Macaca mulatta) fol-lowing a monkeypox virus intravenous challenge. To test interscan reproducibility, data from three baseline com-puted tomography (CT) and PET scans prior to monkey-pox virus inoculation were used to measure LN volumes and SUVmax, SUVmean, SUVthreshold, SUVfixed volume, and
mSUVthresholdin these animals.
Methods
Animals were housed in a facility accredited by the Asso-ciation for Assessment and Accreditation of Laboratory Animal Care International. All experimental procedures were approved by the National Institute of Allergy and In-fectious Diseases, Division of Intramural Research, Animal Care and Use Committee and were in compliance with the Animal Welfare Act regulations, Public Health Service policy, and theGuide for the Care and Use of Laboratory Animalsrecommendations.
Subjects
Six male rhesus macaques housed in biosafety level 3 containment, weighing 3 to 4 kg, were infected intraven-ously with 5 × 10⁷ plaque forming units of monkeypox virus (MPXV Zaire 79 strain [V-79-I-005]) (for virus preparation and inoculation procedures, see Additional file 1). Three animals were treated intravenously with cidofovir (5 mg/ml/kg in Dulbecco’s modified Eagle’s medium; Gilead Sciences, Foster City, CA, USA) that has been shown to protect against monkeypox virus in-fection. The antiviral agent, cidofovir, was administered on day −1 prior to monkeypox virus challenge and on days +1, +3, +5, +7, +10, and +13 after challenge. NHPs received 25 mg/kg of probenecid by gavage 1 h before cidofovir injection to prevent cidofovir nephrotoxicity. Three animals comprised the untreated control group.
Data acquisition
scans were performed prior to monkeypox virus inocu-lation (days−20,−15, and−5) and up to six scans were conducted postinoculation (days +1 or +2, +3 or +4, +7 or +8, +10, +16, and +21). The scans were conducted in the morning; the animals were fasted overnight for 12 h prior to the scanning session. The blood glucose concen-trations were measured prior to the18F-FDG injection be-fore each scanning sessions. PET images were acquired in three-dimensional (3D) mode and reconstructed itera-tively using 3D-ordered subsets expectation maximization algorithm with two iterations and nine subsets followed by 18 iterations of maximum a posteriorireconstruction [17]. Maximuma posterioriparameters were adjusted to provide a uniform spatial resolution of 1.8 mm (FWHM = 1.8 mm) in all three directions. Methods for scatter, decay, random, and attenuation correction were applied during the process of PET image reconstruction.
CT images were acquired with a CereTom® (NeuroLogica Corp., Danvers, MA, USA) 8-slice mobile head-and-neck CT scanner that was installed in close proximity to the microPET scanner. The CereTom® CT scanner provided 190 slices with 0.49 × 0.49 mm in-plane resolution and 1.25-mm slice thickness that were acquired at 120 kVp and 5 mA. CT scans were taken either immediately
before or after PET imaging to ensure consistent animal position and fusion of the PET and CT scans for data analysis. Incorporating the use of the same table for both scanners eliminated the need for animal reposi-tioning. To restrict animal motion, the animal was se-cured by anchoring the limbs and by controlling the level of anesthesia. CT scans were used for attenuation correction and coregistration with PET images to define anatomical localization of the LNs of interest. In addition, CT images were used to obtain the LN volume applied for SUVmeancomputation to determine interscan data
repro-ducibility prior to viral challenge.
Image analysis
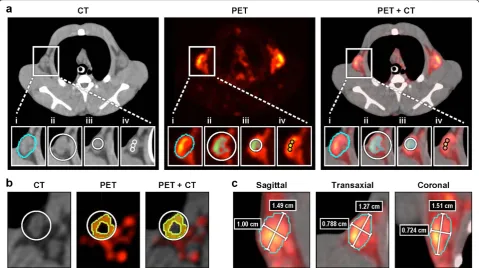
Data analysis was performed using MIM workstation software version 5.2.2 (MIM Software Inc., Cleveland, OH, USA). The largest LN in the axillary fossa was chosen for analysis. This LN usually is positioned close to the body surface and easy to identify. VOIs were first specified on CT images coregistered with PET images. The volume of a whole LN was delineated by manually drawing the peripheral boundary on each of the slices where it appeared (Figure 1a (i)). SUVs from all the voxels inside this volume were averaged to calculate SUVmean.
Figure 1Definition of ROIs used for18F-FDG uptake quantitation in the axillary LN.CT, PET, and fused CT/PET images of the same LN
obtained on day 3(b)and day 8(a,c)postinoculation of monkeypox virus.(a)SUVmean(i), SUVthreshold(ii), mSUVthreshold(iii), and SUVfixed volume
(iv) (see“Methods”for details).(b)An example of inclusion of the voxels (chartreuse) from surrounding tissue with higher SUVs compared to the voxels (black) within the LN when SUVthresholdmetrics was applied to PET image.(c)Delineation of a LN center and dimensions for VOIs
The SUV with the highest value within the LN volume identified by the MIM program was recorded as SUVmax.
To compute the SUVthreshold, a ‘threshold’ option in
MIM was selected to place a sphere around the whole LN (Figure 1a (ii)). The tool averaged the voxels inside the sphere above a specified threshold that was set at 50% of the maximal voxel value. As the LN metabolic activity was often below that of surrounding tissue at baseline (Additional file 2) and during early infection (day 3/4, Additional files 2 and 3, Figure 1b), we also used a modi-fied SUVthreshold (mSUVthreshold) method to exclude the
voxels outside the LN. mSUVthreshold was calculated by
averaging all the voxels with SUVs above 50% of the max-imal value within a sphere inside the LN edges (Figure 1a (iii)). The diameter of a sphere was chosen based on the smallest LN axis defined on CT images. First, to specify the smallest axis, the CT images in 3D view were exam-ined to identify the edges and the center of a LN (Figure 1c). When the approximate center of a LN was lo-cated, two perpendicular lines were drawn on LN slices in transaxial, coronal, and sagittal views following the largest and the smallest LN axis on each view (Figure 1c). When the sphere diameter was specified, the sphere was placed strictly within the edges of the LN (Figure 1a (iii)).
We also applied a fixed dimension method,
SUVfixed volume, by creating a template of three
identi-cal small spheres (0.2 cm diameter, total of 21 full voxels in all three spheres), placed contiguously within the longest axis of the LN. The sphere diameter was chosen based on the smallest LN axis (range 0.25 to 0.39 cm) among all animals determined on baseline CT images. The three spheres were transferred to each new data set by determining the center of the LN (defined by the inter-section of axes in 3D view, Figure 1c), placing the middle sphere in the LN center and the other two spheres adja-cent to the first one along the long axis of a LN in transax-ial view. By using three small spherical VOIs, we adjusted the VOI location to the shape of the LN of each subject. Although the size and shape of the LNs differed, the VOI covered similar locations in the middle of each LN. The SUVfixed volumewas computed by averaging the SUVs from
21 voxels covered by three spheres.
For SUV calculation, the radioactivity concentration from the VOI on the PET image was divided by the injected dose and normalized to the body weight of the animal and radioactive decay for the time point of18F-FDG injection
SUV ¼decay corrected radioactivity concentration
MBq=ml
ð Þ injected dose MBqð Þ body weight gð Þ
Statistical analysis
The correlation between the volume measurement on pre-inoculation CT scans 1 and 2, 1 and 3, and 2 and 3
was calculated using the Pearson product-moment cor-relation coefficient (r). Application of the Kolmogorov-Smirnov test [18] confirmed that the difference between the pairs of scans followed a Gaussian distribution. To investigate the interscan reproducibility of three baseline scans, we compared scans 1 and 2, 1 and 3, and 2 and 3 for LN volumes and SUVmean, SUVmax, SUVthreshold,
mSUVthreshold, and SUVfixed volume using Bland-Altman
analysis [19]. The mean difference, standard deviation of the mean differences (SD), coefficient of repeatability (CR), and limits of agreement (LoA) were calculated and represented as Bland-Altman plots. The SD was calcu-lated by squaring all the differences, adding them up, dividing them by the number of measurements, and tak-ing the square root. The LoA were calculated by addtak-ing (upper limit) or subtracting (lower limit) the CR, defined as CR = 1.96 × SD, from the mean difference. This ana-lysis of data reproducibility was performed with the as-sumption that the animal health status did not change during the time the scans were obtained 5 to 21 days prior to monkeypox virus inoculation. Unchanged animal health status was confirmed by physical examination.
Bland-Altman analysis was subsequently used to inves-tigate the agreement between five VOI metrics for peak
18
F-FDG uptake in the LNs of survivors on day 10 after inoculation. The differences obtained for each animal were plotted against the mean differences of the respect-ive pairs of VOI measures. For acceptable agreement, the 95% LoA (±1.96 SD of the mean difference) should include 95% of the difference between the methods of measurement. Two-way repeated measures analysis of variance (ANOVA) was employed to explore the differ-ence between treated and untreated groups or surviving and moribund groups in LN18F-FDG uptake using SUVs with five different VOI metrics. We used18F-FDG uptake value at different time points (days −1, −2, −3 pre- and days +1 or +2 and +3 or +4 postinoculation with mon-keypox virus) as within factor and treatment or disease outcome as between factors, respectively. Post hoc com-parisons were performed using Bonferroni test. GraphPad Prism 6.01 (GraphPad Software Inc., La Jolla, CA, USA) was used for all statistical analyses.
Results
Three baseline CT scans prior to monkeypox virus in-oculation were used to investigate interscan repeatability of analysis of LN volumes from the right axilla for appli-cation in SUVmean computations. The mean LN volume
and 0.94 (p= 0.005), respectively. A good agreement tween the LN volume measurements on different days be-fore inoculation was confirmed by Bland-Altman analysis (Figure 2). The mean differences and SD of the LN vol-ume from scans 1 and 2 (Figure 2a), 1 and 3 (Figure 2b), and 2 and 3 (Figure 2c) were 0.022 ± 0.06, 0.003 ± 0.060, and 0.018 ± 0.048 cm3, respectively. CRs of these scans were 0.13, 0.12, and 0.09, respectively.
The range of blood glucose concentrations for all ani-mals (n= 6) measured before each scanning session var-ied between 60 and 72 mg/dL. No correlation was noted between changes in 18F-FDG uptake over the course of monkeypox virus infection and the variation in glucose concentration measured before each scanning session on different days before and after virus inoculation.
Mean SUV ± SDs for three baseline scans, 1.98 ± 0.74 (SUVmean), 6.25 ± 2.21 (SUVmax), 3.55 ± 0.90
(SUVthreshold), 3.36 ± 1.09 (mSUVthreshold), and 3.20 ±
1.25 (SUVfixed volume) in all the animals varied depending on
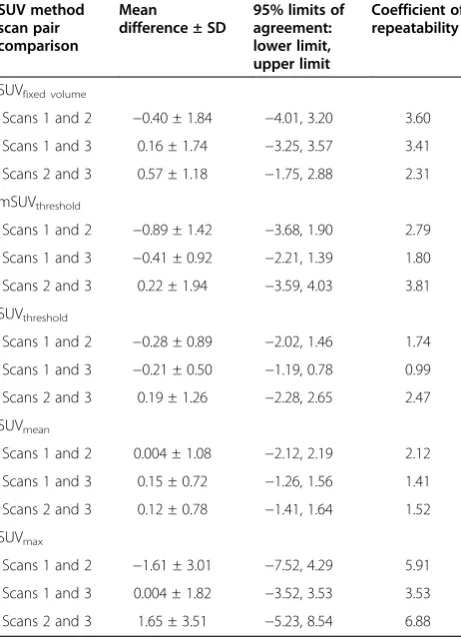
VOI metrics. To determine interscan variability, the mean differences in SUVs from each of the three baseline PET scans were calculated by Bland-Altman analysis. Although all the differences for the SUVs were within ±1.96 SD, the worst agreement for the baseline scans was with SUVmaxas
shown by greater values for three outcome measures of Bland-Altman analysis, the mean difference and SD, 95% LoA, and CR (Table 1). Compared with mSUVthresholdand
SUVfixed volume, SUVmeanand SUVthreshold had smaller SDs
on different scanning days as a result of larger volumes used in these SUV computations.
Following inoculation of monkeypox virus, the charac-terization of infection in NHPs and histological evalu-ation of LN tissue during infection is described in Additional file 1. One animal in the untreated group survived the infection, while the remaining two subjects became moribund on day 7 after inoculation.
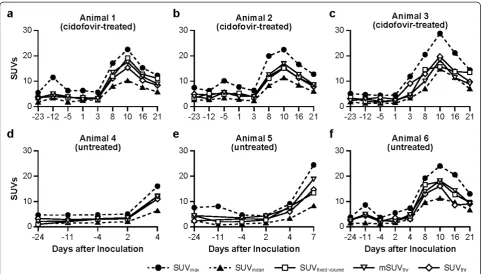
In examining VOI metrics, all five SUVs showed good concurrence for the pattern of changes in LN metabolic activity in survivors (animal numbers 1 to 3 [cidofovir-treated], number 6 [untreated]) over the course of mon-keypox virus infection (Figure 3). 18F-FDG uptake was Figure 2Bland-Altman plots comparing the agreement between the LN volume measurements from baseline CT scans.Scans were performed on three separate days prior to monkeypox virus inoculation. Differences between two pairwise measurements of LN volumes in each animal (n= 6) (scans 1 and 2(a), 1 and 3(b), and 2 and 3(c)) are plotted against mean volume of the two scans. Dashed lines show the limits of agreement, and solid lines show the mean difference between LN volumes.
Table 1 Repeatability of18F-FDG SUV measurements in the LN of normal rhesus macaques using SUVs with different VOI metrics
SUV method scan pair comparison
Mean
difference ± SD
95% limits of agreement: lower limit, upper limit
Coefficient of repeatability
SUVfixed volume
Scans 1 and 2 −0.40 ± 1.84 −4.01, 3.20 3.60
Scans 1 and 3 0.16 ± 1.74 −3.25, 3.57 3.41
Scans 2 and 3 0.57 ± 1.18 −1.75, 2.88 2.31
mSUVthreshold
Scans 1 and 2 −0.89 ± 1.42 −3.68, 1.90 2.79
Scans 1 and 3 −0.41 ± 0.92 −2.21, 1.39 1.80
Scans 2 and 3 0.22 ± 1.94 −3.59, 4.03 3.81
SUVthreshold
Scans 1 and 2 −0.28 ± 0.89 −2.02, 1.46 1.74
Scans 1 and 3 −0.21 ± 0.50 −1.19, 0.78 0.99
Scans 2 and 3 0.19 ± 1.26 −2.28, 2.65 2.47
SUVmean
Scans 1 and 2 0.004 ± 1.08 −2.12, 2.19 2.12
Scans 1 and 3 0.15 ± 0.72 −1.26, 1.56 1.41
Scans 2 and 3 0.12 ± 0.78 −1.41, 1.64 1.52
SUVmax
Scans 1 and 2 −1.61 ± 3.01 −7.52, 4.29 5.91
Scans 1 and 3 0.004 ± 1.82 −3.52, 3.53 3.53
low from −5 days prior to inoculation (Additional file 3) through +3 days postinoculation (Additional files 2 and 3), increased markedly after day +3 postinoculation, and peaked on day +10 (Figure 3). Average SUVs ± SDs in all surviving animals on day +10 postinoculation were 12.02 ± 2.00 (SUVmean), 24.48 ± 3.01 (SUVmax), 16.65 ± 2.14
(SUVthreshold), 17.69 ± 0.69 (mSUVthreshold), and 16.98 ±
1.84 (SUVfixed volume) (Figure 3a,b,c,f). Similar to the SUVs
obtained from LNs prior to inoculation, the values were comparable among SUVfixed volume, mSUVthreshold, and
SUVthresholdbut were always above SUVmeanand less than
the SUVmaxby 30% to 40%. In addition, SUVmeanfor each
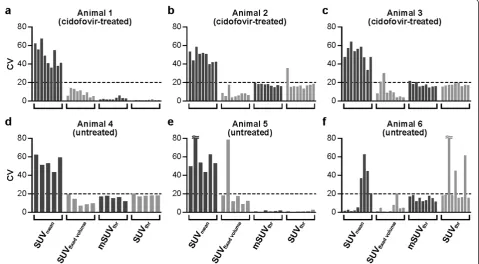
of the animals were characterized by substantial SD as a re-sult of great SUV variability of the voxels included in the calculation, which led to coefficients of variation (CV) for SUVmean between 40% and 60% on most scanning
days (Figure 4). In contrast, the CVs for SUVfixed volume,
mSUVthreshold, and SUVthresholdwere rarely greater than
20%. These higher CV values were mostly observed on the images from the baseline scans with a low rate of LN metabolic activity that was comparable to surround-ing tissue.
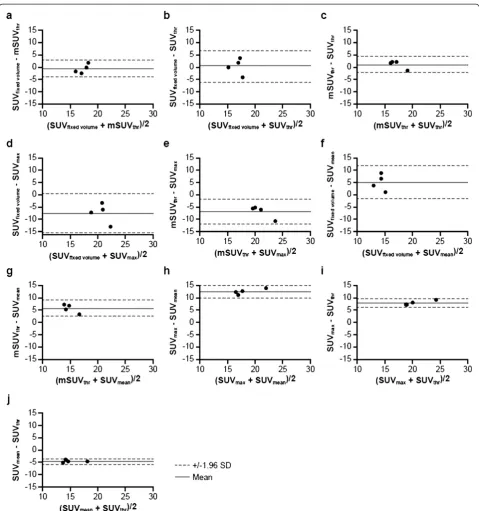
For the peak18F-FDG uptake observed in survivors on day +10 postinoculation, the best correspondence was between SUVfixed volume and mSUVthreshold (Figure 5a).
The mean difference and SD between the two measure-ments were (−0.71) ± 1.84. Similar agreement was
between mSUVthreshold and SUVthreshold with the bias of
(1.043) ± 1.71 (Figure 5b) and between SUVfixed volume
and SUVthreshold, but the SD was greater between the
latter two SUV methods (Figure 5c). The Bland-Altman plot revealed poor agreement between SUVfixed volume
and SUVmax, mSUVthresholdand SUVmax, SUVfixed volume
and SUVmean, mSUVthresholdand SUVmean, and SUVmean
and SUVthresholdas shown by the mean difference between
any of the two pairs of 5 or greater or less than −5 (Figure 5d,e,f,g,h). Very poor agreement was found be-tween SUVmax and SUVmean (Figure 5i) and between
SUVmax and SUVthreshold (Figure 5j); the bias and SD
be-tween the two measurements were (12.5 ± 1.2) and (7.8 ± 0.89), respectively.
with SUVfixed volumeand mSUVthreshold only (statistically
significant interaction between moribund and surviving groups,p= 0.006 andp= 0.0164, respectively, Figure 6b,c). Other SUV methods did not distinguish between changes in18F-FDG-PET uptake in moribund and surviving groups (Figure 6d,e,f). Bonferroni’s multiple comparison test speci-fied a statistically significant increase in18F-FDG uptake in moribund group on days +3 or +4 postinoculation com-pared with surviving group (adjustedp= 0.0037 andp= 0.0001, for mSUVthresholdand SUVfixed volume,respectively).
No statistically significant effects were found between cidofovir-treated and untreated groups.
Discussion
In this paper, we compared the agreement between con-ventional and modified VOI metrics to identify which metric(s) provide(s) reproducible SUVs when monitoring
18
F-FDG uptake in the LN over the course of monkey-pox virus infection (Table 2). The interscan data repro-ducibility for the LN volume in baseline scans ensures consistency in defining the whole LN boundaries on CT images and indicates the degree of reliability of VOI for SUVmean calculation. Among five methods for the SUV
calculation, SUVmax demonstrates the worst agreement
between three baseline scans. These results confirm findings from similar studies involving cancer patients
[15,20]. Replicate scans performed within a short period of time on the same patient using an identical technique often produce poorer interstudy reproducibility for SUVmax than for SUVs averaging greater volumes [15].
Taking into account the low baseline rate of LN meta-bolic activity that was comparable to the background rate in surrounding tissue and small LN size, the repeat-ability of SUV measurement for the baseline scans in our study is improved by increasing the volume in-cluded in other VOI metrics.
Overall, the qualitative pattern of changes in LN 18 F-FDG uptake over the course of monkeypox virus infec-tion is similar between SUVs with the five VOI metrics evaluated in this study (Figure 3). However, SUVs vary substantially depending on VOI definition. The SUVs ob-tained with SUVthreshold,mSUVthreshold, and SUVfixed volume
VOI metrics are within similar ranges and always above the range for the SUVmean and below the SUVmax.
SUVmaxcould be the most attractive method to use for
monitoring an immune response using multiple sequen-tial PET scans because SUVmax is independent of the
observer and simple to apply, Table 2 [10,14,23]. Despite these advantageous properties, the use of SUVmax is
greatly influenced by adverse effects of noise [21]. This weakness of SUVmax in combination with a random
voxel location limit the ability of SUVmax not only to
Figure 4CV for SUVmean, SUVfixed volume, mSUVthreshold, and SUVthresholdcalculated for each scanning session in each animal.Each
reproduce the measurement under normal conditions (baseline scans) but also to quantify reliably real changes in the LN metabolic activity during viral infection.
The major drawback of SUVmean is the time
consum-ing process of manual LN delineation on each of the
slices in the 3D CT images set. Similar to small tumors, LN PET images are difficult to align perfectly with CT images that often have poor soft tissue contrast. As a re-sult, individual SUVmeanduring infection could be
under-estimated by inclusion of voxels with lower metabolic Figure 5Comparison of SUVs in LNs on day 10 postinoculation with monkeypox virus of survivors.Pairwise comparisons were performed between SUVs with varied VOI metrics:(a)SUVfixed volumevs mSUVthreshold,(b)SUVfixed volumevs SUVthreshold,(c)mSUVthresholdvs SUVthreshold,
(d)SUVfixed volumevs SUVmax,(e)mSUVthresholdvs SUVmax,(f)SUVfixed volumevs SUVmean,(g)mSUVthresholdvs SUVmean,(h)SUVmaxvs SUVmean,
(i)SUVmaxvs SUVthreshold, and(j)SUVmeanvs SUVthresholdin four surviving animals. Dashed lines show the limits of agreement, and solid lines
Figure 6SUVs in the axillary LN during monkeypox virus infection in surviving and moribund groups.SUVs were assessed by five methods for VOI metrics,(a)SUVfixed volume,(b)mSUVthreshold,(c)SUVmax,(d)SUVmean, and(e)SUVthreshold, in four surviving and two
moribund animals.
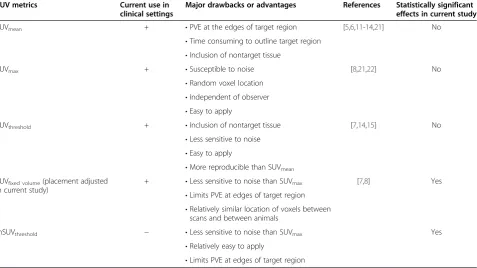
Table 2 Advantages and drawbacks of SUV methods with different VOI metrics used in the current study [5-8,11-15,21,22]
SUV metrics Current use in
clinical settings
Major drawbacks or advantages References Statistically significant effects in current study
SUVmean + •PVE at the edges of target region [5,6,11-14,21] No
•Time consuming to outline target region
•Inclusion of nontarget tissue
SUVmax + •Susceptible to noise [8,21,22] No
•Random voxel location
•Independent of observer
•Easy to apply
SUVthreshold + •Inclusion of nontarget tissue [7,14,15] No
•Less sensitive to noise
•Easy to apply
•More reproducible than SUVmean SUVfixed volume(placement adjusted
in current study)
+ •Less sensitive to noise than SUVmax [7,8] Yes
•Limits PVE at edges of target region
•Relatively similar location of voxels between scans and between animals
mSUVthreshold − •Less sensitive to noise than SUVmax Yes
•Relatively easy to apply
activity from surrounding tissue when manually defining the LN boundaries on CT images (Figure 6e). Partial-volume effect (PVE) at the edges is another factor contrib-uting to underestimation of the values with SUVmean
[5,22,24]. Consequently, SUVmeanis characterized by
sub-stantial data variability within the VOI as shown by CVs generally greater than 40% (Figure 4). Similarly, the dy-namic range of the SUVmeanis the widest compared with
other methods (see Additional file 4).
The use of threshold-based methodology is attractive since the LN delineation on 18FDG-PET images is easy to perform, and this method provides more reproducible measures than SUVmaxand SUVmean[7,14]. A
disadvan-tage of the threshold technique is that the threshold is chosen rather arbitrarily, and only metabolically active tissue can be used for its application. Setting a threshold in normal LNs is more difficult compared with active LNs as metabolic activity in normal LNs appears to be similar to that in surrounding tissue (Additional files 2 and 5). At early time points postinoculation, the18F-FDG uptake in surrounding tissue is often higher than that in the LN leading to an inclusion of the majority of the voxels outside the LN edges in SUVthreshold computation
(Figure 1b, Additional file 2). Similarly, this method proved to be unsuitable to monitor tumor response after treatment since nontumor tissue is very often also in-cluded in the VOI [14]. To eliminate inclusion of voxels from surrounding tissue with high 18F-FDG uptake, we limited the volume for thresholding by placing a spherical VOI in the middle of a LN. This modification in the pro-cedure improves data variability as shown in Figure 4.
SUVfixed volume focuses on the metabolic response
within a restricted location of the LN taking into ac-count changes in LN shape and size in rhesus macaques over the course of infection. This VOI metric includes selected voxels from a slice in the middle of a LN, where metabolic activity is usually higher compared with the LN edges, and covers relatively similar locations standard-ized between different animals and scanning sessions. Thus, by avoiding the edges of the LN, we minimize the PVE associated with SUVmean metrics, and, similar to
mSUVthreshold, SUVfixed volumeexcludes voxels from tissues
surrounding the LN. SUVfixed volume and mSUVthreshold
demonstrate the best agreement among other SUVs between the values for the peak response in survivors (Figure 6). These two methods are associated with similar statistically significant increases in 18F-FDG uptake in moribund group at day +3 or +4 postinoculation of mon-keypox virus compared with surviving group.
There are several limitations in our present work. Al-though the size of the LNs assessed in this study was within the scanner resolution, PVE correction was not applied. The best method to correct for PVE has yet to be determined as such correction by itself can produce a
bias in measured uptake. Further studies are needed to explore the relevance of PVE correction in the context of PET imaging of the LN immune response.
The aim of this preliminary study in a limited number of subjects is to compare different methods for deter-mining the SUV and choose the method(s) with the best agreement to be applied in future characterization of a LN response to viral infection. The low number of sub-jects is not sufficient to demonstrate whether other more subtle effects (e.g., treatment effects), besides differentiat-ing between disease outcomes, can be demonstrated from application of the SUVfixed volume and mSUVthreshold
met-rics. The current data do not provide any explanation for the lack of difference between treated and untreated survi-vors in terms of18FDG uptake by the LN. Perhaps the lack of difference may be related to the sensitivity of the methods or the contribution of other processes not associ-ated with metabolic activity.
Also, we cannot rule out the possibility that differences at day +3 or +4 postvirus inoculation could be explained by a suboptimal study design. To ensure consistency in viral stock properties (e.g., titers, number of passages) and in inoculation procedures, all NHPs were infected on the same day (day 0). However, imaging of treated and untreated groups was staggered over 2 days (e.g., days +3 or +4 postinoculation) to accommodate PET scanner availability and duration of pre- and postscan procedures in sick animals in a biosafety level 3 environment. Despite these limitations, a similar pattern of changes in
18
F-FDG uptake in the LNs is observed in treated and un-treated surviving NHPs irrespective of timing of scans but is not observed between untreated surviving and mori-bund animals scanned on the same day. Future studies with larger group of animals and improved study design will be able to clarify this issue. In addition, an intra- and interrater reliability evaluation of LN volume and SUVs should be considered in further studies. Another point for potential criticism for the current study could be the lack of ground truth for LN18F-FDG uptake.
Conclusions
We confirmed results of previous studies that quantifica-tion of changes in 18F-FDG-PET is highly sensitive to the method applied for PET image analysis. Evaluation of multiple approaches is necessary in choosing appro-priate method(s) to monitor changes in LN metabolic activity during progression of infection. Results of our study indicate that SUVfixed volumeand mSUVthresholdare
statistically significant difference between moribund and surviving groups at an early stage of monkeypox virus infection that is not detected with the other three methods. Therefore, SUVfixed volume and mSUVthreshold are the
pre-ferred approaches rather than SUVmax, SUVthreshold, or
SUVmeanfor quantitative analysis of LN immune response
over the course of monkeypox virus infection using
18
F-FDG-PET. Consequently, these preferred methods may provide better tools for establishing 18F-FDG up-take by the LNs as a marker of functional response at an early stage of monkeypox virus infection.
Additional files
Additional file 1:The macaque preparation, clinical course, and histological analyses following intravenous monkeypox virus challenge.
Additional file 2:Elevated18F-FDG uptake in tissue surrounding the LN on day 3 after virus inoculation.Maximum intensity projection (MIP) movie and representative18F-FDG-PET images fused with CT
images of an axillary LN in sagittal view acquired -5 days before and day +3 and 10 after virus inoculation. High18F-FDG uptake is observed in tissue surrounding the LN on day +3 after virus inoculation.
Additional file 3:Elevated18F-FDG uptake in axillary LN of an
animal that eventually became moribund.MIP movie and
representative18F-FDG-PET images fused with CT images of an axillary LN
in sagittal view acquired before and on day 3 after monkey virus inoculation showing elevated18F-FDG uptake in axillary LN of an animal
that eventually became moribund.
Additional file 4:Dynamic range for SUVmean, SUVfixed volume,
mSUVthreshold, and SUVthresholdassessed before and after virus
inoculation.Dynamic range was calculated for single time points before (pre-inoculation days−20,−15, and−5) and after (days +1 or +2, +3 or +4, +7 or +8, +10, +16, and +21) virus inoculation in each animal. On the x-axis, the infection progression is from the left to the right. Data for voxels with negative values are not included.
Additional file 5:Enlarged fused CT/PET images of axillary LN from representative moribund and surviving animals.On day -5 pre- (top row) and day +3 or +4 postvirus (bottom row) inoculation.
Competing interests
The authors declare that they have no competing interests.
Authors’contributions
JD and RFJ were involved in the study design, implementation, data collection, and manuscript preparation. RCR participated in the design of the study, data analysis, and manuscript preparation. JS and CZL were involved in the study implementation and data analysis. JEB and PBJ were involved in study design. SC was involved in development of methods for image quantitation and statistical analysis and wrote the manuscript. All authors read and approved the final manuscript.
Acknowledgements
We thank Jennifer Hufton from the imaging team, Russell Byrum from the NIAID Comparative Medicine Branch, and Comparative Medicine
veterinarians for successful implementation of PET-CT scanning protocols in the biosafety level 3 suite. In addition, we acknowledge Shen Kui for help with statistical analysis. We thank Laura Bollinger and Jiro Wada for outstanding assistance in technical writing and figure preparation of this manuscript on behalf of the Battelle Memorial Institute. This work was supported by the Division of Intramural Research of the National Institute of Allergy and Infectious Diseases (NIAID), Integrated Research Facility (NIAID, Division of Clinical Research), and Battelle Memorial Institute’s prime contract with NIAID (Contract number HHS N272200700016I).
Author details
1
Division of Clinical Research, Integrated Research Facility, National Institute of Allergy and Infectious Diseases, National Institutes of Health, 8200 Research Plaza, Frederick, MD 21702, USA.2Center for Infectious Disease Imaging, Radiology and Imaging Sciences, Clinical Center, National Institutes of Health, 10 Center Drive, Bethesda, MD 20892, USA.3Division of Intramural Research, Emerging Viral Pathogens Section, National Institute of Allergy and Infectious Diseases, National Institutes of Health, 8200 Research Plaza, Frederick, MD 21702, USA.
Received: 22 May 2014 Accepted: 4 September 2014
References
1. Dyall J, Johnson RF, Chen DY, Huzella L, Ragland DR, Mollura DJ, Byrum R, Reba RC, Jennings G, Jahrling PB, Blaney JE, Paragas J:Evaluation of monkeypox disease progression by molecular imaging.J Infect Dis2011,
204:1902–1911.
2. Johnson RF, Dyall J, Ragland DR, Huzella L, Byrum R, Jett C, St Claire M, Smith AL, Paragas J, Blaney JE, Jahrling PB:Comparative analysis of monkeypox virus infection of cynomolgus macaques by the intravenous or intrabronchial inoculation route.J Virol2011,85:2112–2125.
3. Huang SC:Anatomy of SUV. Standardized uptake value.Nucl Med Biol
2000,27:643–646.
4. Thie JA:Understanding the standardized uptake value, its methods, and implications for usage.J Nucl Med2004,45:1431–1434.
5. Adams MC, Turkington TG, Wilson JM, Wong TZ:A systematic review of the factors affecting accuracy of SUV measurements.AJR Am J Roentgenol
2010,195:310–320.
6. Boellaard R, Krak NC, Hoekstra OS, Lammertsma AA:Effects of noise, image resolution, and ROI definition on the accuracy of standard uptake values: a simulation study.J Nucl Med2004,45:1519–1527.
7. Krak NC, Boellaard R, Hoekstra OS, Twisk JW, Hoekstra CJ, Lammertsma AA:
Effects of ROI definition and reconstruction method on quantitative outcome and applicability in a response monitoring trial.Eur J Nucl Med Mol Imaging2005,32:294–301.
8. Vanderhoek M, Perlman SB, Jeraj R:Impact of the definition of peak standardized uptake value on quantification of treatment response. J Nucl Med2012,53:4–11.
9. Borst GR, Belderbos JS, Boellaard R, Comans EF, De Jaeger K, Lammertsma AA, Lebesque JV:Standardised FDG uptake: a prognostic factor for inoperable non-small cell lung cancer.Eur J Cancer2005,41:1533–1541.
10. Benz MR, Evilevitch V, Allen-Auerbach MS, Eilber FC, Phelps ME, Czernin J, Weber WA:Treatment monitoring by 18F-FDG PET/CT in patients with sarcomas: interobserver variability of quantitative parameters in treatment-induced changes in histopathologically responding and nonresponding tumors.J Nucl Med2008,49:1038–1046.
11. Dimitrakopoulou-Strauss A, Hoffmann M, Bergner R, Uppenkamp M, Eisenhut M, Pan L, Haberkorn U, Strauss LG:Prediction of short-term survival in patients with advanced nonsmall cell lung cancer following chemotherapy based on 2-deoxy-2-[F-18]fluoro-D-glucose-positron emission tomography: a feasibility study.Mol Imaging Biol2007,9:308–317. 12. Lucignani G:SUV and segmentation: pressing challenges in tumour
assessment and treatment.Eur J Nucl Med Mol Imaging2009,36:715–720. 13. Higgins KA, Hoang JK, Roach MC, Chino J, Yoo DS, Turkington TG,
Brizel DM:Analysis of pretreatment FDG-PET SUV parameters in head-and-neck cancer: tumor SUVmean has superior prognostic value. Int J Radiat Oncol Biol Phys2012,82:548–553.
14. Vriens D, De Geus-Oei LF, Van Laarhoven HW, Van Der Heijden HF, Krabbe PF, Visser EP, Oyen WJ:Comparison of two region of interest definition methods for metabolic response evaluation with [(1) (8)F]FDG-PET.Q J Nucl Med Mol Imaging2010,54:677–688.
15. Burger IA, Huser DM, Burger C, von Schulthess GK, Buck A:Repeatability of FDG quantification in tumor imaging: averaged SUVs are superior to SUVmax.Nucl Med Biol2012,39:666–670.
16. Tai YC, Ruangma A, Rowland D, Siegel S, Newport DF, Chow PL, Laforest R:
Performance evaluation of the microPET focus: a third-generation microPET scanner dedicated to animal imaging.J Nucl Med2005,46:455–463. 17. Qi J, Leahy RM, Cherry SR, Chatziioannou A, Farquhar TH:High-resolution
18. Press WH:Numerical Recipes in C: The Art of Scientific Computing.2nd edition. Cambridge, UK: Cambridge University Press; 1992. 19. Bland JM, Altman DG:Statistical methods for assessing agreement
between two methods of clinical measurement.Lancet1986,1:307–310. 20. Nahmias C, Wahl LM:Reproducibility of standardized uptake value
measurements determined by18F-FDG PET in malignant tumors.J Nucl Med2008,49:1804–1808.
21. Lodge MA, Chaudhry MA, Wahl RL:Noise considerations for PET quantification using maximum and peak standardized uptake value. J Nucl Med2012,53:1041–1047.
22. Soret M, Bacharach SL, Buvat I:Partial-volume effect in PET tumor imaging.J Nucl Med2007,48:932–945.
23. Huang YE, Chen CF, Huang YJ, Konda SD, Appelbaum DE, Pu Y:
Interobserver variability among measurements of the maximum and mean standardized uptake values on (18)F-FDG PET/CT and measurements of tumor size on diagnostic CT in patients with pulmonary tumors.Acta Radiol2010,51:782–788.
24. Graham M:Quantification of Radiotracer Uptake into Tissue.InMolecular Imaging: Principles and Practice.Edited by Weissleder R, Ross BD, Rehemtulla A, Gambhir SS, Shelton CT. USA: People’s Medical Pub. House; 2010:1258–1270.
doi:10.1186/s13550-014-0049-z
Cite this article as:Cheferet al.:The effect of volume of interest definition on quantification of lymph node immune response to a monkeypox virus infection assessed by18F-FDG-PET.EJNMMI Research 20144:49.
Submit your manuscript to a
journal and benefi t from:
7Convenient online submission
7Rigorous peer review
7Immediate publication on acceptance
7Open access: articles freely available online
7High visibility within the fi eld
7Retaining the copyright to your article