R E S E A R C H
Open Access
A methodological approach to urban
land-use change modeling using infill
development pattern
—
a case study in
Tabriz, Iran
Akbar Rahimi
Abstract
Introduction:In recent years, models of land-use change and urban growth have become important tools for city planners, economists, ecologists, and resource managers. In most models, future land-use changes are forecasted based on past development pattern and expansion to periphery. While today, metropolitan areas employ smart-growth strategies. The main objectives in this study are according to the smart-growth infill. In this approach, transmission of incompatible land uses to the outside of the city boundary, redevelopment, improvement, and renovation of urban old district and worn-out texture and reuse of abandoned land to new urban development are considered. In fact, the objective is the using of the infill development pattern to modeling approach for simulating urban future development using potentials inside the city.
Methods:This paper presents a Land Transformation Model of urban land-use change based on an artificial neural network and a geographical information system. For developing this approach, future development of Tabriz city based on past development trend and infill development pattern is modeled.
Results:The modeling result based on past development pattern shows that the 31.26 % of green spaces and 60.93 % of agricultural land and wasteland will be destroyed and the built area will increase 89.75 % from 2005 to 2021.
Development of infill development pattern model can regularize urban expansion in the coming decades. The result of infill development pattern, show that the built area will increase 40.32 percent and agricultural land and wasteland area decrease 32.67 percent until 2021.
Conclusions:In fact, redevelopment of urban land uses in infill development pattern until 2021, not only preserve the green spaces and agricultural areas but also improve and rehabilitate old and worn-out textures.
Keywords:Land Transformation Model, Infill development, Urban expansion, Sprawl, Artificial neural network, GIS
Introduction
Cities have developed rapidly since the Industrial Revolu-tion, expanding worldwide in conjunction with socioeco-nomic development. However, the rapid growth of urban areas has led to complex problems, including traffic con-gestion, environmental pollution, reduced open space, the deterioration of old downtown centers, and unplanned or poorly planned land development (Lee, 2008). To address these urban problems and to identify approaches for
sustainable development, many researchers have focused on developing urban land-use change-prediction models. These land-use change models identify the best coefficient for predicting growth and land-use changes until the present using data from the past to the present as input for predicting urban land-use change (Jeong et al., 2002).
Models of land-use change, which couple biophysical and socioeconomic drivers, are needed to address the com-plex issue of land-use change and build up sustainable land-use practices and policies (Van Daalen et al., 2002; Lambin and Geist, 2006). Many models have been devel-oped to simulate the outcomes of land-use decisions and Correspondence:[email protected]
Department of Landscape Engineering, University of Tabriz, Bolvare 29 Bahman, Tabriz, Iran
support the analysis and understanding of land-use prac-tices (Verburg et al., 2004). A variety of methods have been used to develop land-use models including those using statistical (Veldkamp and Fresco, 1996), machine learning (e.g., Pijanowski et al. 2002), agent-based (Parker et al., 2003; Alexandridis and Pijanowski, 2007; Matthews et al., 2007), or simple rule-based approaches (Pontius, 2002).
One of the main challenges in spatial planning and de-velopment pattern in the 21st century is urban sprawl. Urban sprawl is defined as a specific form of urban de-velopment with low-density, dispersed, auto-dependent, and environmentally and socially impacting characteris-tics (Hasse and Lathrop 2003). The consequences and negative implications of this type of urban development include increased traffic and demand for mobility (Ewing et al., 2002; Cameron et al., 2004; Kahn, 2000), land-use fragmentation and loss of biodiversity (Alberti, 2005), re-duced attractive landscape (Sullivan and Lovell 2006), and alterations of the hydrological cycle and flooding re-gimes (Bronstert et al., 2002; Carlson, 2004; McCuen, 2003). While today, Metropolitan areas employing smart-growth strategies reap several benefits: the re-gional economy is strengthened, residents’quality of life is enhanced, and outer-area natural resource systems are protected and restored (Burchell et al. 1998). Infill devel-opment is a key component of smart growth. Infill development is the process of developing vacant or under-used parcels within existing urban areas that are already largely developed. Most communities have sig-nificant vacant land within city limits, which, for various reasons, has been passed over in the normal course of urbanization. A successful infill development program focuses on the completion of the existing community fabric. It should focus on filling gaps in the existing urban areas (Municipal Research & Services Center of Washington, 1997).
This study modeled Tabriz future development by applying the infill development approach, and it ex-tended to include two time series satellite imageries from 1989 to 2005 and eight other variables for evaluation of Tabriz expansion. So, the objectives of the present study are as follows:
– To detect and evaluate the use and land-cover change due to urban expansion between 1989 and 2005
– To answer the question what is the land-use situation in 2021
– To analyze Land Transformation Model (LTM) based on past development trend (PDP) and infill development pattern (IDP) in future development, and
– To evaluate the main infill development potentials for Tabriz future development
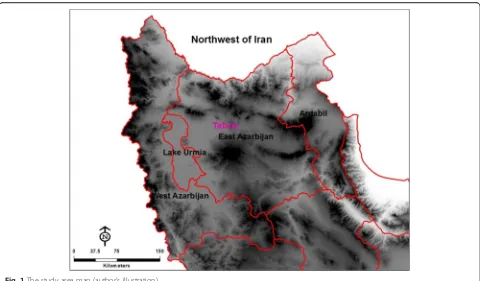
Study area
Tabriz is a city in the northwest of Iran (Fig. 1) and the capital of East Azerbaijan province; it is the fourth lar-gest city in Iran and situated at an altitude of 1350 m at the junction of the Quri River and Aji River; it was the second largest city in Iran until the late 1960s, one of its former capitals, and residence of the crown prince under the Qajar dynasty. Tabriz is located in a valley to the north of the long ridge of the volcanic cone of Sahand Mountain, south of the Eynali mountain range. The val-ley opens out into a plain that slopes gently down to the northern end of Lake Urmia, 60 km to the west. Like other populated cities in developing world, Tabriz has experienced the phenomenon of rapid urban growth leading to the formation of informal and slum settle-ments in peripheral zones of the city. During the recent decades, the city has undergone an irregular and rapid growth and has experienced incredible population and spatial change. This city has always been considered to be one of the major political, cultural, and economic poles of Iran, a unique position making the city much more vulnerable to problems arising from unplanned urban growth (Moosavi, 2011).
Methods
Land Transformation Model (LTM)
In recent years, models of land-use change and urban growth have become important tools for city planners, economists, ecologists, and resource managers (Agarwal et al. 2000; EPA, 2000; Klosterman, 1999; Wegener, 1994). This development was mainly driven by an in-creased availability and usability of multiple spatial data-sets and tools for their processing. The Land Transformation Model (LTM) (Pijanowski et al. 2000) has been developed to simulate land-use change in a variety of locations around the world. The LTM uses population growth, transportation factors, proximity, or density of important landscape features such as rivers, lakes, recreational sites, and high-quality vantage points as inputs to model land-use change. The model relies on geographic information systems (GIS), artificial neural network (ANN) routines, remote sensing, and custom-ized geospatial tools and can be used to help understand what factors are most important to land-use change. In-formation derived from a historical analysis of land-use change can be used to conduct forecasting studies. Land-use data from remote sensing is used for model in-puts and calibration routines (Pijanowski et al. 2002).
result and layers contain input variable values in grid format); (3) integrating all input grids using one of the three techniques, including multicriteria evaluation, ANNs, and logistic regression; and (4) temporally scaling the amount of transitions in the study area in order to create a time series of possible future land uses (Pijanowski et al., 2000).
Artificial neural network (ANN)
ANN models are computer programs that are designed to emulate human information processing capabilities such as knowledge processing, speech, prediction, classi-fications, pattern recognition, and control. The ability of ANN systems to spontaneously learn from examples, “reason”over inexact and fuzzy data, and to provide ad-equate and rapid responses to new information not pre-viously stored in memory has generated increasing acceptance for this technology in various engineering fields and, when applied, has demonstrated remarkable success (Abdul-Wahab et al., 2002). The major building block for any ANN architecture is the processing elem-ent or neuron. These neurons are located in one of the three types of layers: the input layer, the hidden layer, and the output layer. First, the input neurons receive data from the outside environment. Then, the hidden neurons receive signals from all of the neurons in the preceding layer. Finally, the output neurons send infor-mation back to the external environment. The general
procedure for the ANN simulation includes the follow-ing steps:
1. Representation of input and output vectors. 2. Representation of the transfer function. 3. Selection of the network structure. 4. Selection of the random weights. 5. Selection of the learning procedure.
6. Presentation of the test pattern and prediction or validation set of data for generalization (Rahimi,
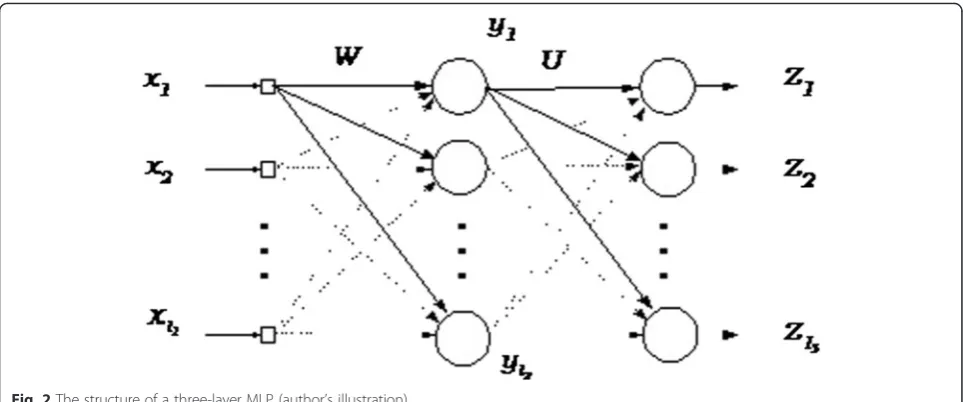
2005). Multilayer perceptron (MLP) is a feed-forward layered network with one input layer, one output layer, and some hidden layers. Figure2shows a MLP with one hidden layer. The task of every node is computed a weight for the sum of its inputs and is passed through a soft nonlinear function. This soft nonlinear or activity function of neurons should be decreased and different (Vakil-Baghmisheh,
2003).
Data preparation
remote sensing owing to its robustness, was imple-mented to classify the images. The ML procedure is a supervised statistical approach to pattern recogni-tion. It estimates the probability of a pixel belonging to each of a predefined set of classes and then as-signs each pixel to the class with the highest probability.
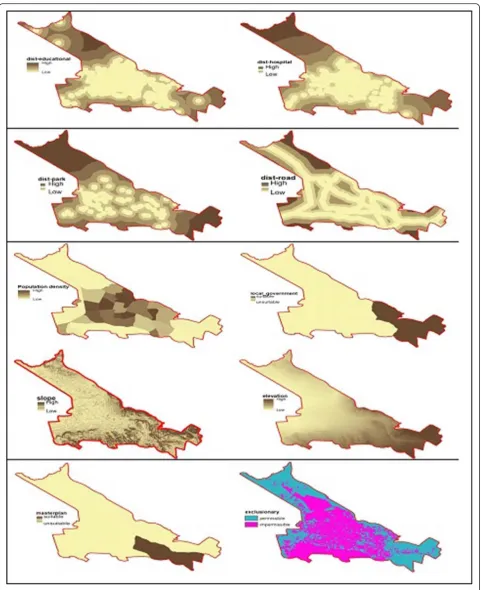
The initial (1989) Landsat 5 (3, 4, and 5 bands) and final (2005) SPOT 5 (1, 2, and 3 bands) satellite im-ages of Tabriz city were subjected to a classification of zones. To prepare data for analysis and modeling, the two land-use vector datasets (multitemporal Land-sat thematic mapper (TM) in 1989 and SPOT data in 2005) were rasterized (a grid of cells was created from polygons of land-use/cover patches). For classifi-cation of satellite image, ERDAS IMAGINE 10 soft-ware is used. Firstly, geometric correlation and georeferencing of images are developed. Finally, im-ages were classified. Along with the two time steps of land use for the city, we used vector data for roads, hospitals, educational, parks, worn-out tissues, popu-lation density, directions of development in master and regional plans and the proposed urban develop-ment direction by local governdevelop-ments, and raster data for elevation and produced slope map (Fig. 3 and Table 1). Using the spatial analyzing tool in ArcGIS, we evaluated data for modeling urban land-use change in LTM. The result of the classification is ana-lyzed in ArcGIS 10 software, and final land-use maps for modeling are prepared. Necessary data for model-ing in LTM are produced in grid format and con-verted to ASCII format in the spatial analyzing tools in ArcGIS software.
After preparation of data in ASCII format, in the first step, ANN is trained using input variables, output
variable (land use map 2005), and exclusionary map. In this research, we used an ANN with nine input layers, nine hidden layers (like the input layer), and one output layer (Fig. 4). In the second step, ANN was tested using variables in the last step and a real change map that was produced in the training step.
In the forecasting step, a transformation cell number (TCN) is calculated based on the value on the popula-tion growth and per capita land-use requirements using follow functions:
TCN¼PiLp
C ð1Þ
TCN¼ðPiþPwÞ Lp
C ð2Þ
Where TCN is the amount of new urban land for future development (number of new cells for future development), Pi is the number of new people from
2005 until 2021, Pw is the number of worn-out tissue
dwellers, Lp is the per capita requirements for urban
land use, and C is the area per cell. For calculation of TCN based on PDP and IDP models, we used func-tions (1) and (2), respectively. In this paper, we used estimated population growth and per capita require-ments based on the estimates of the master plan and regional plan of Tabriz.
In this step, an exclusionary map based on PDP is produced with permissible and impermissible layers. Built areas in 2005, parks, military barracks, protected lands, and lands dedicated for the stadium are the ex-clusionary cells in this paper. But in LTM based on the IDP model, we developed the exclusionary map with potential cells for future development.
For assessment of the simulation and prediction process, root mean square (RMS), percent correct metric (PCM), and kappa coefficient were calculated from the following equations:
RMS¼ 1
N
XN
i−1
pi−oig1=2
(
RMS = root mean square oi= original data
pi= predicted data
PCM¼ TP TCN100
PCM = percent correct metric
TP (real change and predicted change) = true positive TCN = transition cell number
Kappa¼ TN GT þ TP GT − SN GT ⋅ RN GT þ SP GT ⋅ RP GT
1− SN GT ⋅ RN GT þ SP GT ⋅ RP GT Results
Evaluation of past urban land transformation of Tabriz Results for two time series from satellite images confirmed land use change in Tabriz city. In a 16-year difference of images (from 1989 to 2005), the built area changed 107 % and from 4541 ha in 1989 increased to 9400 ha in 2005 Table 1LTM model parameters
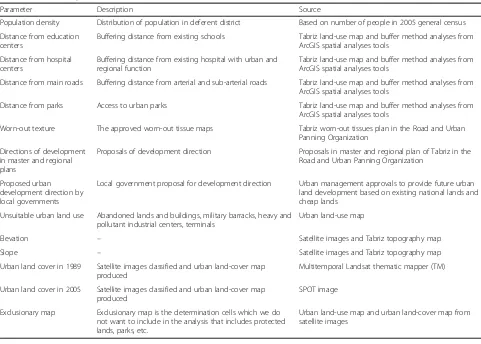
Parameter Description Source
Population density Distribution of population in deferent district Based on number of people in 2005 general census
Distance from education centers
Buffering distance from existing schools Tabriz land-use map and buffer method analyses from ArcGIS spatial analyses tools
Distance from hospital centers
Buffering distance from existing hospital with urban and regional function
Tabriz land-use map and buffer method analyses from ArcGIS spatial analyses tools
Distance from main roads Buffering distance from arterial and sub-arterial roads Tabriz land-use map and buffer method analyses from ArcGIS spatial analyses tools
Distance from parks Access to urban parks Tabriz land-use map and buffer method analyses from
ArcGIS spatial analyses tools
Worn-out texture The approved worn-out tissue maps Tabriz worn-out tissues plan in the Road and Urban Panning Organization
Directions of development in master and regional plans
Proposals of development direction Proposals in master and regional plan of Tabriz in the Road and Urban Panning Organization
Proposed urban development direction by local governments
Local government proposal for development direction Urban management approvals to provide future urban land development based on existing national lands and cheap lands
Unsuitable urban land use Abandoned lands and buildings, military barracks, heavy and pollutant industrial centers, terminals
Urban land-use map
Elevation – Satellite images and Tabriz topography map
Slope – Satellite images and Tabriz topography map
Urban land cover in 1989 Satellite images classified and urban land-cover map produced
Multitemporal Landsat thematic mapper (TM)
Urban land cover in 2005 Satellite images classified and urban land-cover map produced
SPOT image
Exclusionary map Exclusionary map is the determination cells which we do not want to include in the analysis that includes protected lands, parks, etc.
Urban land-use map and urban land-cover map from satellite images
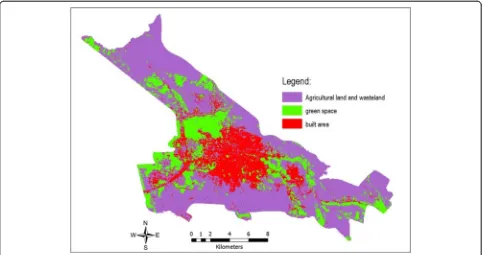
(Figs. 5 and 6). While the population of Tabriz in 1989 to 2005 increased from 1.039 to 1.4 million people. The in-creased population in this period was around 360,000 people, and the change rate of population was 34 % ap-proximately. Therefore, the increase of both population and built areas was not adaptive together, and this result shows that Tabriz has increasingly been faced with a sprawl growth. Also, the unsuitable development program caused 20 % of green space of Tabriz to be demolished in this period. The green space areas reduced from 5475 to 4373 ha, and agricultural lands changed from 15000 to 11000 ha (Table 2). Therefore, 1100 ha in green space and 3700 ha in agricultural lands were destroyed in 1989 to 2005. In this step, an exclusionary map based on PDP is produced with permissible and impermissible layers.
Modeling of urban expansion based on past development pattern (PDP)
Based on past development, a Land Transformation Model is developed for prediction of urban built area alteration. Typically, an ANN is trained to 250,000 cycles, but because of overtraining in this process, the ANN training process is stopped at 50,000 cycles in this research. The best result in RMS, PCM, and kappa coefficient was calculated at 10,000 cycles that were 0.132034, 64.670215, and 0.520152, respectively, and so, the optimum cycle in the test and simulation processes was selected at 10,000 cycles.
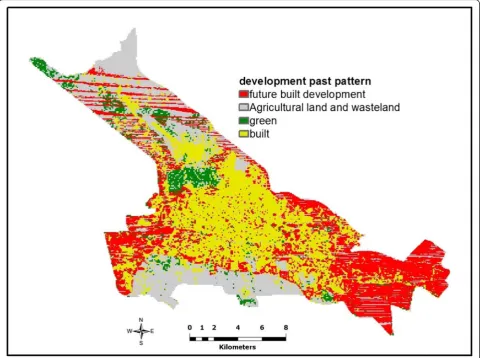
Result in the training step shows that 21,469 cells in 50 × 50 m (built area) were expanded from 1989 to 2005. For calculation of TCN in the PDP model, equation (1) is used. Based on the prediction of the Tabriz population and land use per capita in the master plan and regional plan of Tabriz in 2010, the population of Tabriz will in-crease to 2100,000 people until 2021 and the necessary per capita is 83.3 m2. Therefore, using these estimates in the prediction process, 22,484 cells (50 × 50) are used to produce the probability map (Fig. 7). Result of LTM in PDP shows that the rate of changes in the built area is 89.75 % and an increase from 9401.677 ha in 2005 to 17,839.4 ha in 2021. Green spaces and agricultural land and wasteland classes, with −31.26 and
−60.93 % rates of changes, decrease 3006.6 and 4533.3 ha in 2021, respectively (Table 3).
Symbol Classification Explanation
TN True negative No change in both real and simulated
TP True positive Change in both real and simulated
FN False negative Change in real but not in simulated
FP False positive Change in simulated but not in real
SN Simulated negative Total no change in simulated
SP Simulated positive Total change in simulated
RN Real negative Total no change in real
RP Real positive Total change in real
GT Grand total Total cells transitioned
As is shown in Fig. 7, the most probable development of Tabriz has expanded in the east and northeast like the past development trend. Therefore, in this development pattern, Tabriz will need to increase limit boundaries and change the land use of periphery in the coming decades.
Modeling urban expansion using infill development pattern (IDP)
In the IDP model, the first step is the identification and preparation of urban potential for future development. These potentials include:
1. Redevelopment of vacant and abandoned urban lands: abandoned and vacant lands are an opportunity for city development. Based on the urban land-use map of Tabriz in 2005, the area of abandoned and vacant lands are 1800 ha.
2. Reuse of unsuitable land uses: unsuitable land use in each city is different. In this paper, heavy and pollutant industrial centers, terminals, and military barracks are unsuitable land uses in Tabriz city that have covered 2100 ha of the urban areas. The transmission of these land uses to out of the city receives a great potential for urban development in the future.
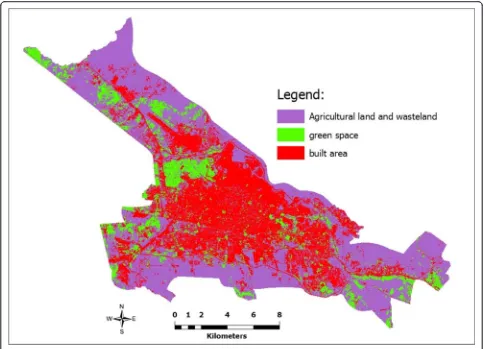
Fig. 6Land-cover map of Tabriz city in 2005 using SPOT data (author’s illustration)
Table 2Land-cover changes of Tabriz city during the 1989 to 2005
Class Land use Area in 1989 Area in 2005 Changes Rate of changes
1 Built area 4541.46 9401.677 4860.217 107.0188
2 Green space 5475.65 4373.960 −1101.690 −20.1198
3 Agricultural land and wasteland 15,362.18 11,603.653 −3758.527 −24.4661
3. Improvement and renovation of worn-out texture: The most areas of worn-out texture in Tabriz con-tain urban old tissue with low building density and abundant lands and buildings and those are the best potential for future development of Tabriz. Based on worn-out texture map, the areas of these tissues are 2500 ha and include 10 % of urban limit area in 2005.
Based on calculation, the area potential for devel-opment is 6300 ha and 25,200 cells (50 × 50 m). For
modeling, nine input layers, nine hidden layers, and one output layer like the previous model is used. In the forecasting process and in producing the exclu-sionary map, worn-out tissue, vacant and abandoned urban lands, and unsuitable land-use maps are coded as development potential and existing green spaces and lands with high potential for natural hazards are coded as development restriction areas.
As mentioned earlier, equation (2) was used for calculation of TCN for the IDP model. By calcula-tion of the current populacalcula-tion in the development Fig. 7The probability map in PDP model (author’s illustration)
Table 3Land-cover changes of Tabriz city during the 2005 to 2021 in LTM based on PDP
Class Land use Area in 2005 Area in 2021 Changes Rate of changes
1 Built area 9401.677 17,839.4 8437.72 89.75
2 Green space 4373.96 3006.6 −1367.36 −31.26
3 Agricultural land and wasteland 11,603.653 4533.3 −7070.35 −60.93
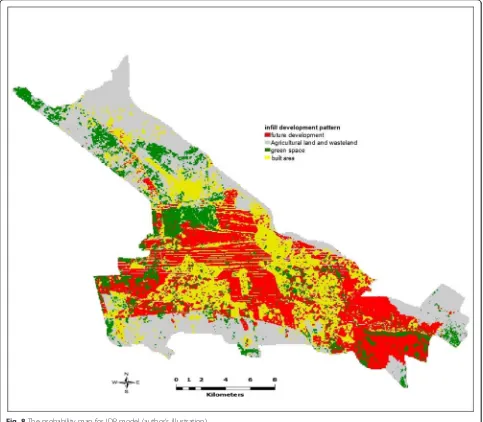
potential area and the population predicted of Tabriz in the master plan and regional plan of Tabriz in 2010 and land use per capita, 35,332 cells 50 × 50 m for probable expansion until 2021 are necessary.
Result in Fig. 8 based on IDP shows that the most devel-opment of Tabriz will expand in develdevel-opment potential areas and some development is in the southeast of Tabriz and other areas. The rate of changes in agricultural land and wasteland class is−32.67 %, and the green space class
that is coded as development restriction areas is un-changed (Table 4).
Not only by using infill development pattern to prevent sprawl development, but also by improve-ment and renewal of inefficient texture, a urban dy-namic is formed.
Figure 9 shows the difference in land-use classes changing in the PDP and IDP models. In IDP model, the built area decreased and green spaces and Fig. 8The probability map for IDP model (author’s illustration)
Table 4Land-cover changes of Tabriz city during the 2005 to 2021 in LTM based on infill
Class Land use Area in 2005 Area in 2021 Changes Rate of changes
1 Built area 9401.68 13,192.6 3790.92 40.32
2 Green space 4373.96 4373.96 0 0.00
3 Agricultural land and wasteland 11,603.65 7812.73 −3790.92 −32.67
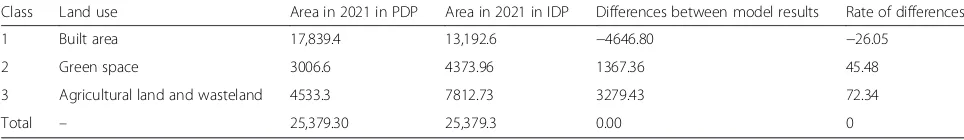
agricultural land and wasteland area increased com-pared to the PDP model. The built class area in IDP is 1392 ha while the area in PDP is 17,839 ha. So, 26 % of built areas in IDP model, have decreased com-pared to the PDP model.Because of green space re-striction in the IDP model, this land-use class area did not change. Whereas, in the PDP model, green space area decreased to 3006 ha. Development prior-ity on existing tissues in the IDP model caused to re-duce development pressure on agricultural land. In fact, in the IDP model, the development main priority is efficient use and redevelopment of existing tissues and refinement of urban land uses(Table 5). In fact, in the IDP model, the development main priority is efficient use and redevelopment of existing tissues and refinement of urban land uses.
In the smart-growth and infill development pattern (IDP), protection of the periphery lands is visible. there are many potential for future development of Tabriz, such as worn-out texture and brownfield. Therefore, smart growth can prevent sprawl and reduce the costs of urban development.
Discussion
Why are urban land-use changes so important?
In recent decades, research on land-use/land-cover change has become an important aspect of global change, or global warming studies, since
land-use/land-cover change is a major factor for global change because of its interactions with climate, ecosystem processes, biogeochemical cycles, biodiversity, and, even more important, human activities (L’opez et al., 2001; Aguilar et al., 2003). For this reason, land-use and land-cover change was, therefore, treated as one core joint project of the International Geosphere Biosphere Program (IGBP) and International Human Dimensions Program on Global Environmental Change (IHDP). In the last 10 years, much more attention has been paid to urban land-use/land-cover change because ecosystems in urban areas are strongly affected by human activities and have close relations with the life of almost half of the world’s population (Stow and Chen, 2002.) With the rapid growth of urban areas engaged in the process of further urbanization, urban land use and land cover (LULC) are always in dramatic flux, further changing terrestrial bio-logical, physical, and meteorological processes, leading to severe ecological and environmental problems (Pejun et al., 2010).
Urban development patterns and challenges
Current urban land uses exhibit inefficient patterns that are of major concern for sustainable development (Leccese et al. 2000; Silberstein and Maser 2000). Low residential densities, sprawl and leapfrog fragmentation of urbanization, rapid open space development at the urban edge without considering the redevelopment of Fig. 9Differences in model results (IDP and PDP models) (author’s illustration)
Table 5Differences between models results
Class Land use Area in 2021 in PDP Area in 2021 in IDP Differences between model results Rate of differences
1 Built area 17,839.4 13,192.6 −4646.80 −26.05
2 Green space 3006.6 4373.96 1367.36 45.48
3 Agricultural land and wasteland 4533.3 7812.73 3279.43 72.34
declining inner cities, and patches of single land use all dominate the current urban form (Galster et al. 2001). Such trends lead to an increasing ethnic and economic separation, deterioration of the environment, loss of agricultural land and wilderness, and the erosion of society’s architectural heritage (Leccese et al. 2000). Re-search suggests that up to 70 % of the consumed energy is dependent on land-use arrangements (Barton 1990). In consequence, the importance of sustainable land-use allocation cannot be underestimated. The ability to understand and predict changes in land-use patterns is necessary for policymakers concerned with a variety of public finance, quality of life, and environmental protection issues. Changes in land-use patterns affect both human and natural systems. Potential social and economic impacts of changes in land-use patterns in-clude increased costs of providing public services, loss of open space, and increased congestion. Potential ecological impacts include loss of habitat, fragmenta-tion of habitat, and alterafragmenta-tion of the hydrological re-gime (Bell and Irwin, 2002).
Urban land-use change modeling
Simulations of land-use change provide an important element in studies related to the preparation, develop-ment, and, to a lesser extent, evaluation of large-scale spatial plans and strategies. Recent surveys of oper-ational models for land-use change are numerous. Brias-soulis (2000) offers an extensive discussion of the most commonly used land-use change models and their theor-etical backgrounds. Waddell and Ulfarson (2003) and Verburg et al. (2004) offer more concise overviews and focus on the future directions of research in this field. A cross-sectional overview of current progress on the ana-lysis of land-use change processes, the exploration of new methods and theories, and the application of land-use simulation models are documented in a recent book by Koomen et al. (2007).
In recent years, the use of computer-based models of land-use change and urban growth has greatly increased, and they have the potential to become important tools in support of urban planning and management. This de-velopment was mainly driven by increased data re-sources, improved usability of multiple spatial datasets, and tools for their processing, as well as an increased ac-ceptance of models in local collaborative decision-making environments (Klosterman, 1999; Sui, 1998; We-gener, 1994). However, the application and performance of urban models strongly depend on the quality and scope of the data available for parameterization, calibration, and validation, as well as the level of un-derstanding built into the representation of the pro-cesses being modeled (Batty & Howes, 2001; Longley & Mesev, 2000). In recent years, models of land-use
change and urban growth have become important tools for city planners, economists, ecologists, and resource managers (Agarwal, et al., 2000). This development was mainly driven by an increased availability and usability of multiple spatial datasets and tools for their processing (e.g., GIS). Community-based collaborative planning and consensus-building efforts in urban development have also been strengthened by the new data and tools at the local level (Herold et al., 2005).
Smart growths and infill development
Municipal governments are adopting smart-growth prin-ciples to deal with forms and patterns of urban develop-ment that planners and organizations have deemed unsustainable (Downs, 2005; Song, 2005). Undesirable urban features include unlimited outward development; “leapfrog” expansion of new, low-density developments; uncoordinated planning; and large-scale conversion of open space, farm lands, and environmentally sensitive lands to urban uses (Burchell et al. 2000; Downs, 2005). The smart-growth concept underscores the negative consequences of undesirable urban develop-ment patterns, which includes unlimited outward and automobile-dependent types of urban development. Instead, it calls for compact, diverse, and walkable developments and more environmentally friendly urbanization. Since its conception, many public and private planning agencies and organizations have en-dorsed this concept (Arku, 2009).
and large-scale conversion of open space and environmen-tally sensitive lands to urban uses (Filion 2003; Filion and McSpurren 2007; Downs 2005). The concept calls for fo-cusing future growth on existing built-up areas to estab-lish a compact, efficient, and environmentally sensitive pattern of urban development that provides people with various transportation systems and a range of housing and employment choices. Smart growth does not imply no growth; rather, it emphasizes revitalizing the already-built-up environment and, to the extent necessary, fostering compact urban development.
Smart-growth development projects are compact and walkable, offer a mix of uses, and create a sense of place. Such projects on infill sites have environmental benefits because they can reduce development pressure on outly-ing areas, helpoutly-ing to safeguard lands that serve important ecological functions; can reduce the amount that people drive, improving air quality and reducing greenhouse gas emissions; and can lead to the cleanup and reuse of formerly economically viable but now abandoned sites, in-cluding those contaminated with hazardous substances (EPA, 2014). Infill development occurs in a built-up neigh-borhood, often using vacant land or rehabilitating existing properties.
Developers of all sizes—from independent, small-scale firms to large, publicly traded companies—are building infill projects throughout the country and are doing so profitably. Developers have sought infill projects as an opportunity to participate in flourishing downtown mar-kets. Opportunities for infill development exist in cities and towns throughout the country—infill is now a sig-nificant and growing share of residential construction in many metropolitan regions. Many corporations are moving to infill locations, in part because they recognize the competitive advantages of being closer to the central city. Lower infrastructure costs and higher rent and sales prices for infill projects will help make infill projects profitable for developers, supporting neighborhoods that are better for the environment and improve quality of life (EPA, 2014).
Urban development patterns and land-use changes in Iranian cities
There is evidence that some of the Iranian cities are ex-periencing urban sprawl. The presence of urban sprawl within urban development patterns and the resulting negative impacts have been studied in a number of stud-ies. Although the observations are limited in number, they cover large metropolitan areas like Tehran (Roshan et al., 2009), Mashhad (Hosseini et al., 2010a), Tabriz (Sadrmosavi and Rahimi, 2012), and Kerman (Hosseini et al., 2010b) to mid-sized cities like Yazd (Ebrahimpour-Masoumi, 2012) and Urmia (Mobaraki et al., 2012). In an urban development pattern point of view, urban
sprawl in the Iranian cities has particular characteristics. Today’s massive sprawl is only a part of urban transfor-mations that aimed at preparing the urban form of the cities for car use. These governmental efforts that took place between 1930 and 1960 not only changed the urban textures of the traditional and organic cities but also influenced the lifestyle of the urban dwellers by easing motorized travels. In recent years, urban sprawl in Iranian cities constructed and decreased garden plots, forest, and agricultural areas (Ebrahimpour-Masoumi, 2012).
Many studies have evaluated urban land-use changes and urban future expansion. In most studies, GIS and RS data for evolving urban expansion (Xiao et al., 2006, Jin-Song et al., 2009, Peijun et all., 2010), remote sensing and spatial metrics application in urban modeling (Her-old et al., 2005), and future land-use changes are fore-casted based on past development pattern and expansion to periphery (L’opez et al. 2001) and urban sprawl (Walker, 2001). But employment of smart-growth strategies for future expansion is a new strategy. In this paper, we evaluated changed urban land use in recent decades using GIS and RS data and modeled future land-use changes, and also, we examined the infill devel-opment pattern for Tabriz future develdevel-opment with a new method (LTM).
In most models, future land-use changes are fore-casted based on past development patterns. In fact, they modeled the continuity of urban land-use changes based on past expansion process such as urban sprawl. But in this paper, we used infill development pattern for analyz-ing this pattern in future development. So, the main ad-vantage of this research compared with other studies is, in addition to the modeling of urban development based on past trends and warning of future development prob-lems for planners and decision makers, we used a new approach to urban future development. In fact, this study also highlights the problems of the PDP and sug-gests a new method and strategy for control of urban fu-ture development modeling using smart growth based on infill development.
Conclusions
community development practices. in the last decades, Concentrated industrial zones in Iranian cities, in-creasingly expanded urbanization and development of cities to periphery, demolished agricultural lands, gar-dens, and green spaces. Tabriz city also is not exempt in this development pattern, and this sprawl develop-ment has destroyed green spaces and agricultural areas. The result of satellite image classification from 1989 to 2005 shows that rate of changes in built areas has been 107 % while the change rate of popu-lation was less than 34 %. The future development of Tabriz using the PDP model will destroy green spaces and agricultural areas. But the result of the IDP model shows that the green spaces and agricultural areas are protected. So, for land protection and achievement of urban sustainable development in Tabriz, the urban managers attend to the infill opment pattern and use this pattern for future devel-opment of cities.
Competing interests
The author declares that he/she has no competing interests.
Received: 14 July 2015 Accepted: 5 January 2016
References
Abdul-Wahab SA, Al-Alawi SM (2002) Assessment and prediction of tropospheric ozone concentration levels using artificial neural networks. Environ Model Softw 17:219–228
Agarwal C, Green GL, Grove M, Evans T, Schweik C (2000) Published jointly by the US Forest Service and the Center for the Study of Institutions, Population, and Environmental Change (CIPEC). University, Indiana, A review and assessment of land use change models: dynamics of space, time, and human choice Aguilar AG, Ward PM, Smith CB Sr (2003) Globalization, regional development,
and mega-city expansion in Latin America: analyzing Mexico City’s peri-urban hinterland. Cities 20:3–21
Alberti M (2005) The effects of urban patterns on ecosystem function. Int Region Sci Rev 28(2):168–192
Alexandridis K, Pijanowski B. (2007) Assessing multi-agent parcelization performance in the MABEL simulation model using Monte Carlo replication experiments. Environment and Planning B: Planning andDesign 34, 223–244. Arku, G. (2009) Rapidly growing African cities need to adopt smart growth
policies to solve urban development concerns, urban forum, Springer Science + Business Media B.V. 2009, 20:253–270.
Barton H. (1990) Local global planning, The Planner, 26, October, pp.12-15 Batty M & Howes D. (2001) Predicting temporal patterns in urban development
from remote imagery. In J. P. Donnay, M. J. Barnsley, & P. A. Longley (Eds.), Remote sensing and urban analysis (pp.185–204). London and New York: Taylor and Francis.
Bell KP, Irwin EG (2002) Spatially explicit micro-level modelling of land use change at the rural–urban interface. Agric Econ 27:217–232 Briassoulis H. (2000) Analysis of land use change: theoretical and modeling
approaches. In: The web book of regional science (http://www.rri.wvu.edu/ regscweb.htmAQ43). Regional Research Institute, West Virginia University. Bronstert A, Niehoff D, Bürger G (2002) Effects of climate and land-use change on
storm runoff generation: present knowledge and modeling capabilities. Hydrol Process 16:509–529
Burchell RW, Naveed A, Shad DL, Hilary P, Anthony D, Samuel S, Judy SD, Terry M, David H, Michelle G (1998) Costs of sprawl revisited: the evidence of sprawl’s negative and positive impacts. National Academy Press, Washington
Burchell RW, Listokin D, Gallery CC (2000) Smart growth: more than a ghost of urban policy past, less than a bold new horizon. Housing Policy Debate 11:821–879
Cameron I, Lyons TJ, Kenworthy JR (2004) Trends in vehicle kilometres of travel in world cities, 1960–1990: underlying drivers and policy responses. Transp Policy 11:287–298
Carlson TN (2004) Analysis and prediction of surface runoff in an urbanizing water-shed using satellite imagery. J Am WaterResour Assoc 40(4):1087–1098 Downs A (2005) Smart growth: why we discuss it more than we do it. J Planning
Assoc 71(4):367–378
Ebrahimpour-Masoumi, H. (2012), Urban sprawl in Iranian cities and its differences with the western sprawl, Spatium International Review, No. 27, 12–18 Ebrahimpour-Masoumi H (2012b) A new approach to the Iranian urban planning,
using neo-traditional development. PhD Dissertation, TU Dortmund, Dortmund
Environmental Protection Agency (2000). Projecting land use change: A summary of models for assessing the effects of community growth and change on land use pattern. http://www.epa.gov/cbep/tools/reportfinal3.pdf (access: April 2001)
EWING R, PENDALL R, CHEN D (2002a) Measuring sprawl and its impact, smart growth America., Washington D.C
Filion P, McSpurren K (2007) Smart growth and development reality: the difficult coordination of land use and transport objectives. Urban Stud 44(3):501–523
Fillion P (2003) Towards smart growth? The difficult implementation of alternatives to urban expansion. Can J Urban Res 12(1):48–70 Galster G, Hanson R, Ratcliffe MR, Wolman H, Coleman S, Freihage J (2001) Wrestling
sprawl to the ground: defining and measuring an elusive concept. Housing Policy Debate 12(4):681–717
Hasse J, Lathrop RG (2003) A housing-unit level approach to characterizing residential sprawl. Photogramm Eng Remote Sens 69:1021–1030 Herold M, Couclelis H, Clarke KC (2005) The role of spatial metrics in the
analysis and modeling of urban land use change. Comput Environ Urban Syst 29:369–399
Hosseini A, Shabanifard M, Rashidi M, Saiydzade MR (2010a) Distribution and determining of urban sprawl in Kerman with emphasis on Kariz Water System. Physics International 1(1):9–15
Hosseini SA, Shahraki SZ, Farhudi R, Hosseini SM, Salari M, Pourahmad A (2010b) Effect of urban sprawl on a traditional water system (Qanat) in the City of Mashhad, NE Iran. Urban Water J 7(5):309–320
Jeong, J.J., Lee, C.M., Kim, Y.I. (2002) Developments of cellular automata model for the urban growth. Journal of the Korea Planners Association. 37(1):27–43 (in Korean).
Jin-Song D, Ke W, Jun L, Yan-Hua D (2009) Urban land use change detection using multisensor satellite images, Soil Science Society of China Published by Elsevier Limited and Science Press. Pedosphere 19(1):96–103
Kahn ME (2000) The environmental impact of suburbanization. J Policy Anal Man- age 19(4):569–586
Klosterman RE (1999) The what if? Collaborative planning support system. Environment and Planning B: Planning and Design 26:393–408
Koomen E, Stillwell J, Bakema A, Scholten HJ (2007) Modelling land-use change; progress and applications. In: Geojournal library, vol 90. Springer, Dordrecht L’opez E, Bocco G, Mendoza M, Duhau E (2001) Predicting land-cover and
land-use change in the urban fringe: a case in Morelia city, Mexico. Landsc Urban Plann 55:271–285
Lambin E, Geist, H. (Eds.), (2006) Land-Use and Land-Cover Change: Local Processes and Global Impacts. Springer, Berlin, New York. 222pp. Leccese M, McCormick K (2000) Charter of the new urbanism., McGraw–Hill Lee H.Y. (2008) An analysis on development capacity of an urbanized area for
urban growth management. Journal of the Korean Urban Geographical Society 11 (1),1–18 (in Korean).
Longley P.A, & Mesev V. (2000). On the measurement and generalization of urban form. Environment and Planning A, 32, 473–488.
Matthews R, Gilbert N, Roach A, Polhill G, Gotts N. (2007) Agent-based land-use models: a review of applications. Landscape Ecology 22, 1447–1459 McCuen RH (2003) Smart growth: hydrologic perspective. J Prof Iss Eng Ed Pr
129(3):151–154
Mobaraki O, Mohammadi J, Zarrabi A (2012) Strategy for sustainable urban development: a case study of Urmia City, Iran. Greener J Soc Sci 2(1):041–049 Moosavi M (2011) An introduction to environmental challenges of life in slum
settlements of Tabriz. (2011) IACSIT Press, Singapore, 2nd International Conference on Humanities, Historical and Social Sciences, IPEDR vol.17 (2011) Municipal Research and Services Center of Washington (MRSC) (1997). Infill
Murai S (1996) GIS workbook (fundamental course). Japan Association of Surveyors, Tokyo, 169 p
Parker D, Manson S, Janssen M, Hoffmann M, Deadman P (2003) Multi-agent systems for the simulation of land-use and land-cover change: a review. Annals of the Association of American Geographers 93, 314–337
Peijun D, Xingli L, Wen C, Yan L, Huapeng Z (2010) Monitoring urban land cover and vegetation change by multi-temporal remote sensing information. Min Sci Technol 20:0922–0932
Pijanowski, B.C., S.H. Gage, D.T. Long & W. C. Cooper (2000). A land
transformation model: integrating policy, socioeconomics and environmental drivers using a geographic information system; In Landscape Ecology: A Top Down Approach, Larry Harris and James Sanderson eds. Press.
Pijanowski BC, Brown DG, Shellito BA, Manik GA (2002) Using neural networks and GIS to forecast land use changes: a land transformation model. Comput Environ Urban Syst 26(6):553e575
Pontius R.G. (2002) Statistical methods to partition effects of quantity and location during comparison of categorical maps at multiple resolutions. Photogrammetric Engineering and Remote Sensing 68, 1041–1049. Rahimi, A. (2005). Analysis of air pollutions caused by unsuitable site selection of
industrial centers in Tabriz city, using artificial neural network. Master thesis in geography and urban planning, Tabriz University.
Roshan G, Rousta I, Ramesh M (2009) Studying the effects of urban sprawl of metropolis on tourism - climate index oscillation: a case study of Tehran City. J Geogr Reg Plan 2(12):310–321
Sadrmosavi MS, Rahimi A (2012) Evaluation of Tabriz spatial expansion and destruction of agricultural areas and green spaces, case study, Tabriz, Iran. J Geogr Urban Reg Land 2(4):99–109
Sierra Club. (2001). Sprawl costs us all: how your taxes fuel suburban sprawl, Sierra Club. 2000. http://www.sierraclub.org/sprawl.
Silberstein J, Maser C (2000) Land-use planning for sustainable development, sustainable community development series. CRC Press LLC, Boca Raton Song Y (2005) Smart growth and urban development pattern: a comparative
study. Int Reg Sci Rev 28(2):239–265
Stow DA, Chen DM (2002) Sensitivity of multi temporal NOAA AVHRR data of an urbanizing region to land-use/land cover changes and misregistration. Remote Sens Environ 80:297–307
Sui DZ (1998) GIS-based urban modeling: practices, problems, and prospects. Int J Geo Inform Sci 12(7):651–671
Sullivan WC, Lovell ST (2006) Improving the visual quality of commercial development at the rural–urban fringe. Landscape Urban Plan 77:152–166 United State Environmental Protection Agency (EPA) (2014) Smart growth and economic success: investing in infill development, Office of Sustainable Communities Smart Growth Program., www.epa.gov/smartgrowth Vakil-Baghmisheh MT, Pavešic N (2003) A fast simplified fuzzy ARTMAP network.
Neural Process Lett 17:273
van Daalen C.E., Dresen L, Janssen M. ( 2002) The roles of computer models in the environmental policy life cycle. Environmental Science and Policy 5, 221–231. Veldkamp A, Fresco L. (1996) CLUE-CR: an integrated multi-scale model to simulate
land use change scenarios in Costa Rica. Ecological Modelling 91, 231–248. Verburg PH, de Nijs TCM, Ritsema van Eck J, Visser H, de Jong K (2004) A method
to analyses neighborhood characteristics of land use patterns. Comput Environ Urban Syst 28:667–690
Waddell P, Ulfarson GF (2003) Introduction to urban simulation: design and development of operational models. In: Stopher P, Button K, Kingsley K, Hensher D (eds) Handbook in transport, vol 5. Transport Geography and Spatial Systems. Pergamon Press, New York
Walker R (2001) Urban sprawl and natural areas encroachment: linking land cover change and economic development in the Florida Everglades. Ecol Econ 37:357–369
Wegener M (1994) Operational urban models: state of the art. J Am Plan Assoc 60(1):17–30
Xiao J, Shen Y, Ge J, Tateishi R, Tang C, Liang Y, Huang Z. (2006) Evaluating urban expansion and land use change in Shijiazhuang, China, by Using GIS and remote sensing. Landscape and urban planning, 75, 69-80.
Submit your manuscript to a
journal and benefi t from:
7Convenient online submission
7Rigorous peer review
7Immediate publication on acceptance
7Open access: articles freely available online
7High visibility within the fi eld
7Retaining the copyright to your article